Polybutylene Terephthalate (PBT) Market Size and Share
Market Overview
| Study Period | 2020 - 2031 |
|---|---|
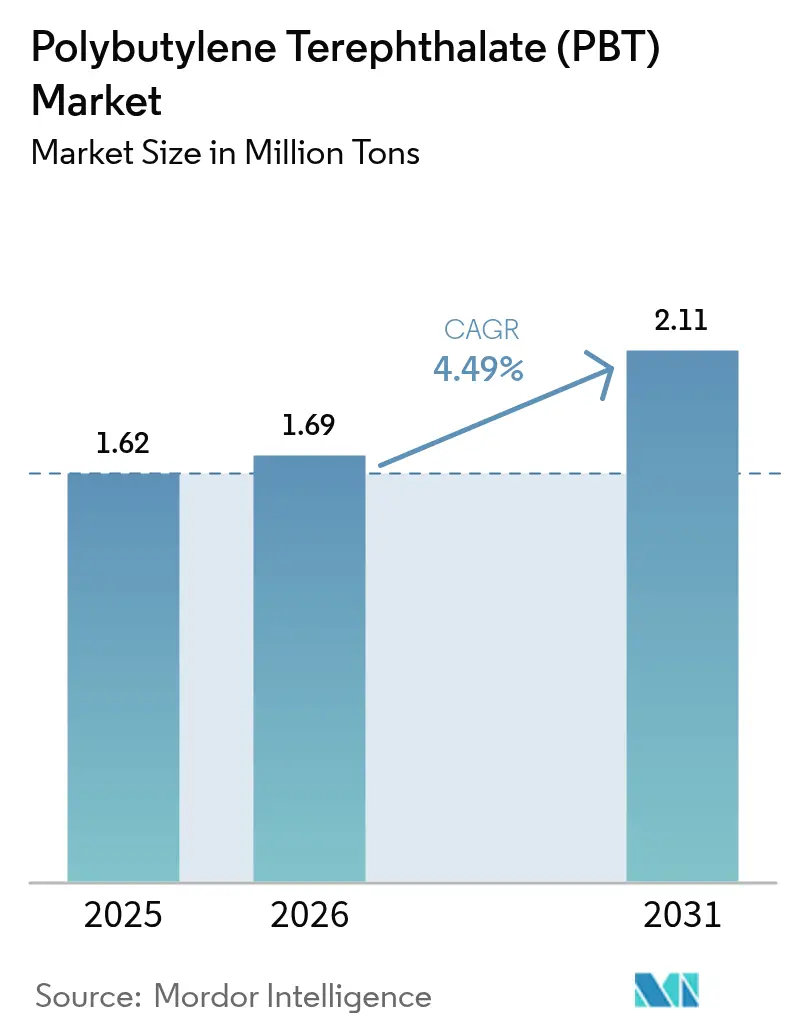
| Market Volume (2026) | 1.69 Million tons |
| Market Volume (2031) | 2.11 Million tons |
| Growth Rate (2026 - 2031) | 4.49% CAGR |
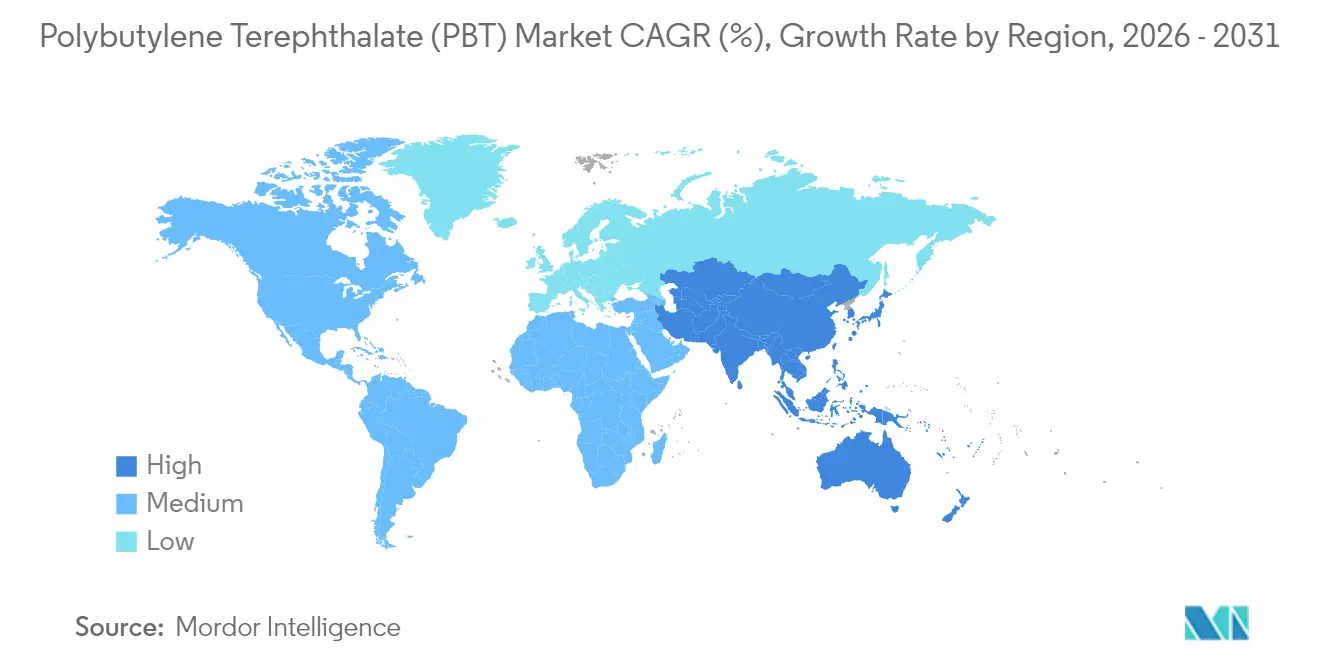
| Fastest Growing Market | Asia Pacific |
| Largest Market | Asia Pacific |
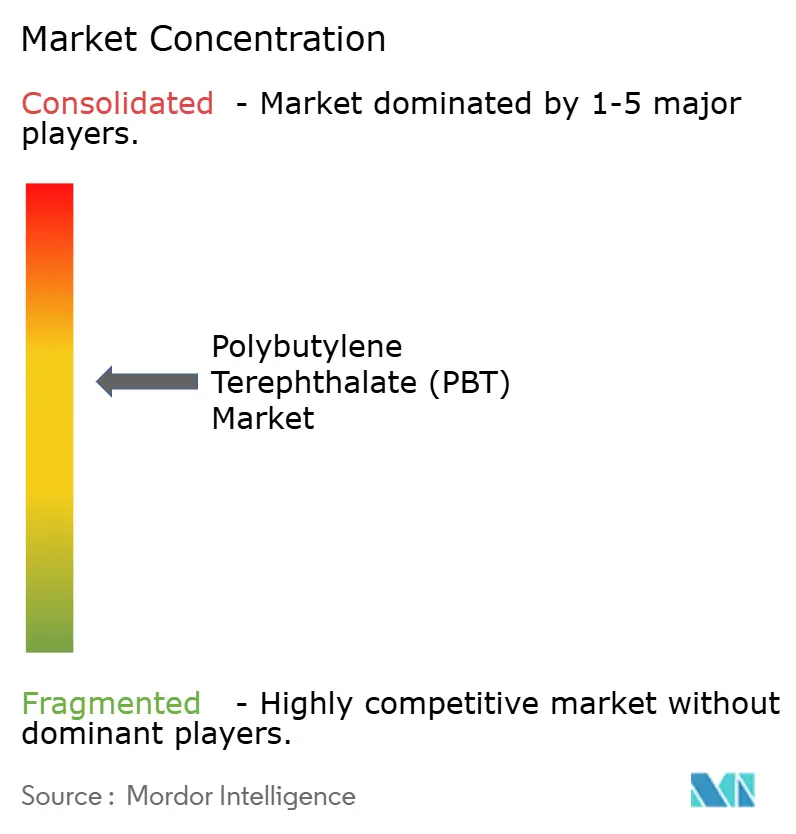
| Market Concentration | Medium |
Major Players *Disclaimer: Major Players sorted in no particular order Image © Mordor Intelligence. Reuse requires attribution under CC BY 4.0. | |
Polybutylene Terephthalate (PBT) Market Analysis by Mordor Intelligence
Polybutylene Terephthalate market size in 2026 is estimated at 1.69 million tons, growing from 2025 value of 1.62 million tons with 2031 projections showing 2.11 million tons, growing at 4.49% CAGR over 2026-2031. This baseline underscores the polybutylene terephthalate market size leadership in engineering thermoplastics that combine dimensional stability, moisture resistance, and the ability to accept a broad additive portfolio. Momentum stems from the convergence of four macro forces: (1) aggressive electrification targets in global vehicle platforms, (2) exponential growth in factory-automation data rates, (3) tightening flame-retardant regulations in consumer devices, and (4) public-policy incentives for recycled engineering-resin content. Together they expand the polybutylene terephthalate market’s relevance beyond its legacy under-hood presence toward high-performance battery-pack, high-speed connector, and precision industrial gear housings. Producer strategies pivot around vertical integration into 1,4-butanediol and glass-fiber supply, while OEMs prize secure local compounding to de-risk logistics, a dynamic that keeps regional pricing spreads narrow despite fresh Asia-Pacific capacity.
Key Report Takeaways
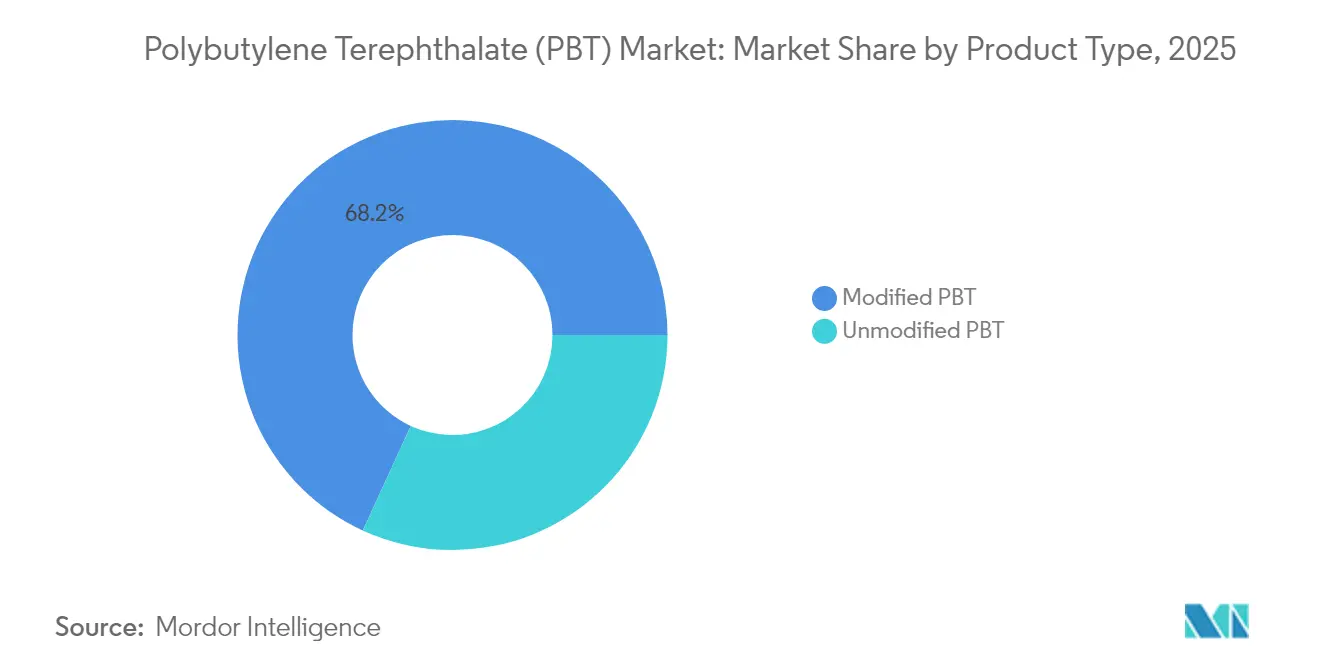
- By product type, modified grades led with 68.15% of polybutylene terephthalate market share in 2025 and are advancing at a 4.87% CAGR through 2031.
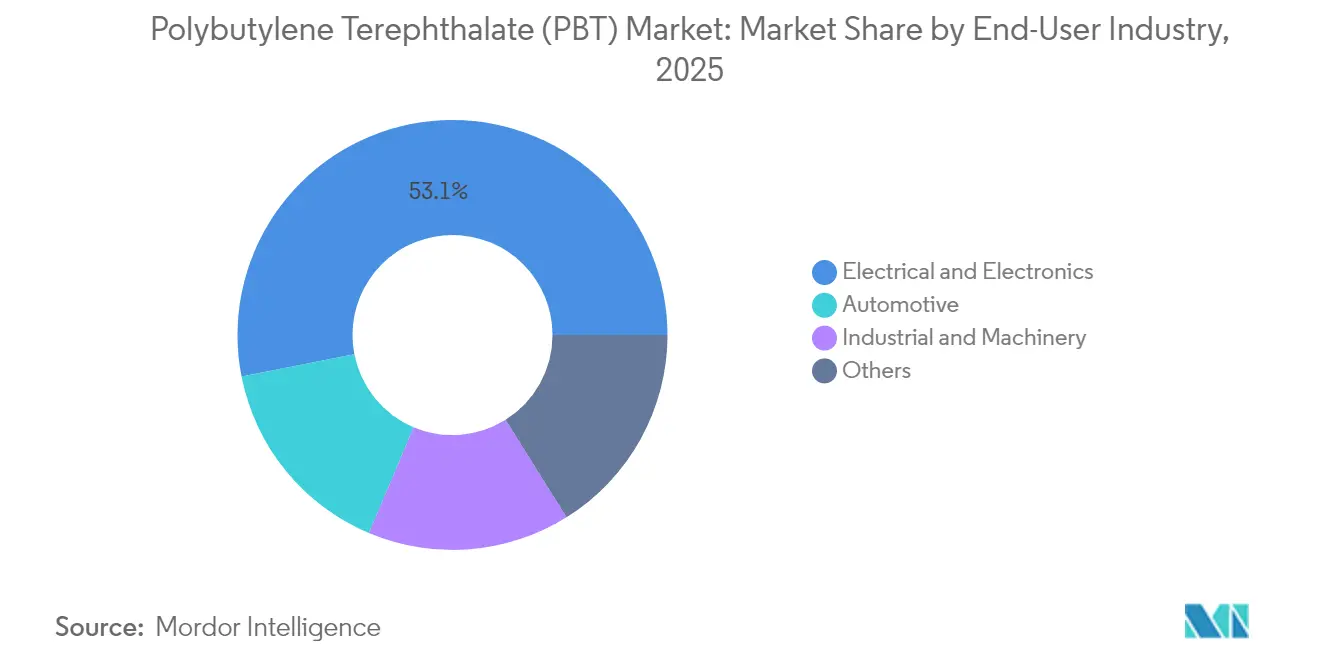
- By end-user industry, electrical and electronics applications accounted for 53.10% of the polybutylene terephthalate market size in 2025 and are advancing at a 4.95% CAGR through 2031.
- By geography, Asia-Pacific commanded 68.30% volume in 2025, and is forecast to record the fastest 4.84% CAGR through 2031.
Note: Market size and forecast figures in this report are generated using Mordor Intelligence’s proprietary estimation framework, updated with the latest available data and insights as of 2026.
Global Polybutylene Terephthalate (PBT) Market Trends and Insights
Drivers Impact Analysis*
| Drivers | (~) % Impact on CAGR Forecast | Geographic Relevance | Impact Timeline |
|---|---|---|---|
| Rapid adoption of high-speed data connectors in industrial automation | +1.2% | Global, with APAC core concentration | Medium term (2-4 years) |
| Asia's accelerating shift from PA66 to PBT in EV battery-pack components | +1.8% | APAC core, spill-over to North America | Short term (≤ 2 years) |
| Mainstream auto lightweighting and metal-replacement trend | +0.9% | Global, with Europe and North America leading | Long term (≥ 4 years) |
| Rising demand for halogen-free FR grades in consumer electronics | +1.1% | Global, with EU and China regulatory drivers | Medium term (2-4 years) |
| Government incentives for recycled engineering plastics content | +0.7% | Europe and North America primarily | Long term (≥ 4 years) |
| Source: Mordor Intelligence | |||


Rapid Adoption of High-Speed Data Connectors in Industrial Automation
Industrial-automation equipment is shifting from serial field-bus architectures to multi-gigabit deterministic Ethernet, a transition that multiplies the number of high-frequency copper and fiber-optic interfaces per factory line[1]TE Connectivity, “Dynamic D8000 Connector Series Technical Specifications,” te.com. Connector housings must guarantee dielectric integrity at continuous ambient temperatures near 80 °C, resist machine-oil contamination, and tolerate repetitive hot-cold cycles. Glass-fiber reinforced UL 94 V-0 polybutylene terephthalate delivers the requisite dimensional stability, enabling plug-and-play IP67 connectors that cut machine-downtime risk. Japanese and German machine builders standardize on halogen-free PBT housings to comply with IEC 61076 cross-mating rules, positioning the polybutylene terephthalate market as the default material in next-generation robotics harnesses. Volume growth further accelerates as predictive-maintenance sensors migrate into every robotic joint, each demanding miniature over-molded PBT connectors that survive 10,000+ torsion cycles without micro-cracks.
Asia’s Accelerating Shift from PA66 to PBT in EV Battery-Pack Components
Electric-vehicle battery manufacturers in China, South Korea, and Vietnam now specify PBT over PA66 for module frames, coolant manifolds, and voltage-sensing connectors owing to lower moisture uptake, superior electrolyte resistance, and tighter dimensional change across 125 °C fast-charge excursions. Cell-to-pack designs amplify these requirements because housings sit closer to high-energy cells. . American Tier-1 suppliers follow suit as they localize battery-component production in Mexico, creating a trans-Pacific demand bridge that cushions Asian producers against domestic price swings. Short-cycle platform refreshes in electric two-wheelers further support recurring formulation upgrades, embedding PBT into a wider mobility universe.
Mainstream Auto Lightweighting and Metal-Replacement Trend
Vehicle mass remains the enemy of driving range. OEMs therefore target every non-structural metallic bracket, cover, and bus-bar enclosure for polymer conversion. With tensile strength exceeding 170 MPa at 30% glass loading and melt flow indices friendly to thin-wall injection, PBT delivers weight savings of 20-40% versus aluminum while maintaining drop-impact resistance under -30 °C winter exposure. Incremental gains in plug-connector density per vehicle propel compounders to develop 1500 V-rated, laser-markable PBT grades that accommodate automated wire-harness assembly. These innovations open a virtuous loop: higher voltage pushes temperature, temperature stresses insulation, insulation demands better PBT, and better PBT accelerates the polybutylene terephthalate market expansion.
Rising Demand for Halogen-Free FR Grades in Consumer Electronics
Regulatory bodies in the European Union and China expand restrictions on brominated and chlorinated flame retardants, moving from voluntary ecolabels toward hard substance bans under RoHS and GB/T standards[2]Bundesumweltministerium, “National Circular Economy Strategy,” bundesumweltministerium.de. Device OEMs now specify phosphorus-nitrogen PBT systems that meet UL 94 V-0 at 0.4 mm while cutting total halogens below 900 ppm. The material’s inherently low dielectric constant minimizes signal cross-talk in high-speed chargers and 240 W USB-C cables. Envalior’s 2024 launch of bio-circular Pocan X-MB, containing 26% mass-balance certified renewable feedstock, underlines how sustainability and compliance intersect to widen the addressable polybutylene terephthalate market for consumer devices. As smartphone OEMs phase in glass-fiber PBT for internal lens-shroud mounts, cumulative grams per handset stay under weight constraints yet add millions of kilograms to annual demand.
Restraints Impact Analysis*
| Restraints | (~) % Impact on CAGR Forecast | Geographic Relevance | Impact Timeline |
|---|---|---|---|
| Volatility of 1,4-butanediol prices linked to bio-succinic acid supply | -0.8% | Global, with Asia-Pacific manufacturing concentration | Short term (≤ 2 years) |
| Slower-than-expected European ICE vehicle production recovery | -0.6% | Europe primarily, with global supply chain effects | Medium term (2-4 years) |
| Tight global glass-fiber supply impacting reinforced-PBT cost | -0.9% | Global, with particular impact on automotive applications | Short term (≤ 2 years) |
| Source: Mordor Intelligence | |||
Volatility of 1,4-Butanediol Prices Linked to Bio-Succinic Acid Supply
Polybutylene terephthalate polymerization hinges on stable butanediol supply. Bio-based routes, though lower-carbon, remain concentrated in a handful of fermentation plants that can shut down for weeks when feed-sugar purity drifts, creating sudden spot-market spikes. Chinese PBT producers responded in 2024 by trimming reactor rates to protect margins, easing resin availability just as EV injection-molding orders peaked. Merchant converters without captive BDO faced delivery delays that rippled into electronics production schedules. While new petrochemical BDO capacity in the Middle East will reduce price stress by 2026, interim volatility lops 0.8 percentage points off the polybutylene terephthalate market CAGR trajectory.
Slower-Than-Expected European ICE Vehicle Production Recovery
European auto failed to reclaim pre-pandemic volume and idling connector-and-sensor capacity that historically consumed high-heat PBT grades. Although EV output rises, it does not yet compensate for the shortfall because EV designs use fewer under-hood parts. Western European compounders therefore operate at 65–70% utilization, exporting surplus to Asia at compressed margins. The imbalance drags on regional profitability and chills capital-spending approvals for next-generation compounding lines, restraining European upside in the polybutylene terephthalate market through at least 2027.
*Our forecasts treat driver/restraint impacts as directional, not additive. The impact forecasts reflect baseline growth, mix effects, and variable interactions.
Segment Analysis
By Product Type: Modified Grades Consolidate Dominance
The modified-grade segment accounts for 68.15% of the overall volume and is on track for a 4.87% CAGR to 2031, underscoring its centrality to the polybutylene terephthalate market. At 30% glass loading, the tensile modulus climbs beyond 10 GPa while the HDT approaches 210 °C, enabling under-hood EV inverter covers that must withstand a 95 °C coolant surge without creep. Phosphorus-based flame-retardant formulations achieve a UL 94 V-0 rating at 0.4 mm with only marginal loss in flow, a breakthrough that enhances cavity-fill rates in 0.25 s cycle times and lowers gate pressures by 12 MPa. Modified grades, therefore, cement preferred-material status in high-density board-to-board connectors, fueling the polybutylene terephthalate market size for this subclass.
Unmodified PBT, retaining relevance where optical clarity or food-contact purity trumps mechanical strength. Medical syringe plungers exploit their low extractables, and additive-manufacturing filaments capitalize on their slow-crystallization window to build warp-free prototypes. Yet share slips incrementally as OEM engineering specifications escalate, channeling incremental demand into modified options. Compounders counter by blending bio-succinic BDO to grant unmodified grades sustainability appeal, reinforcing a modest but stable niche within the broader polybutylene terephthalate market.


By End-User Industry: Electronics Sustain Leadership
Electrical and electronics applications account for 53.10% of global demand and are projected to grow at a rate of 4.95% annually, the fastest among all sectors. Data-center operators raise rack-power densities to over 70 kW, necessitating high-amperage board connectors molded from glass-fiber PBT that combat thermal expansion mismatches with copper pins. Consumer-device OEMs, meanwhile, are shifting to halogen-free grades for safety labeling, thereby expanding volume in small-appliance charger blocks. The polybutylene terephthalate market share for electronics thus remains entrenched, further fueled by 5G small-cell rollouts that are expected to triple the number of outdoor radio units and associated weatherproof connector shells.
Battery-pack standardization—cylindrical, prism, and pouch—multiplies connector SKUs, each requiring color-coded, laser-markable PBT to prevent assembly errors. The industrial-machinery segment benefits from Industry 4.0 retrofits. Collectively, diversified uptake maintains stable end-use distribution, providing an anchoring effect that smooths cyclical swings and bolsters the long-term resilience of the polybutylene terephthalate market size.
Geography Analysis
The Asia-Pacific region accounts for 68.30% of consumption and is forecast to record the fastest 4.84% CAGR through 2031, reflecting the unparalleled integration of monomer, polymer, and compound capacity within the region. The recent expansions in Chongqing are targeted at biodegradable copolymers that unlock packaging end-markets. Such scale secures cost leadership while proximity to electronics and EV supply chains guarantees local offtake, preserving regional dominance in the polybutylene terephthalate market.
Demand in North America is growing as semiconductor reshoring and EV-battery localization compact supply lines. Producers exploit abundant shale-gas derivatives for cost-competitive feedstock, and automotive OEMs in the United States and Mexico drive sustained connector demand. Canadian regulatory pressure for recycled content prompts chemical-recycling investments that may yield the continent’s first closed-loop PBT stream by 2027, enhancing differentiation in the polybutylene terephthalate market.
Despite sluggish ICE vehicle recovery in Europe, the region remains a technology testbed for bio-based feedstock and post-consumer resin initiatives. Continental compounders pilot solvent-based dissolution recycling that retains molecular weight, aiming to recapture 30% of post-industrial waste by 2028. These sustainability advances bolster the region’s premium-grade supply share, even as overall volume languishes. South America, the Middle-East and Africa, together, have potential tied to emerging automotive assembly hubs and expanding telecommunications infrastructure, hinting at future diversification of the polybutylene terephthalate market share distribution.

Competitive Landscape
Global supply is moderately consolidated. Capital deployment focuses on debottlenecking Asia-Pacific polymer lines and adding localized compounding in Mexico, India, and Hungary to meet just-in-sequence automotive delivery mandates in those countries, highlighting geographic agility as a core weapon in the polybutylene terephthalate market. Sustainability differentiators are gathering strategic weight. Patent filings for reactive-extrusion catalysts that enable ambient-pressure depolymerization surged, suggesting a forthcoming wave of closed-loop solutions that may realign brand perceptions and extend product-life value-chains within the polybutylene terephthalate industry. Strategic maneuvering underscores a competitive environment where technology, sustainability cred, and supply-chain intimacy outweigh mere volume leadership, sustaining moderate concentration while preventing dominance by any single actor in the polybutylene terephthalate market.
Polybutylene Terephthalate (PBT) Industry Leaders
Chang Chun Group
Hengli Group Co. Ltd.
Wuxi Xingsheng New Material Technology Co.
SABIC
BASF SE
- *Disclaimer: Major Players sorted in no particular order

Recent Industry Developments
- September 2025: LANXESS AG announced its plans to sell its 40.94% stake in Envalior to Advent International, L.P. by March 2026, potentially reshaping ownership dynamics in the PBT market, where Envalior is a key producer.
- May 2024: BASF SE is expanding its Ultradur polybutylene terephthalate (PBT) production capacity by over 40% in Panoli and Thane, India, by the end of 2025, to meet rising domestic demand and strengthen its market position.


Global Polybutylene Terephthalate (PBT) Market Report Scope
Automotive, Electrical and Electronics, Industrial and Machinery are covered as segments by End User Industry. Africa, Asia-Pacific, Europe, Middle East, North America, South America are covered as segments by Region.| Unmodified PBT |
| Modified PBT |
| Automotive |
| Electrical and Electronics |
| Industrial and Machinery |
| Others |
| Asia-Pacific | China |
| Japan | |
| India | |
| South Korea | |
| Australia | |
| Malaysia | |
| Rest of Asia-Pacific | |
| North America | Canada |
| Mexico | |
| United States | |
| Europe | Germany |
| France | |
| Italy | |
| United Kingdom | |
| Russia | |
| Rest of Europe | |
| South America | Brazil |
| Argentina | |
| Rest of South America | |
| Middle-East and Africa | Saudi Arabia |
| United Arab Emirates | |
| Nigeria | |
| South Africa | |
| Rest of Middle-East and Africa |
| By Product Type | Unmodified PBT | |
| Modified PBT | ||
| By End-User Industry | Automotive | |
| Electrical and Electronics | ||
| Industrial and Machinery | ||
| Others | ||
| By Geography | Asia-Pacific | China |
| Japan | ||
| India | ||
| South Korea | ||
| Australia | ||
| Malaysia | ||
| Rest of Asia-Pacific | ||
| North America | Canada | |
| Mexico | ||
| United States | ||
| Europe | Germany | |
| France | ||
| Italy | ||
| United Kingdom | ||
| Russia | ||
| Rest of Europe | ||
| South America | Brazil | |
| Argentina | ||
| Rest of South America | ||
| Middle-East and Africa | Saudi Arabia | |
| United Arab Emirates | ||
| Nigeria | ||
| South Africa | ||
| Rest of Middle-East and Africa | ||


Market Definition
- End-user Industry - Automotive, Industrial Machinery, Electrical & Electronics, and Others are the end-user industries considered under the polybutylene terephthalate market.
- Resin - Under the scope of the study, virgin polybutylene terephthalate resin in the primary forms such as powder, pellet, etc. are considered.
| Keyword | Definition |
|---|---|
| Acetal | This is a rigid material that has a slippery surface. It can easily withstand wear and tear in abusive work environments. This polymer is used for building applications such as gears, bearings, valve components, etc. |
| Acrylic | This synthetic resin is a derivative of acrylic acid. It forms a smooth surface and is mainly used for various indoor applications. The material can also be used for outdoor applications with a special formulation. |
| Cast film | A cast film is made by depositing a layer of plastic onto a surface then solidifying and removing the film from that surface. The plastic layer can be in molten form, in a solution, or in dispersion. |
| Colorants & Pigments | Colorants & Pigments are additives used to change the color of the plastic. They can be a powder or a resin/color premix. |
| Composite material | A composite material is a material that is produced from two or more constituent materials. These constituent materials have dissimilar chemical or physical properties and are merged to create a material with properties unlike the individual elements. |
| Degree of Polymerization (DP) | The number of monomeric units in a macromolecule, polymer, or oligomer molecule is referred to as the degree of polymerization or DP. Plastics with useful physical properties often have DPs in the thousands. |
| Dispersion | To create a suspension or solution of material in another substance, fine, agglomerated solid particles of one substance are dispersed in a liquid or another substance to form a dispersion. |
| Fiberglass | Fiberglass-reinforced plastic is a material made up of glass fibers embedded in a resin matrix. These materials have high tensile and impact strength. Handrails and platforms are two examples of lightweight structural applications that use standard fiberglass. |
| Fiber-reinforced polymer (FRP) | Fiber-reinforced polymer is a composite material made of a polymer matrix reinforced with fibers. The fibers are usually glass, carbon, aramid, or basalt. |
| Flake | This is a dry, peeled-off piece, usually with an uneven surface, and is the base of cellulosic plastics. |
| Fluoropolymers | This is a fluorocarbon-based polymer with multiple carbon-fluorine bonds. It is characterized by high resistance to solvents, acids, and bases. These materials are tough yet easy to machine. Some of the popular fluoropolymers are PTFE, ETFE, PVDF, PVF, etc. |
| Kevlar | Kevlar is the commonly referred name for aramid fiber, which was initially a Dupont brand for aramid fiber. Any group of lightweight, heat-resistant, solid, synthetic, aromatic polyamide materials that are fashioned into fibers, filaments, or sheets is called aramid fiber. They are classified into Para-aramid and Meta-aramid. |
| Laminate | A structure or surface composed of sequential layers of material bonded under pressure and heat to build up to the desired shape and width. |
| Nylon | They are synthetic fiber-forming polyamides formed into yarns and monofilaments. These fibers possess excellent tensile strength, durability, and elasticity. They have high melting points and can resist chemicals and various liquids. |
| PET preform | A preform is an intermediate product that is subsequently blown into a polyethylene terephthalate (PET) bottle or a container. |
| Plastic compounding | Compounding consists of preparing plastic formulations by mixing and/or blending polymers and additives in a molten state to achieve the desired characteristics. These blends are automatically dosed with fixed setpoints usually through feeders/hoppers. |
| Plastic pellets | Plastic pellets, also known as pre-production pellets or nurdles, are the building blocks for nearly every product made of plastic. |
| Polymerization | It is a chemical reaction of several monomer molecules to form polymer chains that form stable covalent bonds. |
| Styrene Copolymers | A copolymer is a polymer derived from more than one species of monomer, and a styrene copolymer is a chain of polymers consisting of styrene and acrylate. |
| Thermoplastics | Thermoplastics are defined as polymers that become soft material when it is heated and becomes hard when it is cooled. Thermoplastics have wide-ranging properties and can be remolded and recycled without affecting their physical properties. |
| Virgin Plastic | It is a basic form of plastic that has never been used, processed, or developed. It may be considered more valuable than recycled or already used materials. |


Research Methodology
Mordor Intelligence follows a four-step methodology in all our reports.
- Step-1: Identify Key Variables: The quantifiable key variables (industry and extraneous) pertaining to the specific product segment and country are selected from a group of relevant variables & factors based on desk research & literature review; along with primary expert inputs. These variables are further confirmed through regression modeling (wherever required).
- Step-2: Build a Market Model: In order to build a robust forecasting methodology, the variables and factors identified in Step-1 are tested against available historical market numbers. Through an iterative process, the variables required for market forecast are set and the model is built on the basis of these variables.
- Step-3: Validate and Finalize: In this important step, all market numbers, variables and analyst calls are validated through an extensive network of primary research experts from the market studied. The respondents are selected across levels and functions to generate a holistic picture of the market studied.
- Step-4: Research Outputs: Syndicated Reports, Custom Consulting Assignments, Databases & Subscription Platforms


