Polyacrylamide Market Size and Share
Market Overview
| Study Period | 2021 - 2031 |
|---|---|
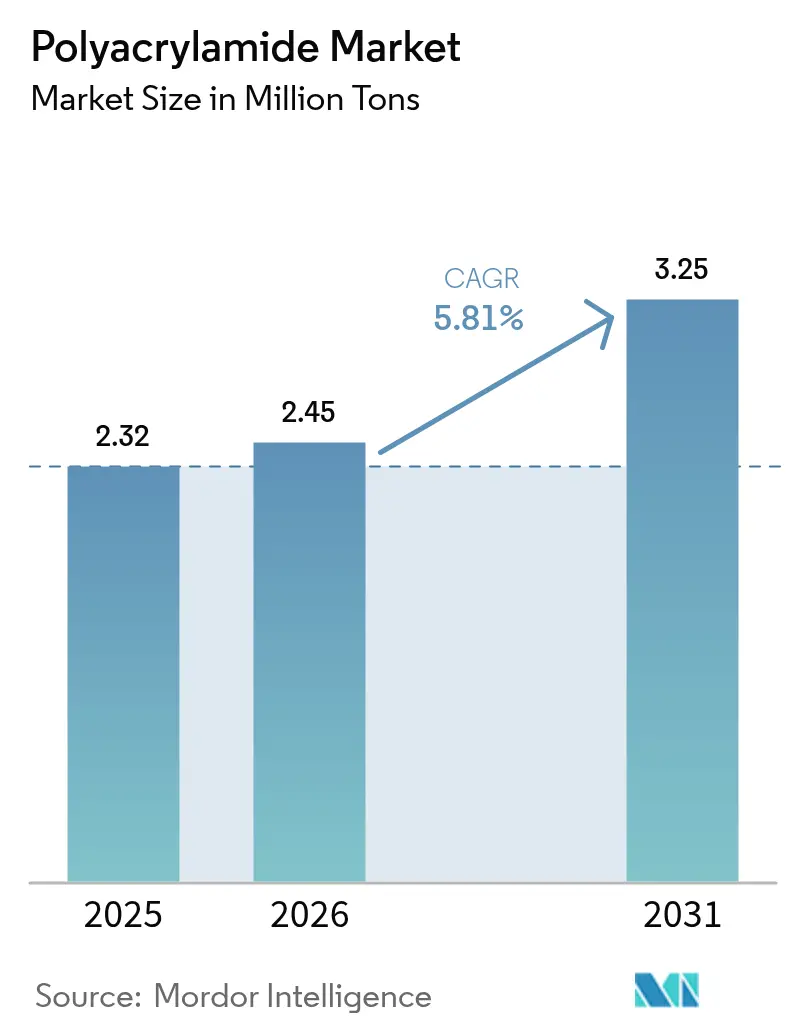
| Market Volume (2026) | 2.45 Million tons |
| Market Volume (2031) | 3.25 Million tons |
| Growth Rate (2026 - 2031) | 5.81% CAGR |
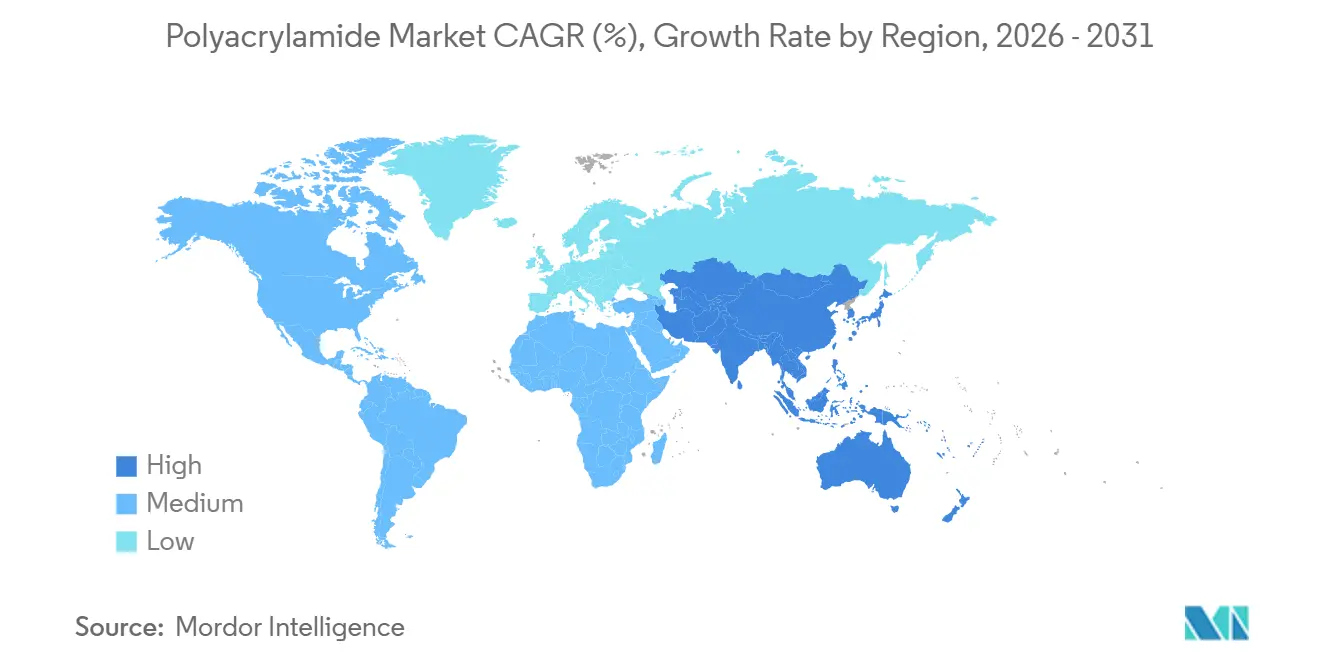
| Fastest Growing Market | Asia Pacific |
| Largest Market | Asia Pacific |
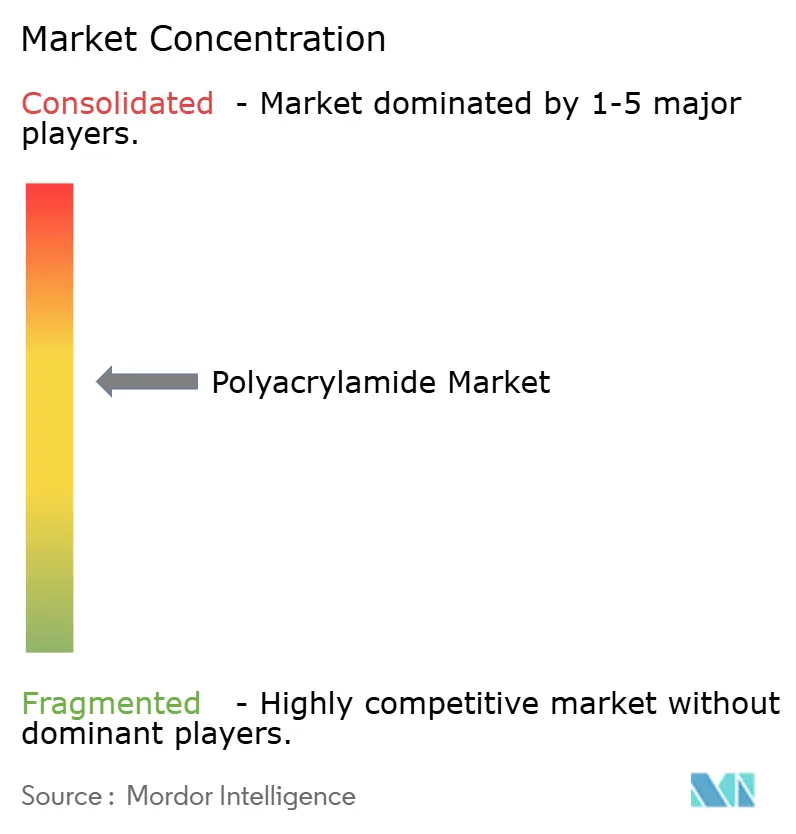
| Market Concentration | Medium |
Major Players *Disclaimer: Major Players sorted in no particular order Image © Mordor Intelligence. Reuse requires attribution under CC BY 4.0. | |
Polyacrylamide Market Analysis by Mordor Intelligence
The Polyacrylamide Market size is expected to increase from 2.32 million tons in 2025 to 2.45 million tons in 2026 and reach 3.25 million tons by 2031, growing at a CAGR of 5.81% over 2026-2031. Demand is migrating from commodity flocculants toward higher-value specialties as enhanced oil recovery (EOR) accelerates, semiconductor wastewater tightens purity limits, and battery-metal tailings require ultra-high-molecular-weight grades. Regulatory drivers, EPA residual-monomer caps, the EU Urban Wastewater Treatment Directive 2024/3019, and Asia-Pacific sludge-handling mandates are raising quality thresholds and favoring certified producers. Asia-Pacific remains the volume anchor, yet North American shale and European nutrient-removal projects are reshaping the application mix in their regions. Intensifying innovation around salt-tolerant polymers, grafted bio-derivatives, and closed-loop dosing systems signals that intellectual property, not scale alone, will differentiate future winners.
Key Report Takeaways
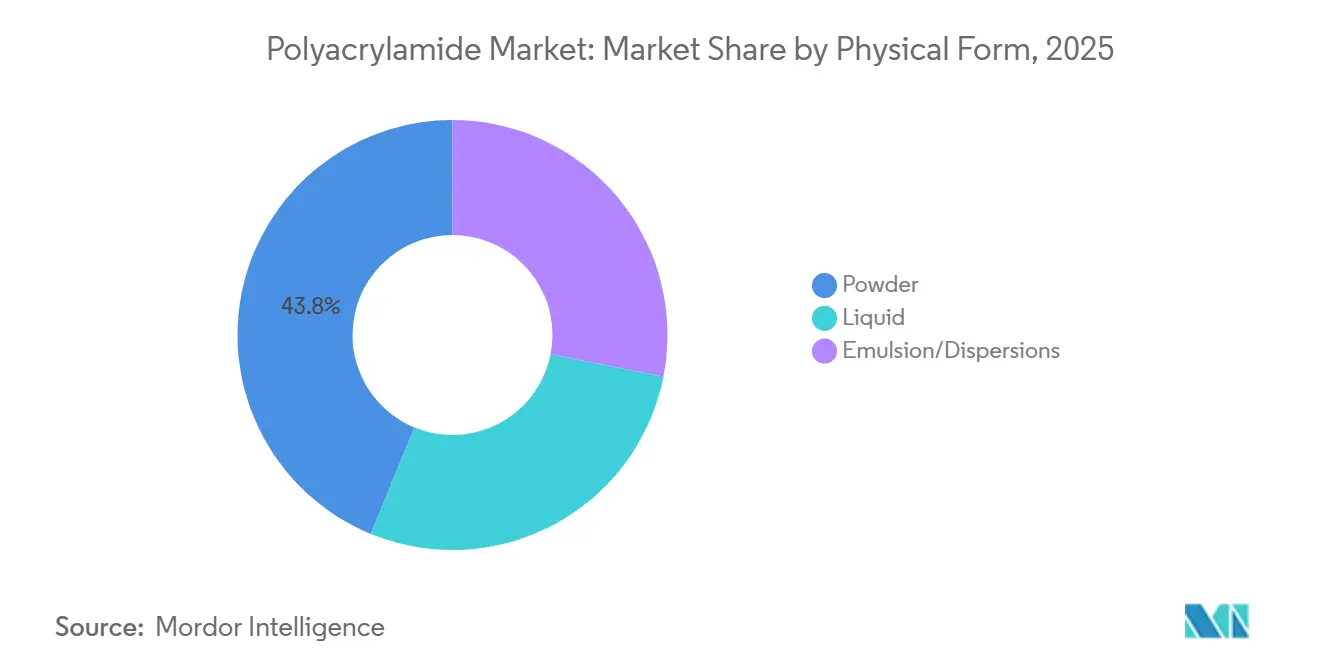
- By physical form, powder captured 43.80% of the polyacrylamide market share in 2025, whereas emulsions/dispersions are forecast to expand at a 6.12% CAGR through 2031.
- By application, flocculants for water treatment held 41.52% revenue share in 2025; enhanced oil recovery is projected to grow at a 6.24% CAGR to 2031.
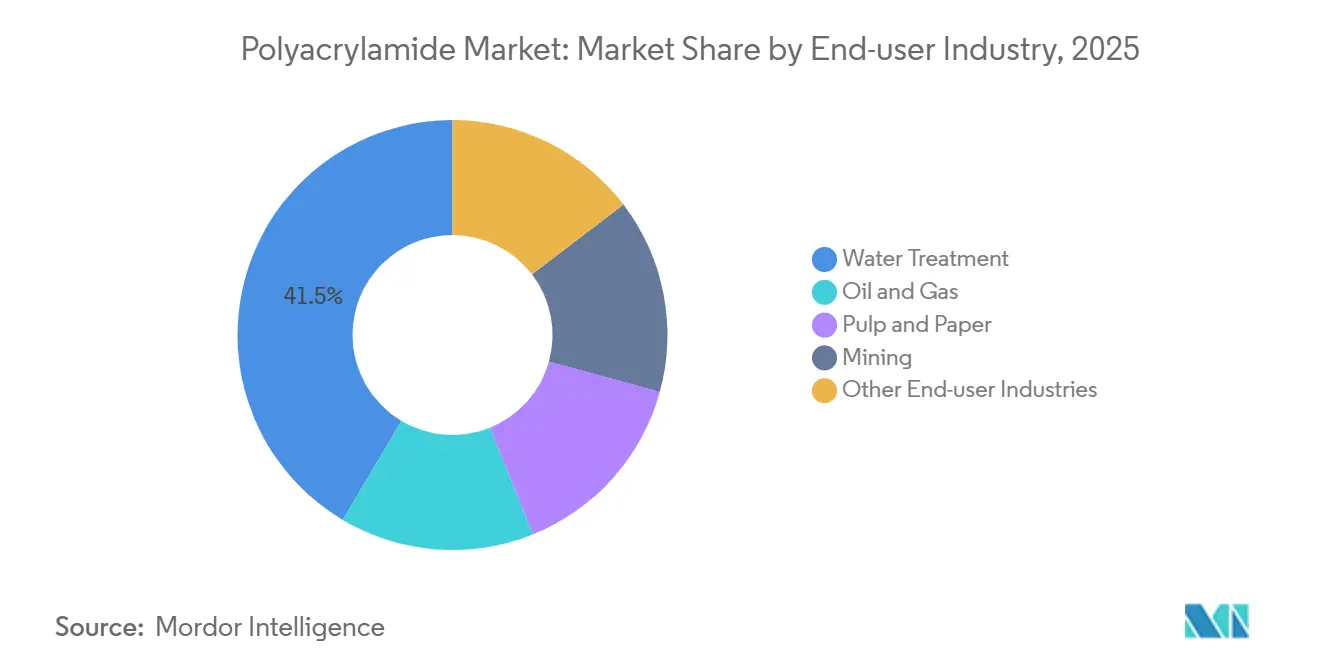
- By end-user industry, water treatment accounted for 41.48% of the polyacrylamide market size in 2025, while oil and gas is advancing at a 6.20% CAGR to 2031.
- By geography, Asia-Pacific led with 49.95% share of the polyacrylamide market in 2025 and is enlarging at a 6.25% CAGR through 2031.
Note: Market size and forecast figures in this report are generated using Mordor Intelligence’s proprietary estimation framework, updated with the latest available data and insights as of 2026.
Global Polyacrylamide Market Trends and Insights
Driver Impact Analysis*
| Driver | (~) % Impact on CAGR Forecast | Geographic Relevance | Impact Timeline |
|---|---|---|---|
| Growing utilization in enhanced oil recovery (EOR) | +1.2% | Middle East, North America (Permian, Bakken), Latin America (heavy oil) | Medium term (2-4 years) |
| Rising demand for flocculants in municipal & industrial wastewater treatment | +1.5% | Europe, Asia-Pacific (China, India, ASEAN), North America | Long term (≥ 4 years) |
| Expansion of mining activities driving demand for sedimentation aids | +1.3% | Asia-Pacific (Indonesia, Philippines), Latin America (Chile, Peru, Brazil), Australia | Medium term (2-4 years) |
| Shift toward ultra-high-molecular-weight friction reducers for shale completions | +0.9% | North America (US Permian, Eagle Ford, Bakken; Canada Montney) | Short term (≤ 2 years) |
| Surge in demand for biodegradable PAM grades in precision agriculture | +0.7% | Europe, North America (US Midwest, California), Asia-Pacific (China, India) | Long term (≥ 4 years) |
| Source: Mordor Intelligence | |||


Growing Utilization in Enhanced Oil Recovery
Polymer flooding now targets deeper, hotter, and saltier reservoirs, prompting a pivot from standard hydrolyzed polyacrylamide to ATBS-copolymer blends stable above 120°C and at 200,000 ppm salinity. National oil companies favor EOR because it lifts recovery factors by 5%-15% without frontier exploration. Selective gel-placement technologies that pair polyacrylamide with chromium or organic cross-linkers further reduce water cut, extend well life, and defer abandonment costs. These dual pathways are expected to raise polymer demand per barrel recovered and reinforce the value of ultra-high-molecular-weight grades. Consequently, EOR’s share of the polyacrylamide market is climbing faster than any other application, reshaping supplier portfolios toward higher-margin specialty products.
Rising Demand for Flocculants in Municipal & Industrial Wastewater Treatment
The EU Urban Wastewater Treatment Directive lowered the tertiary-treatment threshold from 10,000 to 1,000 population equivalents, compelling widespread clarifier and centrifuge upgrades[1]European Commission, “Directive 2024/3019,” eur-lex.europa.eu. Municipal biosolids typically rely on cationic polyacrylamide at 40%-60% charge density, while Asian textile effluents need 80% charge to capture anionic dyes. India’s Central Pollution Control Board requires sludge for cement-kiln co-processing to reach below 20% moisture by 2026, pushing polymer doses above 5 kg per dry tonne. China’s drive to incinerate or pyrolyze municipal sludge also hinges on achieving 40% solids, a benchmark attainable only with high-dose polyacrylamide treatment. Global procurement agencies are shifting to performance-based contracts, pressuring suppliers to deliver polymers that hit dewatering targets without overdosing penalties.
Expansion of Mining Activities Driving Demand for Sedimentation Aids
Battery-metal projects lifted global mining capex and intensified tailings-management scrutiny. Anionic polyacrylamide remains essential for thickening slurries containing fine clays and silicates that delay water recycling. Laterite nickel and high-altitude copper operations in Indonesia, the Philippines, and Chile use polymer doses 50% higher than traditional sulfide ores because of colloidal silica and iron hydroxide interference. Water-scarce jurisdictions grant permits contingent on water-recovery efficiency, so operators increasingly specify ultra-high-molecular-weight grades that deliver faster settling and clearer overflow. This demand surge, paired with stricter residue limits, is tilting the polyacrylamide market toward certified, high-purity, mining-grade offerings.
Shift Toward Ultra-High-Molecular-Weight Friction Reducers for Shale Completions
US shale basins consumed about 75,000 tons of polyacrylamide in 2025, with per-well polymer loading intensifying as lateral lengths rise. Slickwater formulas cut pumping pressure by up to 50%, saving 20%-35% on completion costs compared with guar gels. Produced-water reuse raises salinity beyond 100,000 ppm, degrading anionic polymers; cationic friction reducers, though pricier, preserve viscosity and mitigate formation damage in such brines. Thermal stability up to 240°C enables reliable performance in Haynesville and Eagle Ford wells. Residual polymer recovery is becoming routine, with aluminum-sulfate coagulation removing up to 90% of flowback PAM prior to recycling.
Restraint Impact Analysis*
| Restraint | (~) % Impact on CAGR Forecast | Geographic Relevance | Impact Timeline |
|---|---|---|---|
| Health & carcinogenicity concerns over residual acrylamide monomer | -0.8% | Global, with stricter enforcement in North America, Europe, Australia | Medium term (2-4 years) |
| Rising preference for bio-based flocculants in Europe | -0.5% | Europe (Germany, France, Nordic countries), North America (green procurement mandates) | Long term (≥ 4 years) |
| Growing regulatory pressure on polymer micro-particle discharge into surface waters | -0.4% | Europe, Asia-Pacific (Japan, South Korea, Singapore) | Long term (≥ 4 years) |
| Source: Mordor Intelligence | |||
Health & Carcinogenicity Concerns Over Residual Acrylamide Monomer
WHO lists acrylamide as a probable human carcinogen, while ATSDR highlights neurotoxicity at chronic exposures above 0.5 mg/kg day[2]World Health Organization, “IARC Monographs on the Identification of Carcinogenic Hazards to Humans,” who.int. The US EPA caps residual monomer at 0.05% in polymers used for drinking-water treatment and limits the dose to 1 mg/l. Meeting these limits requires vacuum-distillation or reactive-precipitation stripping units that add USD 200-400/t to production costs. Premium grades certified under NSF/ANSI 60 now command price premiums of 10%-20%, fragmenting the polyacrylamide market between certified and non-certified tiers. Non-compliant shipments have already faced rejections in Australia and New Zealand, prompting importers to demand supplier certification.
Rising Preference for Bio-Based Flocculants in Europe
Peer-reviewed studies show chitosan, starch, and cellulose flocculants achieve up to 75% of synthetic PAM efficiency, although they require 1.5-2× the dose. Germany, France, and Nordic countries have adopted green-procurement rules that favor biopolymers despite higher prices of USD 3,000-5,000/t versus USD 1,500-2,500 for synthetic grades. Kemira’s EUR 130 million joint venture with IFF, targeting a 2027 start-up, illustrates incumbent hedging against future displacement. Cost remains the primary adoption barrier, yet EU carbon-pricing and pending microplastic discharge rules are narrowing the gap. Suppliers able to balance performance and biodegradability will gain traction as mandates tighten.
*Our forecasts treat driver/restraint impacts as directional, not additive. The impact forecasts reflect baseline growth, mix effects, and variable interactions.
Segment Analysis
By Physical Form: Emulsions Gain on Handling Efficiency
Powder grades accounted for 43.80% of the polyacrylamide market share in 2025, serving price-sensitive municipal and mining customers that have existing dissolution tanks. Emulsion formats, typically 30%-40% active solids, dissolve in under five minutes and eliminate dust exposure, a decisive benefit after OSHA cut the permissible acrylamide dust limit to 0.03 mg m-3 in 2024. The segment is forecast to grow at 6.12% annually through 2031, raising its slice of the polyacrylamide market size as automation and real-time dosing spread across mining and offshore platforms.
Emulsions command 10%-20% price premiums over powders but cut labor, dissolution energy, and overdosing losses, often lowering the total cost of ownership. SNF’s 2024 expansion in Lara, Australia, added 5,000 t y-1 of emulsion capacity to meet mining demand, reflecting supplier bets on this shift. Liquid grades at 10%-15% solids address cosmetics and small wastewater plants that prioritize storage simplicity. Legacy powder users in Asia-Pacific and Latin America still favor USD <2,000/t pricing, yet as safety and productivity metrics grow stricter, powder’s dominance will erode in favor of safer, faster-diluting formats.


By Application: EOR Outpaces Water Treatment on Technical Intensity
Flocculants for water treatment represented 41.52% of volume in 2025, but EOR is the fastest-growing application, advancing at a 6.24% CAGR to 2031. Polymer flooding employs 500-2,000 ppm solutions of ultra-high-molecular-weight polyacrylamide to improve sweep efficiency, unlocking 5%-15% extra oil in mature reservoirs. This technical intensity raises per-unit value and is lifting EOR’s contribution to the polyacrylamide market size more than any other use.
Municipal dewatering and industrial clarifiers will still absorb the single-largest share because utility budgets and sludge-handling mandates guarantee baseline consumption. However, plateauing infrastructure replacement in mature economies is slowing volume growth. Mining and mineral processing, at 15%-18% of demand, continue rising as tailings reprocessing and water-scarcity compliance become standard in battery-metal projects. Soil-conditioner and cosmetic uses deliver niche but high-margin revenue that depends on specialty grades with tight impurity specifications.
By End-User Industry: Oil and Gas Gains on Shale Resilience
Municipal and industrial utilities accounted for 41.48% of end-user demand in 2025, yet oil and gas are projected to grow at a 6.20% CAGR between 2026 and 2031. Shale completions deploy friction reducers at 5.6-4,484 ppm, cutting pumping power and allowing produced-water reuse in high-salinity environments. The practice converts polyacrylamide from a cost item into a completion-efficiency lever, underpinning sustained volumes even in volatile rig cycles.
Mining ranks next as lithium, nickel, and copper producers scale ultra-high-molecular-weight polymers for thickener performance in water-stressed zones. Pulp and paper demand is migrating toward Asia-Pacific with new containerboard machines, while North American graphic-paper closures compress regional offtake. Textile effluent control in India and Southeast Asia is a bright spot, as high-charge cationic polymers replace commodity grades to hit stricter sludge-moisture and color-removal limits.
Geography Analysis
Asia-Pacific held 49.95% of the polyacrylamide market share in 2025 and will grow at 6.25% through 2031, buoyed by semiconductor expansion, 16 million t of new containerboard capacity, and battery supply-chain investments in Indonesia, Malaysia, and Thailand. China produced 55 million wet tons of municipal sludge in 2025, driving dewatering polymer demand, while India’s Swachh Bharat 2.0 targets full sludge processing by 2026, spurring cationic doses above 5 kg/t. Japan, South Korea, and Singapore are drafting polymer-particle discharge limits that could reshape product certification requirements region-wide.
North America shows divergent patterns: hydraulic fracturing consumed 75,000 t of polyacrylamide in 2025, and suppliers such as SNF ramped up integrated monomer-polymer capacity in Louisiana to serve shale and municipal clients. Pulp-paper polymer volumes slid as graphic mills closed or shifted to packaging, but industrial wastewater upgrades and microplastic regulations in California and Canada partially offset the decline. Certified low-monomer grades command premiums, segmenting the market along NSF accreditation lines.
Europe’s growth is tied to Directive 2024/3019, which forces tertiary treatment and microplastic monitoring by 2029. Cationic polyacrylamide demand is climbing for sludge dewatering, yet parallel biodegradability mandates are steering procurement toward hybrid and bio-based alternatives. Kemira and Solenis are investing in renewable-polymer capacity to retain share, while regional incentives favor suppliers with demonstrable life-cycle advantages.
Mordor Intelligence provides coverage of the polyacrylamide market across other key regional markets, including Europe, each with their regulatory frameworks and demand patterns.

Competitive Landscape
The Polyacrylamide market is moderately concentrated. Solenis vaulted into mining leadership by acquiring BASF’s Magnafloc, Rheomax, and Alclar brands in 2024, strengthening its presence in tailings management and copper flotation. SNF expanded emulsion capacity in Australia and integrated monomer capacity in the United States, prioritizing vertical integration and logistics proximity. Disruptors are emerging from bio-based niches: starch- and chitosan-derived flocculants achieve up to 75% of synthetic efficiency and already hold 15%-20% of Northern European municipal contracts.
Polyacrylamide Industry Leaders
Kemira
Solenis
BASF
SNF
Ashland
- *Disclaimer: Major Players sorted in no particular order

Recent Industry Developments
- October 2025: Texas New Materials Inc., a specialty polymer manufacturer, revealed its intention to build a polyacrylamide production facility in Big Spring, Texas, United States, with a capacity of 200,000 metric tons per year. The facility is set to be operational by late 2026.
- December 2024: Universal Fine Chemicals SPC committed USD 300 million to build a 240,000 m² polyacrylamide complex at SOHAR Port, Oman, targeting start-up in early 2026.


Global Polyacrylamide Market Report Scope
Polyacrylamide is a water-soluble synthetic linear polymer made of acrylamide or a combination of acrylic acid and acrylamide.
The polyacrylamides market is segmented by physical form (powder, liquid, and emulsion/dispersions), application (enhanced oil recovery, flocculants for water treatment, soil conditioner, binders and stabilizers in cosmetics, other applications) (food processing, etc.)), end-user industry (water treatment, oil and gas, pulp and paper, mining, other end-user industries (food, agriculture, cosmetics, etc.)) and geography (Asia-Pacific, North America, Europe, South America, and Middle East and Africa). The report offers market size and forecasts for the Polyacrylamide market in volume (tons) for all the above segments.
| Powder |
| Liquid |
| Emulsion/Dispersion |
| Flocculants for Water Treatment |
| Enhanced Oil Recovery |
| Soil Conditioner |
| Binders and Stabilizers in Cosmetics |
| Other Applications (Mining & Mineral Processing etc.) |
| Water Treatment |
| Oil and Gas |
| Mining |
| Pulp & Paper |
| Other End-user Industries (Chemicals & Petrochemicals, etc.) |
| Asia-Pacific | China |
| India | |
| Japan | |
| South Korea | |
| Malaysia | |
| Thailand | |
| Indonesia | |
| Vietnam | |
| Rest of Asia-Pacific | |
| North America | United States |
| Canada | |
| Mexico | |
| Europe | Germany |
| United Kingdom | |
| France | |
| Italy | |
| Spain | |
| Nordic Countries | |
| Turkey | |
| Russia | |
| Rest of Europe | |
| South America | Brazil |
| Argentina | |
| Colombia | |
| Rest of South America | |
| Middle East & Africa | Saudi Arabia |
| Qatar | |
| United Arab Emirates | |
| Nigeria | |
| Egypt | |
| South Africa | |
| Rest of Middle-East and Africa |
| By Physical Form | Powder | |
| Liquid | ||
| Emulsion/Dispersion | ||
| By Application | Flocculants for Water Treatment | |
| Enhanced Oil Recovery | ||
| Soil Conditioner | ||
| Binders and Stabilizers in Cosmetics | ||
| Other Applications (Mining & Mineral Processing etc.) | ||
| By End-User Industry | Water Treatment | |
| Oil and Gas | ||
| Mining | ||
| Pulp & Paper | ||
| Other End-user Industries (Chemicals & Petrochemicals, etc.) | ||
| By Geography | Asia-Pacific | China |
| India | ||
| Japan | ||
| South Korea | ||
| Malaysia | ||
| Thailand | ||
| Indonesia | ||
| Vietnam | ||
| Rest of Asia-Pacific | ||
| North America | United States | |
| Canada | ||
| Mexico | ||
| Europe | Germany | |
| United Kingdom | ||
| France | ||
| Italy | ||
| Spain | ||
| Nordic Countries | ||
| Turkey | ||
| Russia | ||
| Rest of Europe | ||
| South America | Brazil | |
| Argentina | ||
| Colombia | ||
| Rest of South America | ||
| Middle East & Africa | Saudi Arabia | |
| Qatar | ||
| United Arab Emirates | ||
| Nigeria | ||
| Egypt | ||
| South Africa | ||
| Rest of Middle-East and Africa | ||


Key Questions Answered in the Report
What is the projected volume of the polyacrylamide market by 2031?
It is expected to reach 3.25 million tons by 2031, reflecting a CAGR of 5.81% from 2026.
Which application is growing fastest within polyacrylamide demand?
Enhanced oil recovery is advancing at a 6.24% CAGR through 2031 due to polymer flooding in mature reservoirs
Why are emulsion formats gaining share over powder grades?
Emulsions dissolve in minutes, cut dust exposure, and integrate with automated dosing, driving a 6.12% CAGR to 2031.
How is regulation impacting polyacrylamide suppliers in Europe?
The Urban Wastewater Treatment Directive and pending biodegradability rules are boosting demand for low-residual and bio-based grades.
Which region leads global consumption?
Asia-Pacific held 49.95% of 2025 volume and is expected to grow at 6.25% to 2031 on the back of electronics, paper, and battery-metal projects.
Page last updated on:


