
Market Overview
| Study Period | 2021 - 2031 |
|---|---|
| Forecast Data Period | 2026 - 2031 |
| Base Year Market Size (2025) | 24.75 gigawatt |
| Market Volume (2026) | 26.42 gigawatt |
| Market Volume (2031) | 36.61 gigawatt |
| Growth Rate (2026 - 2031) | 6.74 % |
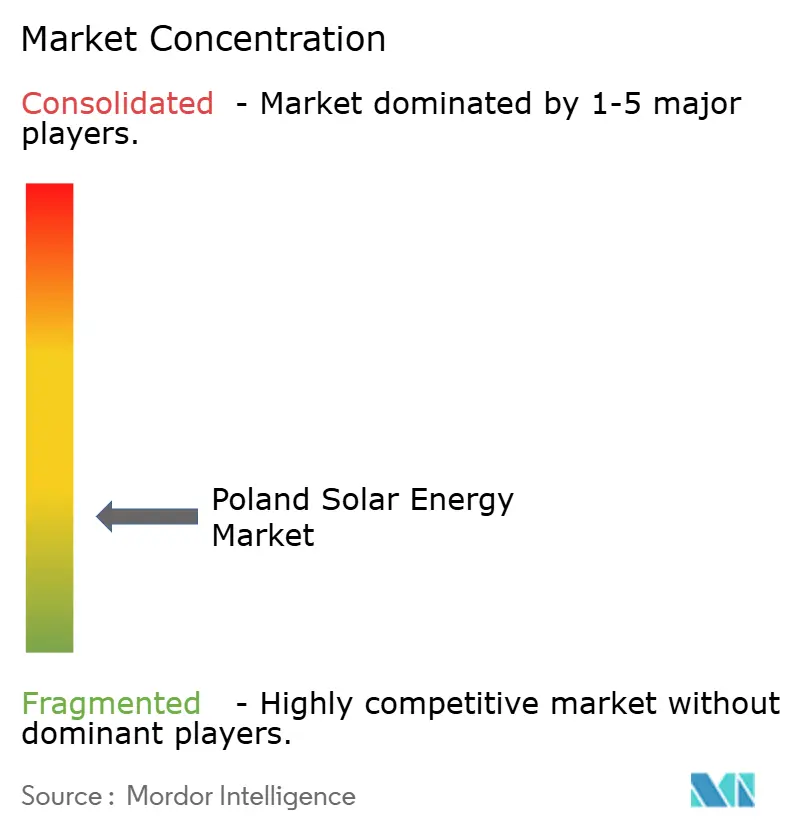
| Market Concentration | Low |
Major Players *Disclaimer: Major Players sorted in no particular order Image © Mordor Intelligence. Reuse requires attribution under CC BY 4.0. | |
Poland Solar Energy Market Analysis by Mordor Intelligence
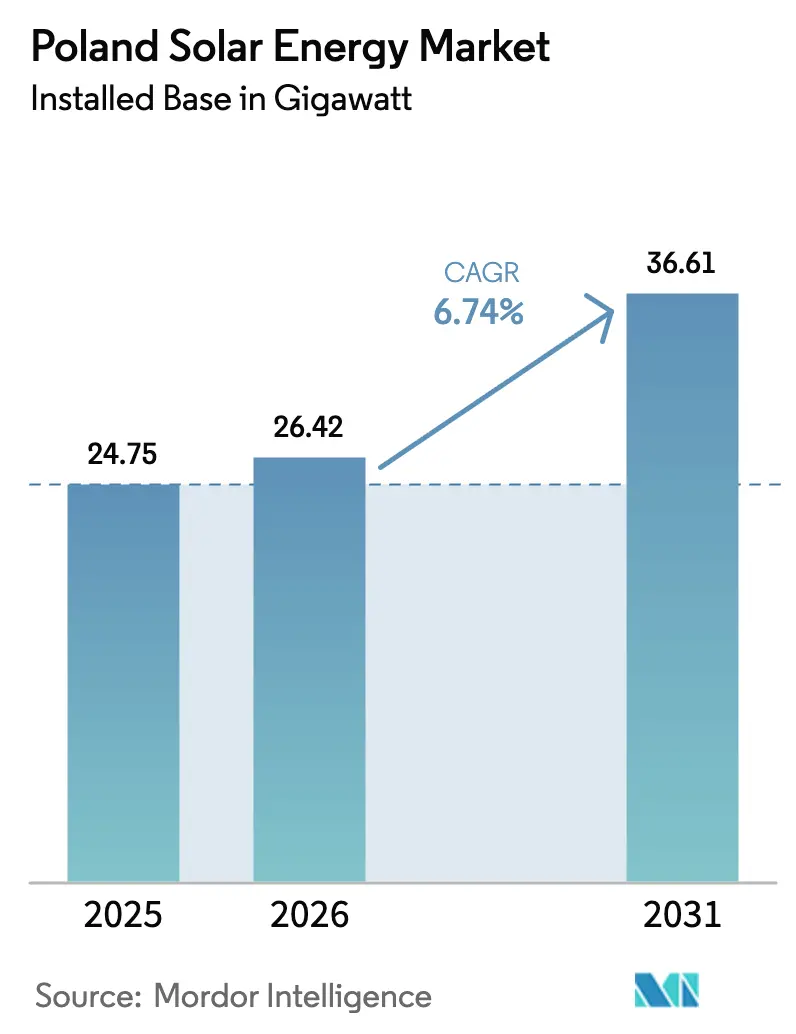
The Poland Solar Energy Market size is expected to grow from 24.75 gigawatt in 2025 to 26.42 gigawatt in 2026 and is forecast to reach 36.61 gigawatt by 2031 at 6.74% CAGR over 2026-2031.
This measured trajectory reflects the nation’s strategic transition away from coal, balanced by grid-upgrade timelines and evolving connection rules. Momentum remains firm as renewables supplied 29% of Poland’s power mix in 2024, with photovoltaic additions of 4 GW underscoring investor confidence. Utility auctions, corporate power-purchase agreements (PPAs), and rooftop incentives continue to attract capital, while domestic manufacturing of bifacial modules improves supply security and cost control. Grid-connection reforms, although slowing speculative applications, are expected to enhance build-out quality and system stability.
Key Report Takeaways
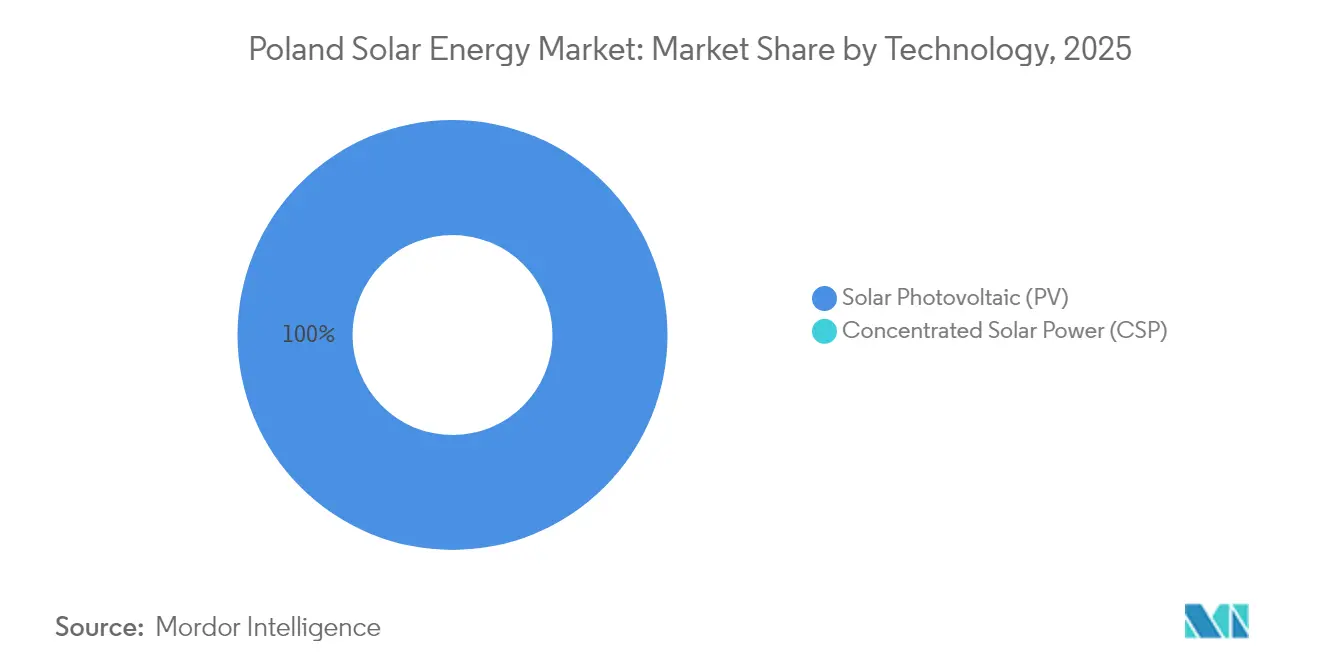
- By technology, photovoltaic systems held 100.00% of the installed capacity in 2025, and the segment is expected to post a 6.78% CAGR through 2031.
- By grid type, on-grid plants captured 93.65% of the Poland solar energy market share in 2025, while off-grid systems are projected to lag at a 3.98% CAGR.
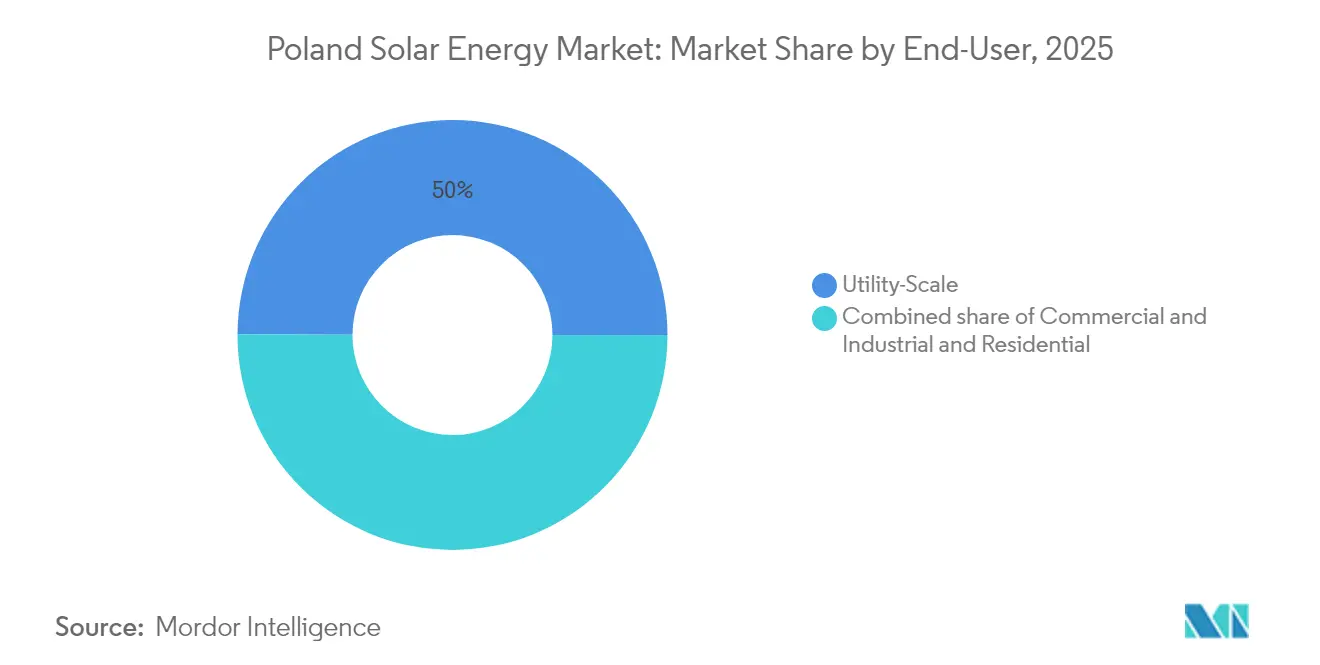
- By end-user, utility-scale farms accounted for 49.95% of the market in 2025; commercial and industrial installations are forecast to expand at a 13.92% CAGR through 2031.
Note: Market size and forecast figures in this report are generated using Mordor Intelligence’s proprietary estimation framework, updated with the latest available data and insights as of 2026.
Market Trends and Insights
Drivers Impact Analysis of Poland Solar Energy Market*
| Driver | (~) % Impact on CAGR Forecast | Geographic Relevance | Impact Timeline |
|---|---|---|---|
| EU renewable-energy targets & NECP mandates | +1.8% | National, with accelerated deployment in Mazowieckie, Wielkopolskie, and Małopolska voivodeships | Long term (≥ 4 years) |
| Declining LCOE of solar PV | +1.5% | National, with strongest impact in southern high-irradiance zones | Medium term (2-4 years) |
| Government auctions & rooftop incentives | +1.2% | National, with prosumer programs concentrated in Tauron and PGE distribution areas | Short term (≤ 2 years) |
| Coal-mine land fast-track grid access | +0.9% | Regional, focused on Silesia, Lower Silesia, and Greater Poland coal basins | Medium term (2-4 years) |
| Corporate PPAs from energy-intensive firms | +0.7% | National, with early adoption in manufacturing corridors and data center hubs | Short term (≤ 2 years) |
| Domestic bifacial module manufacturing | +0.4% | National, contingent on EUR 1.2B manufacturing scheme execution | Long term (≥ 4 years) |
| Source: Mordor Intelligence | |||
EU Renewable-Energy Targets & NECP Mandates
Binding European Union legislation compels Poland to lift renewables to 50% of national electricity output by 2030, anchoring long-range demand for photovoltaic capacity. The Renewable Energy Directive obliges annual gains across power, heat, and transport, while the updated National Energy and Climate Plan sets interim milestones that utilities must hit or risk funding cuts. An EU financing package of EUR 3.8 billion blends grants with private capital, easing the cost of grid upgrades, storage, and brownfield conversions. Legal clarity around sectoral quotas, therefore, keeps the Poland solar energy market on a steady growth path despite macro headwinds. Compliance monitoring by the European Commission provides additional certainty for lenders and developers.[1]
Declining LCOE of Solar PV
The levelized cost of electricity for utility-scale PV in Poland is expected to slide from USD 35/MWh in 2025 to USD 25/MWh by 2035, according to research that places crystalline-silicon modules firmly below the running cost of coal. Fraunhofer ISE reports that ground-mounted plants already reach 4.1 – 9.2 cents /kWh, a range that allows subsidy-free offtake agreements to flourish.[2] Falling module prices, rising efficiencies, and expanding domestic supply lines underpin this trend. Corporates are seizing the economics: BayWa r.e. has secured multidecade PPAs for Polish solar parks without recourse to auction tariffs, signalling a sustainable merchant market.[3]
Government Auctions & Rooftop Incentives
Since 2016, competitive auctions have contracted more than 1.6 GW of PV, offering long-term index-linked revenue and crowding in bank finance. In parallel, the relaunched Mój Prąd scheme allocates PLN 400 million for residential panels and batteries, targeting owners of Poland’s 1.54 million micro-installations.[4] The blend of commercial-scale auctions and consumer rebates diversifies the Poland solar energy market’s demand base and cushions it against policy swings.
Corporate PPAs from Energy-Intensive Firms
Steelmakers, chemical processors, telecom operators, and data center owners are using 10- to 15-year PPAs to hedge against price volatility and meet Scope 2 decarbonization goals under the Corporate Sustainability Reporting Directive. Notably, R.Power and Play agreed on a 240 GWh annual offtake in late 2024, while Statkraft and Better Energy expanded an arrangement covering 150 GWh per year across four solar farms. These transactions lower developers’ weighted average cost of capital by 100–150 basis points, opening a financing pathway that is independent of feed-in tariffs.
Restraints Impact Analysis of Poland Solar Energy Market*
| Restraint | (~) % Impact on CAGR Forecast | Geographic Relevance | Impact Timeline |
|---|---|---|---|
| Grid congestion in high-irradiance zones | −1.1% | Southern Małopolska, Silesia, Podkarpackie | Medium term (2-4 years) |
| Volatile local-zoning permitting timelines | −0.6% | Municipalities lacking spatial development plans | Short term (≤ 2 years) |
| Net-metering compensation reduction | −0.5% | Nationwide, pronounced in Tauron and PGE networks | Short term (≤ 2 years) |
| Rising land-lease costs near coal sites | −0.3% | Silesia and Lower Silesia | Medium term (2-4 years) |
| Source: Mordor Intelligence | |||
Grid Congestion in High-Irradiance Zones
Rapid connection of projects in the country’s sunniest belts is straining 110 kV and 220 kV lines, forcing the system operator to curb production during midday peaks. Curtailment lowers asset revenues and can deter investment until USD 16 billion of planned 400 kV upgrades are delivered by 2034. Storage roll-outs and demand-response schemes partially mitigate the short-term bottleneck, yet developers still queue for capacity allocations that align with transformer and circuit-breaker upgrades.
Volatile Local-Zoning Permitting Timelines
Municipalities wield discretion over land-use studies and environmental clearances, resulting in unpredictable lead times that complicate project finance. Draft Energy Law amendments add higher upfront fees meant to weed out speculative grid requests, but they also raise capital at risk for genuine sponsors. Standardized zoning templates and digital portals are under discussion yet remain unevenly adopted, making local government engagement a critical competency for players in the Polish solar energy market.
*Our forecasts treat driver/restraint impacts as directional, not additive. The impact forecasts reflect baseline growth, mix effects, and variable interactions.
Poland Solar Energy Market Segment Analysis
By Technology:
Photovoltaic Dominance Reflects Northern-Latitude EconomicsPhotovoltaic systems captured 100.00% of installed generation in 2025, and the segment is projected to rise at a 6.78% CAGR, reinforcing its monopoly within the Polish solar energy market. Bifacial modules are gaining popularity rapidly as developers aim to achieve up to 15% additional yield from rear-side reflection, as demonstrated by Enefit Green’s 74 MW Sopi farm, slated for commissioning in 2025. Concentrated solar power remains absent because Poland’s moderate irradiance profile translates into lower direct-normal-irradiance values insufficient to justify CSP’s higher capital outlay. The Poland solar energy market size linked to utility-scale PV is forecast to expand from 12.36 GW in 2025 to 17.95 GW by 2031, underscoring the country’s PV-centric trajectory.
Domestic manufacturing incentives are accelerating vertical integration: a EUR 1.2 billion package is backing the development of new bifacial lines that could supply up to 10 GW annually by 2028. Inverter vendors are testing 29 models for compliance with reactive-power and ride-through requirements, and variants that fail certification face market exclusion. Fixed-tilt racking still dominates because Poland’s modest solar angles temper the benefit of single-axis trackers. The integration of 2.3 GWh of new battery capacity, announced by R.Power and others, signals that hybrid architectures will be pivotal for tapping capacity market premiums. As storage scales, the Poland solar energy market share commanded by standalone PV will decrease, but total PV output will grow, reinforcing its lead in national generation.

By Grid Type:
On-Grid Capacity Captures Payment PremiumsOn-grid plants held 93.65% of installed capacity in 2025 and are expected to post an 8.32% CAGR to 2031, reflecting investors’ preference for capacity-market contracts and wholesale-market access. Off-grid assets hold a modest 6.35% share and are expected to grow at only 3.98% annually, as rural electrification is already near saturation.
Under State-aid ruling SA.46100, grid-tied PV and storage assets can lock in 15-year capacity payments that underpin debt service even when wholesale prices sag. Photon Energy’s 139 MW of awarded contracts for 2026 delivery demonstrate how hybrid systems capitalize on dispatchability premiums. Conversely, off-grid uptake stays confined to farms and emergency sites where grid extension costs exceed EUR 50,000 per kilometer. Unless Poland introduces peer-to-peer tariffs or wider energy community schemes, the Polish solar energy industry will continue to focus on utility-scale, grid-connected projects.
By End-User:
Commercial & Industrial Offtakers Drive GrowthUtility-scale projects accounted for 49.95% of installed capacity in 2025, driven by economies of scale and auction-driven strike prices. Yet commercial and industrial facilities are forecast to accelerate at a 13.92% CAGR through 2031, shifting the Poland solar energy market structure toward private offtake.
R.Power’s 240 GWh annual PPA with Play and Statkraft’s 150 GWh arrangement with Better Energy typify the appetite for fixed-price electricity among data center and manufacturing operators seeking to cap costs and meet ESG metrics. Residential prosumers totaled 12.7 GW by the end of 2024, but new installations dropped 30% after net-metering terms were tightened. Fast-track permitting on reclaimed coal sites is directing utility developers toward Silesia and Lower Silesia, where grid hookups are more affordable, while rooftop PV paired with storage is carving out a niche for resilience in logistics hubs. Collectively, these shifts ensure that the Poland solar energy market size attached to C&I users will widen faster than any other customer class over the outlook period.
Geography Analysis
Installations cluster in Mazovia, Greater Poland, and Silesia, where irradiation, demand centres, and legacy high-voltage lines intersect. Southern and central provinces together host more than half of the operational capacity, though they also experience the sharpest curtailments during spring and summer peaks. The Poland solar energy market size in these heartlands benefits from brownfield coal-site conversions that supply shovel-ready acreage with robust export lines.
Northern coastal regions, historically focused on offshore wind, are now luring hybrid solar projects that share grid upgrades tied to marine farms. Cross-border links with Germany and the Czech Republic enable surplus PV output to flow westward when prices warrant, reinforcing merchant-price signals for new builds. East-central voivodeships are seeing a rooftop boom as agricultural processors and light-industry clusters hedge retail-power inflation with self-generation.
Warsaw’s metropolitan area exemplifies distributed growth, pairing smart-billing schemes with high consumption density. Regional disparities in planning approvals persist, yet the national grid-investment roadmap prioritizes transformers and looped circuits in zones where auction pipelines are thickest. Over the forecast window, balanced geographic build-out is expected to temper locational price volatility and curtailment risk.
Regulatory Landscape
Poland’s solar regulatory environment is being reshaped by the so-called Grid Act (UC84), passed by Parliament in March 2026 and ratified by the President in April 2026. The law tightens grid-connection discipline while widening technical pathways for hybridization. It shortens the validity of grid-connection conditions from two years to one year and adds firmer milestones for project execution, including requirements tied to permitting progress against contracted connection capacity within defined timelines.
The Grid Act also raises the financial and procedural bar for speculative applications through an advance payment of PLN 60 per kW (PLN 60,000 per MW). It further introduces clearer deadlines that can accelerate the release of capacity from non-advancing projects. At the same time, expanded cable pooling provisions (including for storage facilities) support co-located PV-plus-BESS configurations and align with the market’s shift toward more dispatchable renewables under grid congestion and curtailment conditions.
Competitive Landscape
The Poland solar energy market hosts a balanced mix of state utilities, European majors, and home-grown specialists. PGE, Energa, and TAURON leverage customer books and capital budgets to integrate PV with planned 900 MWh storage tenders, while RWE, Engie, and SSE Renewables bring cross-border project-finance know-how. Mid-sized developers such as Columbus Energy, R.Power, and ML System carve niches in turnkey rooftop portfolios, bifacial module supply, and perovskite research.
Strategic pivots toward battery storage are escalating: PGE’s USD 4.7 billion commitment ranks among Central Europe’s largest and is expected to unlock flexible capacity that raises solar hosting limits. Acquisition activity also intensifies; ORLEN’s purchase of a 280 MW portfolio and European Energy’s debt-financed farms illustrate consolidation’s role in scaling pipelines and securing grid slots ahead of permitting reforms.
Technology partnerships deliver competitive edges. Developers tie up with inverter makers for grid-forming capabilities, while insurers and recyclers line up extended-warranty products that ease bankability concerns. No single participant exceeds 10% of installed capacity, keeping the arena moderately fragmented and innovative.
Poland Solar Energy Industry Leaders
-
R. Power Sp. Z O.o.
-
PGE Polska Grupa Energetyczna SA
-
Columbus Energy SA
-
BayWa r.e. AG
-
Energa SA
- *Disclaimer: Major Players sorted in no particular order
Poland Solar Energy Market Companies Covered in this Report
- R.Power Sp. z o.o.
- Better Energy A/S
- Sun Investment Group
- BayWa r.e. AG
- Engie SA
- RWE AG
- Alseva Innowacje SA
- Corab Sp. z o.o.
- Green Genius Sp. z o.o.
- PCWO Energy SA
- Polenergia Fotowoltaika SA
- Columbus Energy SA
- PGE Polska Grupa Energetyczna SA
- Energa SA
- Photon Energy N.V.
- EDP Renewables
- E.ON SE
- Hanplast Energy Sp. z o.o.
- Soltec Sp. z o.o.
- ML System SA
Market Opportunities and Future Outlook
The clearest near-term whitespace centers on grid-access reform and hybrid project architectures. The Grid Act framework, together with provisions that allow grid operators to allocate capacity through competitive tendering as an alternative to queue-based principles until the end of 2028, gives sponsors a more structured route for execution where they can evidence permitting readiness. Expanded cable pooling rules also create room for PV plants to add storage behind a shared connection, directly targeting curtailment exposure in solar-dense regions and supporting participation in on-grid revenue streams.
Storage-linked solar development is already visible at the company level, in utility plans and in distributed and C&I adjacencies. Columbus Energy reported installing 918 energy storage units totaling 44 MWh in Q1 2026, which signals active demand for PV-plus-storage solutions beyond utility-scale farms. Alongside corporate PPAs already used by developers to finance subsidy-free or merchant projects, these signals point to opportunities in structured grid-capacity tenders, PV repowering and hybridization, and commercial storage-plus-PV portfolios across industrial and logistics loads.
Recent Industry Developments in Poland Solar Energy Market
- July 2026: R.Power Spółka Akcyjna signed a contract with Onde S.A. for the execution and commissioning of a 300 MW / 1200 MWh battery energy storage system (BESS), including Balance of Plant and a 400 kV main off-take point. The agreement supports large-scale storage integration with solar assets and is intended to improve grid stabilization and raise solar hosting capacity, reinforcing storage-enabled project pipelines in Poland.
- April 2026: R.Power Spółka Akcyjna secured financing from ING Bank Śląski for an 80 MW solar PV project (Lasocice) in Western Poland. Debt financing for utility-scale solar development improves access to project finance and supports faster build-out of new PV capacity in western Poland.
- February 2026: R.Power Spółka Akcyjna raised US$50 million to support the development of a 70.5 MW solar PV portfolio in Poland. The funds increase backing for solar assets and improve project funnel visibility.
Poland Solar Energy Market Report Scope and Research Methodology
Market Definition and Coverage
This market covers solar-based electricity generation in Poland, tracked through installed capacity added and operating base, and captured across utility, commercial, and residential deployment where solar is the primary generation technology.
Scope exclusions: We exclude non-solar renewables, transmission and distribution investments, and general power trading revenues that are not directly tied to solar generation assets.
Segments Covered in This Report
- By Technology
- Solar Photovoltaic (PV)
- Concentrated Solar Power (CSP)
- By Grid Type
- On-Grid
- Off-Grid
- By End-User
- Utility-Scale
- Commercial and Industrial (C&I)
- Residential
- By Component (Qualitative Analysis)
- Solar Modules/Panels
- Inverters (String, Central, Micro)
- Mounting and Tracking Systems
- Balance-of-System and Electricals
- Energy Storage and Hybrid Integration
Data Sources, Market Sizing, and Validation
Desk Research
Desk research was used to set the fact base for Poland solar additions, operating capacity, and policy signals that shape the project pipeline. Public sources such as Statistics Poland (GUS), the Energy Regulatory Office (URE), updates from the national transmission system operator, and EU-level datasets from Eurostat were referenced to understand demand, generation mix, and grid context.
We also reviewed International Energy Agency publications, IRENA statistics, and peer reviewed studies on PV performance and curtailment patterns, then paired those with company filings, investor presentations, and reputable press coverage to cross-check project timing. To fill structural gaps (for example, tracking permitting and award activity), we used paid subscriptions for news and financials, company financials and intelligence, patent databases, and selective contracts and tender screening. The sources listed here are illustrative only, and many other public documents and datasets were also used for data collection, validation, and clarification.
Primary Interviews and Surveys
In Poland, we use expert interviews and surveys with solar developers, installers, equipment distributors, utilities, investors, and large energy users. Their responses help validate reported capacity, project commissioning timing, grid delays, system sizes, and expected demand, while also filling gaps between official releases. Analysts recheck unusual answers against secondary evidence before final assumptions are accepted.
Distribution of primary research fieldwork respondents
| Company type | Respondent position |
|---|---|
| Top tier: 29% | CXOs: 18% |
| Mid tier: 46% | Functional/Unit leaders: 31% |
| Smaller Players: 25% | Managers: 51% |
Market-Sizing & Forecasting
Sizing is built mainly from a top-down capacity reconstruction, where the national installed base, annual additions, and commissioning timelines are used to map the solar buildout path in Poland. To keep totals realistic, we corroborate the results with selective bottom-up checks, such as sampling project pipelines, using typical system cost ranges by project type, and validating implied build rates through channel conversations.
Key inputs used in the model include historical installed capacity levels, expected annual PV additions, the split of microgeneration versus larger farms, grid connection and curtailment signals, and auction and incentive visibility that supports the near-term pipeline. For forecasting, scenario analysis is applied so that slower grid access or permitting delays can be reflected without forcing one straight-line growth path. When bottom-up views are incomplete (for example, for smaller rooftop installers), we handle gaps using penetration-based assumptions anchored to observed additions, then validate the updated build rates again in interviews.
Data Validation & Update Cycle
Model outputs are validated through multiple checks, starting with comparing implied capacity additions against independent public capacity series and project commissioning announcements. Any unusual jumps are reviewed by an analyst, followed by re-checking the underlying assumption set, and then re-contacting sources when a timing or scope mismatch is suspected.
Before sign-off, the numbers go through a second review pass so that unit consistency, year alignment, and conversion logic are clean and repeatable. Reports are refreshed annually, and interim updates are made when material events occur, such as a policy change, a major grid rule update, or a clear shift in commissioning pace. Right before delivery, we do a final scan of the newest public releases to ensure clients receive an updated view.
Mordor Intelligence's Poland Solar Energy Market Sizing Compared With Other Published Estimates
Published market sizes for Poland solar often do not match because some sources report value in USD, while others report volume in installed capacity, and the time windows and technology coverage are not always aligned. Differences also show up when one estimate leans on stated project announcements, and another relies more on commissioned capacity and grid-connected reality.
Some external figures combine solar PV with a wider solar value chain in revenue terms (such as equipment, installation, and services) or focus only on solar power value for a limited year set, which can shift the headline number. The spread is also influenced by how fast prices are assumed to fall, how currency conversion is timed, and whether grid constraints are treated as a near-term limiter or ignored. In the Mordor Intelligence approach, we narrow the scope back to installed solar capacity additions and operating base as counted in the model.
Benchmark comparison
| Source | Market Size | Gaps in Research Methodology |
|---|---|---|
| Mordor Intelligence | USD 24.75 B (2025) | |
| Trade Portal A | USD 2.80 B (2026) | Uses a USD value definition for "solar power" with a different base year, and it does not clearly state whether the figure reflects equipment and build revenues, operating assets, or a mixed approach, which makes it hard to align to installed-capacity tracking. |
| Industry Publisher B | USD 7.50 B (2033) | Reports a longer-dated forecast in USD with a high growth rate and limited transparency on grid-connection timing and curtailment treatment, which can inflate forward totals if announced projects are assumed to convert without delays. |
Taken together, the table shows that most gaps come from unit choice and what gets counted, not only from different growth expectations. By tying the model to observed capacity levels, additions, and execution checks that can be repeated each refresh cycle, the resulting estimate stays easier to trace back to clear inputs and practical assumptions we can explain.
Key Questions Answered in the Report
How fast is installed solar capacity expected to grow in Poland between 2026 and 2031?
Aggregate capacity is forecast to climb from 26.42 GW in 2026 to 36.61 GW in 2031, translating into a 6.74% CAGR in the Poland Solar Energy Market.
Which customer segment is expanding the quickest?
Commercial and industrial installations are projected to advance at a 13.92% CAGR through 2031 in the Poland Solar Energy Market, outpacing utility-scale and residential additions.
What share do on-grid systems currently hold?
On-grid plants accounted for 93.65% of installations in 2025 in the Poland Solar Energy Market and will remain dominant because they qualify for capacity-market revenues.
How is Poland addressing grid congestion in solar-dense regions?
The transmission operator is rolling out multiple 400 kV upgrades scheduled for completion by 2026 and encouraging co-located storage to shift output to evening peaks.
What role will domestic manufacturing play by 2031?
A EUR 1.2 billion incentive aims to localize bifacial-module lines, targeting up to 40% of annual panel demand in line with the Net-Zero Industry Act.
Why are corporate PPAs important for Polish solar developers?
Long-term PPAs with creditworthy offtakers lower financing risk, cutting the weighted average cost of capital by up to 150 basis points and enabling projects to proceed without feed-in tariffs.