Market Overview
| Study Period | 2021 - 2031 |
|---|---|
| Forecast Data Period | 2026 - 2031 |
| Historical Data Period | 2021 - 2024 |
| Market Volume (2026) | 20.85 gigawatt |
| Market Volume (2031) | 32.5 gigawatt |
| Growth Rate (2026 - 2031) | 9.28% CAGR |
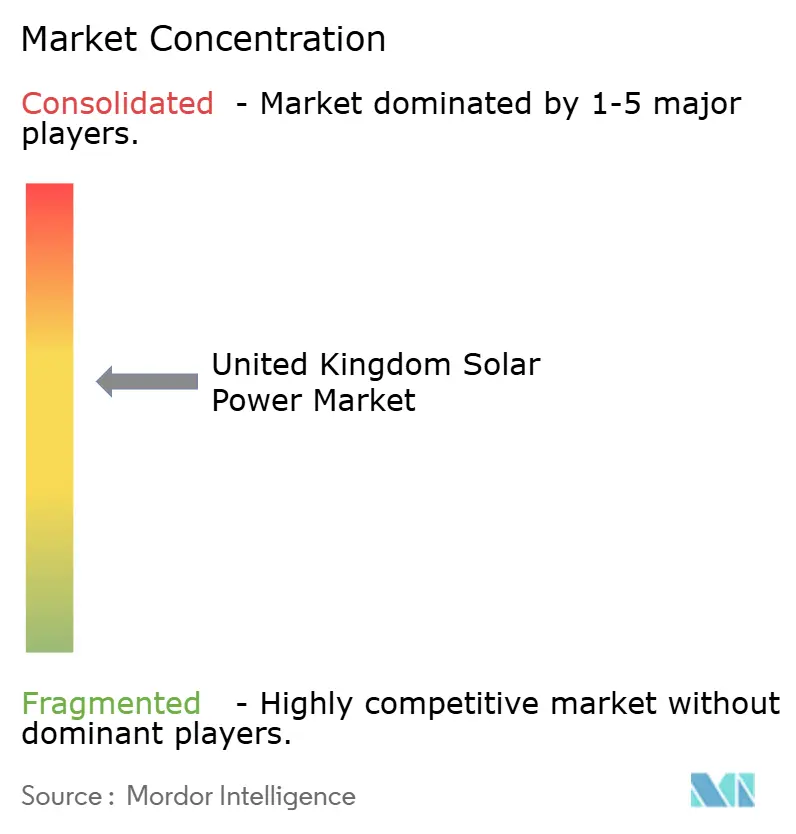
| Market Concentration | Medium |
Major Players *Disclaimer: Major Players sorted in no particular order Image © Mordor Intelligence. Reuse requires attribution under CC BY 4.0. | |

United Kingdom Solar Power Market Analysis by Mordor Intelligence
The United Kingdom Solar Power Market size in terms of installed base is expected to grow from 20.85 gigawatt in 2026 to 32.5 gigawatt by 2031, at a CAGR of 9.28% during the forecast period (2026-2031).
Grid-parity economics now favor merchant utility-scale projects, while rooftop demand is accelerating under supportive tariffs and building codes. Flexible connection rules, rising corporate power-purchase agreements, and cost-competitive storage are steering capacity toward regions with favorable irradiance and available distribution capacity. Policy commitments to a clean electricity system by 2030, paired with investment in public-sector rooftops, have broadened the opportunity set for developers across all scales. Supply-chain diversification, agrivoltaic pilots, and floating solar concepts are emerging as strategic growth avenues as land-use and grid constraints tighten.
Key Report Takeaways
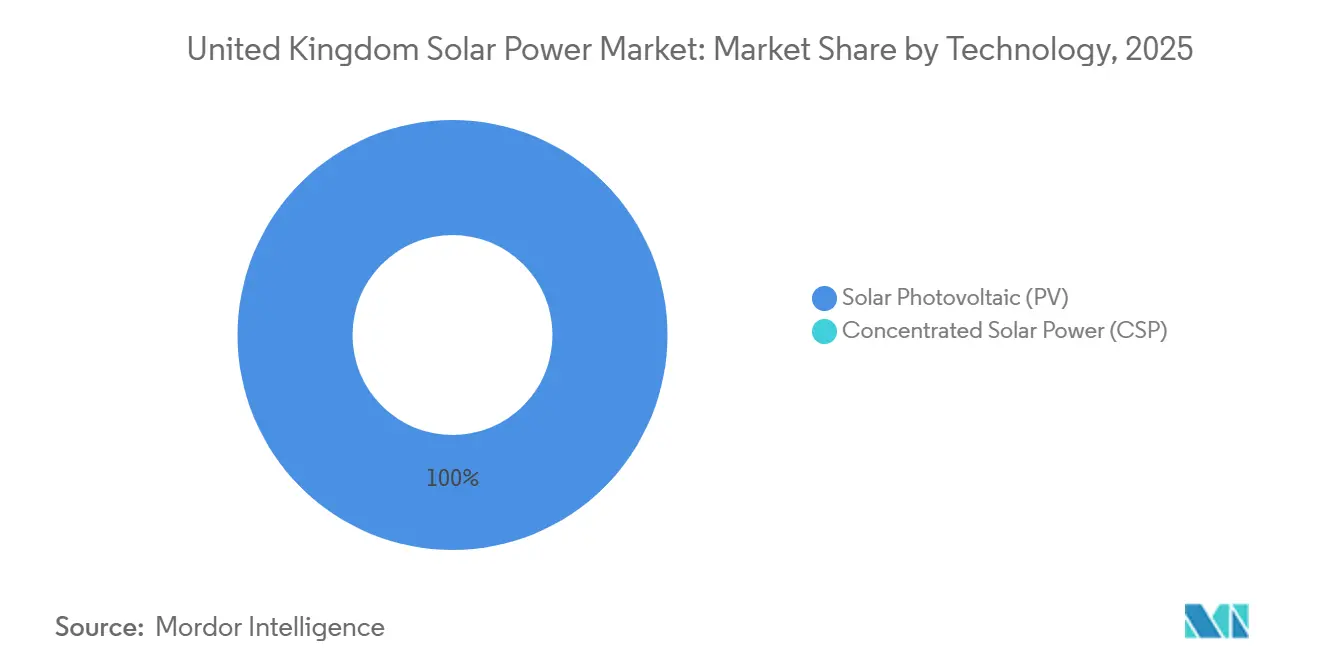
- By technology, photovoltaic modules maintained 100% of the United Kingdom solar power market share in 2025; photovoltaic products drive a 9.28% segment CAGR through 2031.
- By grid type, on-grid assets accounted for 97.1% of the United Kingdom solar power market size in 2025; off-grid systems are projected to grow at a 15.4% CAGR between 2026 and 2031.
- By end user, utility-scale plants captured 72.9% of the United Kingdom solar power market size in 2025, whereas residential installations are expected to grow at a 20.6% CAGR through 2031.
Note: Market size and forecast figures in this report are generated using Mordor Intelligence’s proprietary estimation framework, updated with the latest available data and insights as of January 2026.
United Kingdom Solar Power Market Trends and Insights
Drivers Impact Analysis*
| Driver | (~) % Impact on CAGR Forecast | Geographic Relevance | Impact Timeline |
|---|---|---|---|
| Renewable Energy Obligation Certificates (ROCs) Extension & Corporate PPAs | +1.8% | England, Scotland (industrial clusters) | Medium term (2-4 years) |
| Grid-Parity Achievement in Utility-scale Projects | +2.1% | England (South East, South West, East), Wales | Short term (≤ 2 years) |
| National Grid ESO Reform Favouring Distributed Solar | +1.4% | England (distribution-constrained regions), Scotland | Medium term (2-4 years) |
| Battery-Coupled Solar Economics Enhanced by Ofgem's Flexible Connection Code | +1.9% | England, Scotland, Wales | Short term (≤ 2 years) |
| Rising Demand for Agri-PV to Decarbonise UK Farming Sector | +0.7% | England (East, South West), Wales, Scotland | Long term (≥ 4 years) |
| OEM Supply-Chain Localisation Incentives Under UK Net-Zero Strategy | +0.5% | England (manufacturing hubs), Scotland | Long term (≥ 4 years) |
| Source: Mordor Intelligence | |||
Renewable Energy Obligation Certificates Extension Spurs Corporate PPAs
The ROC window through March 2027 underpins 10–15-year corporate PPAs, letting manufacturers and data centers hedge volatile wholesale prices while meeting disclosure mandates. Industrial demand clusters in Scotland and England absorb midday generation, lowering curtailment risks. The ROC floor de-risks early cash flows, unlocking bank finance for mid-scale developers, yet a commissioning rush is expected before the mechanism sunsets. Without larger CFD rounds, post-2027 activity could soften.[1]DESNZ, “Clean Power 2030 Action Plan,” DESNZ.gov.uk
Grid-Parity Achievement in Utility-Scale Projects Accelerates Merchant Solar
Levelized costs below GBP 0.045 per kWh in 2024 let southern English projects rely on wholesale, embedded-benefit, and ancillary-service revenues. Bifacial modules and single-axis trackers enhance yields, demonstrated by GRIDSERVE’s York site, which integrates 27 MW storage to capture multiple value streams.[2]Energy Storage News, “GRIDSERVE Completes Subsidy-Free Solar-Plus-Storage,” energystoragenews.com Merchant viability concentrates pipelines in high-irradiance counties, attracting institutional capital and reducing policy risk.
National Grid ESO Reform Favors Distributed Participation
Locational capacity auctions now prioritize distribution-connected solar, shortening queues and lowering charges for 10–50 MW arrays that relieve local demand. Developers are redrawing site plans to fit 11 kV or 33 kV thresholds and pairing storage to qualify for flexible agreements. The forthcoming Spatial Energy Plan may codify this tilt toward urban and peri-urban distributed solar.
Battery-Coupled Solar Economics Enhanced by Flexible Connection Code
Sharing export limits allows oversizing solar and storing surplus for evening peaks, when prices run 40–60% higher. Battery-paired solar capacity jumped 122% in the first nine months of 2025 as projects stack wholesale, frequency response, and capacity-market income. Sophisticated energy-management systems are now standard to comply with real-time export ceilings.
Restraints Impact Analysis*
| Restraint | (~) % Impact on CAGR Forecast | Geographic Relevance | Impact Timeline |
|---|---|---|---|
| Land-Use Planning Constraints in England's National Planning Policy Framework | -1.2% | England (agricultural counties) | Medium term (2-4 years) |
| Grid Congestion & Long Queue Times for Connections in Northern England | -1.5% | Northern England, Scotland | Short term (≤ 2 years) |
| Import Dependency Risk from Xinjiang Silicon Module Supply Chain | -0.6% | UK-wide | Medium term (2-4 years) |
| Volatile CFD Strike Prices Limiting Small-scale Project Bankability | -0.8% | England, Wales, Scotland | Short term (≤ 2 years) |
| Source: Mordor Intelligence | |||
Land-Use Planning Constraints Challenge Expansion
Agricultural land classifications hinder solar on Grade 1–3a soils, extending approvals to 18–24 months. Projects in Somerset and North Yorkshire face rejection unless dual-use or brownfield siting is proven. Elevated remediation costs on landfills further squeeze margins, shifting developers toward Wales and Scotland.[3]DESNZ, “National Planning Policy Framework 2024 Revision,” DESNZ.gov.uk
Import Dependency Risk from Xinjiang Silicon
Traceability rules under the U.S. Uyghur Act spill into European procurement, leading UK buyers to audit Tier 1 suppliers. Module costs could rise 3–5% if alternative polysilicon sources are mandated, squeezing fixed-price PPAs. Diversified sourcing or domestic assembly would mitigate exposure.[4]Ofgem, “Connections Reform Consultation Outcome,” Ofgem.gov.uk
*Our forecasts treat driver/restraint impacts as directional, not additive. The impact forecasts reflect baseline growth, mix effects, and variable interactions.
Segment Analysis
By Technology: Solar PV Dominates Temperate Climate
Solar photovoltaic technology captured 100% of the UK solar power market share in 2025 and is set to grow at a 9.3% CAGR through 2031, keeping the UK solar power market entirely PV-driven. Field tests in North Yorkshire show bifacial modules generating 15–17% more energy than monofacial references, validating rapid bifacial uptake. Half-cell and multi-busbar designs further boost low-light yields, aligning with the nation’s diffuse-irradiance profile.
Module innovations dovetail with inverter trends: string inverters dominate utility arrays for cost efficiency, whereas microinverters prosper on rooftops by mitigating chimney and tree shading. Tracking remains niche, yet University of Southampton trials could quantify dual-axis value at high latitudes over 2026–2028. Collectively, these advancements reinforce the technology’s lock-in across the UK solar power market.


By Grid Type: Off-Grid Gains in Remote Applications
On-grid assets held 97.1% of the UK solar power market size in 2025, underpinned by the Smart Export Guarantee, which paid GBP 56.97 million to prosumers that year. SEG tariffs, ranging from GBP 0.04-0.25 per kWh, spur battery adoption for export timing.
Off-grid systems, growing at a 15.4% CAGR, now underwrite microgrids on the Hebrides and Orkney, where subsea cables cost GBP 500,000 per kilometer. Lithium-ion storage below GBP 150 per kWh and portable solar for construction sites widen the addressable base. Off-grid’s share of the UK solar power market remains small yet strategic for resilience and rural electrification.
By End User: Residential Segment Surges on Policy Mandates
Utility-scale projects held 72.9% of 2025 capacity, benefiting from GBP 0.50-0.70 per-watt installed costs and 50 MW clustering for economies. Multiple merchant and CFD-backed farms, such as Larks Green, crossed financial close in 2024, reinforcing scale dominance.
The residential surge, advancing at 20.6% CAGR, reflects 206,682 rooftop certifications in 2025 and the Future Homes Standard mandate for new-build solar. Battery bundling and agile export tariffs heighten self-consumption. Commercial-and-industrial rooftops fill the middle ground, offsetting demand charges with 100-500 kW arrays. Together, these trends diversify end-user demand across the UK solar power market.

Geography Analysis
England commands 86% of installed capacity and added 1.8 GW in 2024, with the South East, South West, and East featuring the densest pipelines. South West irradiance over 1,100 kWh/m² attracts 50 MW farms such as Litchardon Cross. Cornwall leads rooftop uptake with 3,726 installations in 2025, evidencing favorable local policies. Yet NPPF land-use tests slow greenfield approvals, nudging developers toward brownfield plots and distribution-level connections.
Scotland trails in PV yet offers accommodating land-use rules and hybrid project potential. Islands reliant on diesel now pilot solar-storage microgrids, cutting generation costs from GBP 0.40 to GBP 0.20 per kWh. Transmission congestion to England constrains exports, prompting co-located batteries that time-shift excess power.
Wales posts the UK’s best 2025 load factor at 10%, aided by south-coast irradiance and community-benefit policies. Capacity is rising in Pembrokeshire, while smaller industrial demand caps rooftop potential. Northern Ireland remains niche, contributing under 2% capacity, though agrivoltaics could unlock farm diversification. Regional dynamics suggest England will still capture 80-85% of new capacity, with Scotland pursuing hybrids and Wales modest growth.
Competitive Landscape
Market fragmentation is moderate. Lightsource bp, EDF Renewables, and Octopus Energy Generation lead utility-scale development, leveraging merchant financing and corporate PPAs. Foresight Solar Fund and NextEnergy Capital focus on operational acquisitions, optimizing yields via repowering. JinkoSolar, Canadian Solar, and Trina Solar collectively supply over 60% of utility modules, while First Solar services low-carbon procurement niches.
Residential installation is fragmented among 500+ MCS-certified firms, driving price competition and consolidation. Agrivoltaic pioneers such as Low Carbon Farming and Winch Energy test sheep-grazing designs, whereas floating solar specialists explore reservoir deployment at water-utility sites. Great British Energy’s GBP 180 million public-estate rooftop program offers steady EPC awards. Battery retrofit and hybrid solar-wind plays represent white-space for nimble entrants. Compliance with MIS 3002 and G98/G99 remains a gating barrier, favoring incumbents with certification and DNO ties.
United Kingdom Solar Power Industry Leaders
Lightsource bp Renewable Energy Investments Ltd
EDF Renewables UK (Electricité de France SA)
Octopus Energy Generation
Foresight Solar Fund Ltd
ScottishPower Renewables (Iberdrola SA)
- *Disclaimer: Major Players sorted in no particular order

Recent Industry Developments
- April 2025: Ofgem-approved reforms aim to cut grid-connection delays and unlock GBP 40 billion per year for network upgrades.
- April 2025: The UK rooftop segment logged its strongest first quarter since 2012, posting new monthly generation records.
- March 2025: AlphaReal purchased five solar parks for £160 million, signaling an ongoing institutional appetite for operational assets.
- February 2025: Quinbrook secured the 350 MW Mallard Pass project, one of the country’s largest planned arrays.


Research Methodology Framework and Report Scope
Market Definitions and Key Coverage
Our study treats the United Kingdom solar power market as the total on-grid and off-grid photovoltaic capacity physically installed within UK borders, spanning crystalline-silicon, thin-film, and emerging tandem modules that feed residential, commercial-industrial, and utility demand pools. Energy generated solely for on-site thermal applications or offshore floating wind-solar hybrids is outside this boundary, keeping the lens fixed on PV electricity.
Scope exclusion: Concentrated solar power projects and component export sales are intentionally left out.
Segmentation Overview
- By Technology
- Solar Photovoltaic (PV)
- Concentrated Solar Power (CSP)
- By Grid Type
- On-Grid
- Off-Grid
- By End User
- Utility-Scale
- Commercial and Industrial (C&I)
- Residential
- By Component (Qualitative Analysis)
- Solar Modules/Panels
- Inverters (String, Central, Micro)
- Mounting and Tracking Systems
- Balance-of-System and Electricals
- Energy Storage and Hybrid Integration
Detailed Research Methodology and Data Validation
Primary Research
Mordor analysts interviewed EPC contractors, inverter suppliers, asset managers, and distribution network operators across England, Scotland, and Wales. These conversations validated installed-cost ranges, curtailment penalties, and realistic build-out rates, then challenged early desk assumptions on battery-coupled uptake.
Desk Research
We began with publicly available energy statistics issued by the Department for Energy Security & Net Zero, National Grid's Future Energy Scenarios, and deployment registers maintained by Ofgem, which provide granular commissioning dates and accredited system sizes. Complementary insights flowed from IRENA's Renewable Capacity Database and trade-association briefs from Solar Energy UK, while peer-reviewed papers in journals such as Renewable Energy track efficiency gains and learning curves. To fill financial and developer-level gaps, analysts mined D&B Hoovers and Dow Jones Factiva for disclosed project costs, PPAs, and portfolio announcements. This list is illustrative; many additional public and paid references were assessed to cross-check figures and narrative signals.
Market-Sizing & Forecasting
A top-down reconstruction starts with annual installed-capacity data from government registers, which are then trended forward using pipeline visibility and planning-approval lead times. Results are corroborated with bottom-up checks, sampled module shipments, and median system costs to test volume-value coherence. Key variables inside the model include planning approval success rates, corporate PPA appetite, residential payback periods, battery attachment ratios, grid-connection queue lengths, and real module ASP declines. Multivariate regression against those drivers projects capacity and value through 2030, while scenario analysis stress-tests policy or price shocks. Any bottom-up gaps are bridged by weighting developer disclosures with historic realization factors.
Data Validation & Update Cycle
Outputs pass anomaly screens that flag variances against National Grid demand projections and BloombergNEF price decks. Senior reviewers sign off after peer review. Reports refresh annually; should policy or subsidy changes arise, an interim revision is triggered before clients receive the latest view.
Why Our UK Solar Power Baseline Commands Reliability
Published UK solar estimates often diverge because firms pick different unit measures, currency bases, or update cadences.
Key gap drivers include contrasting scope (some fold in thermal CSP), currency conversions that overlook 2025 sterling swings, or single-source ASP assumptions that Mordor's dual-source checks correct. Others update biennially, whereas we revisit inputs each quarter when planning permissions spike.
Benchmark comparison
| Market Size | Anonymized source | Primary gap driver |
|---|---|---|
| 19.28 GW (2025 installed capacity) | Mordor Intelligence | - |
| USD 8.24 B (2024 market revenue) | Global Consultancy A | Mixes revenue with capacity and fixes exchange at 2022 rates |
| 23.50 GW (2024 installed capacity) | Industry Association B | Excludes rooftop systems below 5 kW |
| 20.2 GW (2024 installed capacity) | Trade Journal C | Pipeline projects counted before final grid connection |
The comparison shows that when scope, currency, and commissioning status differ, headline values drift. Mordor's disciplined cross-checks and quarterly refresh give executives a dependable, transparent starting point for strategy.


Key Questions Answered in the Report
How large is the UK solar power market in 2026?
The installed capacity reaches 20.85 GW in 2026, growing toward 32.50 GW by 2031.
What is driving rooftop adoption among homeowners?
The Future Homes Standard mandate, Smart Export Guarantee payments, and falling battery costs fuel a 20.6% CAGR in residential installations.
Which UK regions add the most new solar capacity?
England’s South East, South West, and East regions together account for about 86% of recent additions, thanks to higher irradiance and grid availability.
Why are bifacial panels gaining share?
Field data show 15–17% higher output versus monofacial panels under UK conditions, improving project economics even with slightly higher degradation rates.
How is grid congestion being addressed?
National Grid ESO’s distributed-solar reforms and Ofgem’s flexible connection code prioritize ready projects and allow solar-plus-storage sites to share export limits.
Page last updated on:


