
Market Overview
| Study Period | 2026 - 2031 |
|---|---|
| Forecast Data Period | 2026 - 2031 |
| Base Year Market Size (2025) | USD 162.87 Million |
| Market Size (2026) | USD 179.92 Million |
| Market Size (2031) | USD 310.20 Million |
| Growth Rate (2026 - 2031) | 11.51 % |
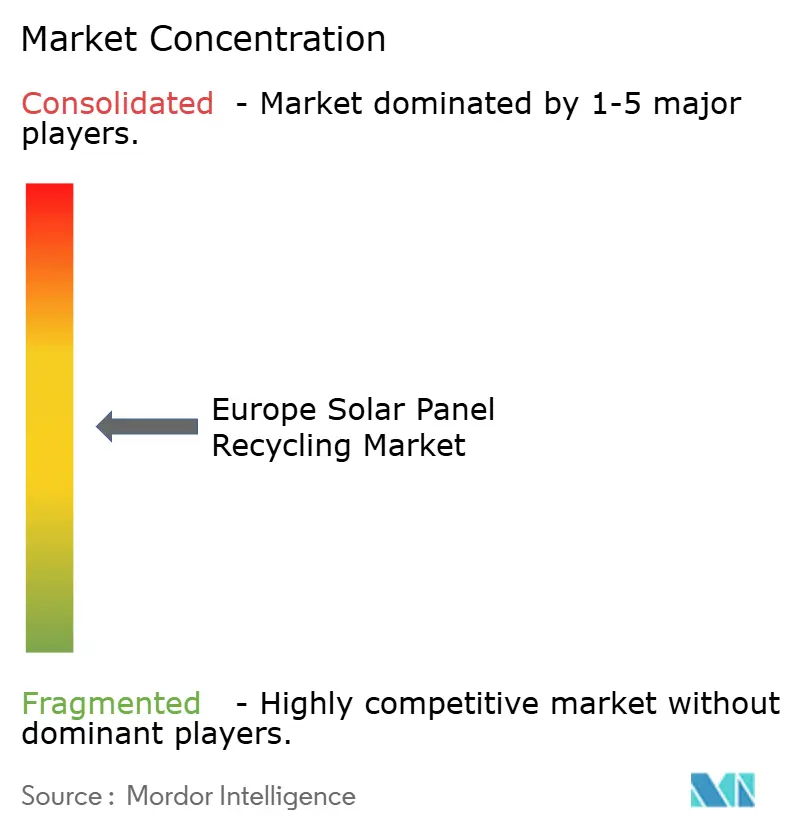
| Market Concentration | Medium |
Major Players
*Disclaimer: Major Players sorted in no particular order Image © Mordor Intelligence. Reuse requires attribution under CC BY 4.0. |
|
Europe Solar Panel Recycling Market Analysis by Mordor Intelligence
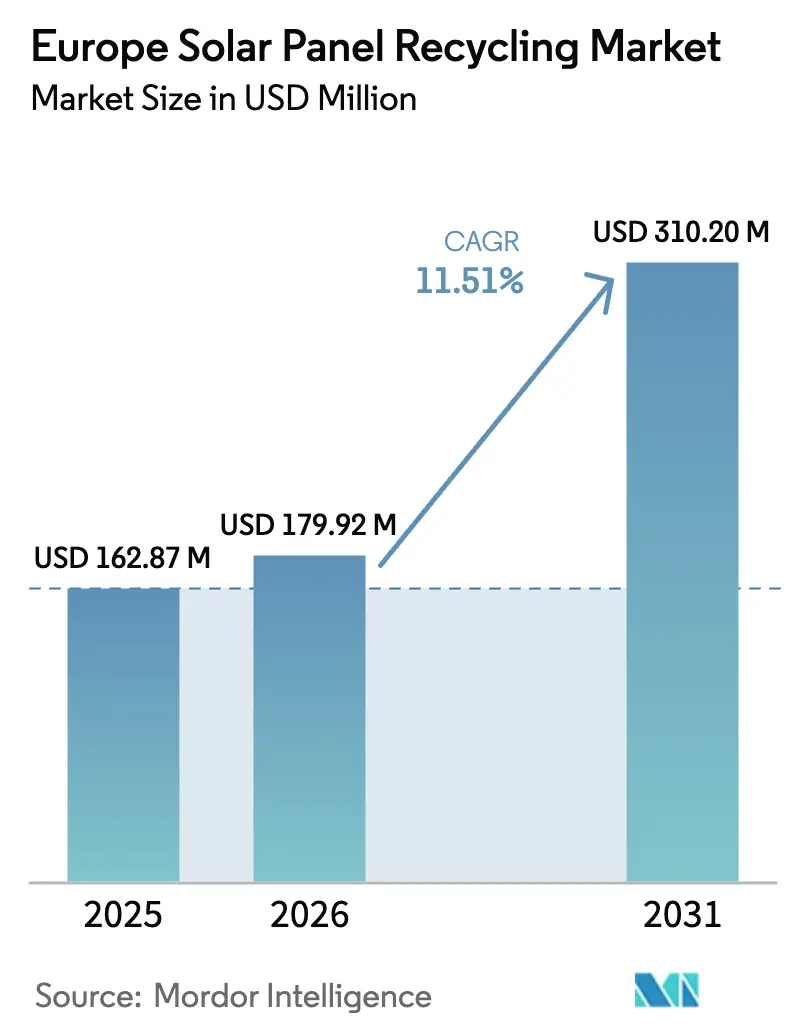
The Europe Solar Panel Recycling Market size is expected to grow from USD 162.87 million in 2025 to USD 179.92 million in 2026 and is forecast to reach USD 310.20 million by 2031 at 11.51% CAGR over 2026-2031.
The momentum results from a convergence of strict waste-electrical rules, geopolitical pressure to secure critical raw materials, and proven technologies that now extract glass, silver, and silicon at an industrial scale. Mandatory producer financing under WEEE and expanding Extended Producer Responsibility (EPR) schemes guarantee an expanding feedstock pipeline, while the EU Critical Raw Materials Act unlocks Innovation Fund grants that de-risk capital expenditures. Cross-sector pull from automotive battery makers keeps a floor under recycled silicon prices, counterbalancing historic revenue swings linked only to silver markets. At the same time, process innovation is trimming operating costs: laser delamination lifts recovery yields, and regional pre-processing hubs compress logistics outlays. Collectively, these shifts are pushing the European solar panel recycling market toward a self-sustaining circular model anchored in resource security rather than landfill avoidance.[1]
Key Report Takeaways
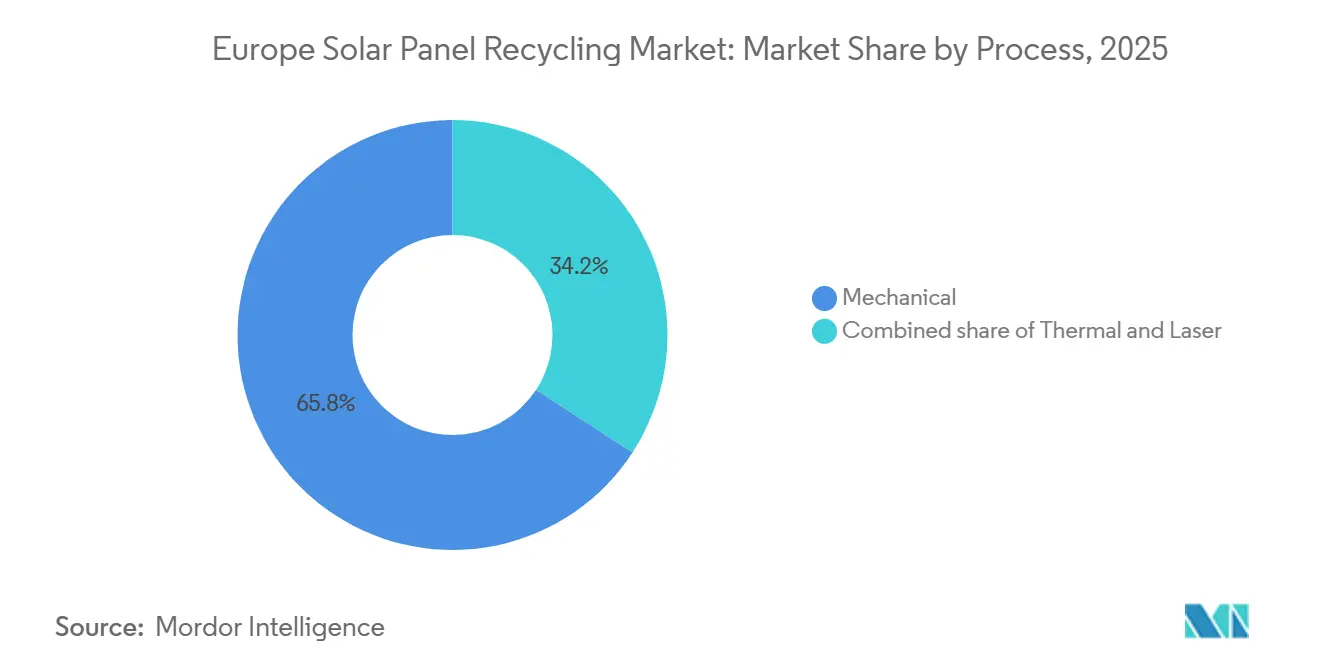
- By process, mechanical methods led with 65.8% revenue share in 2025; laser-based delamination is forecast to post the highest 16.9% CAGR to 2031.
- By panel type, crystalline silicon captured 81.6% of the European solar panel recycling market share in 2025, whereas thin-film CIGS panels are projected to expand at a 19.1% CAGR through 2031.
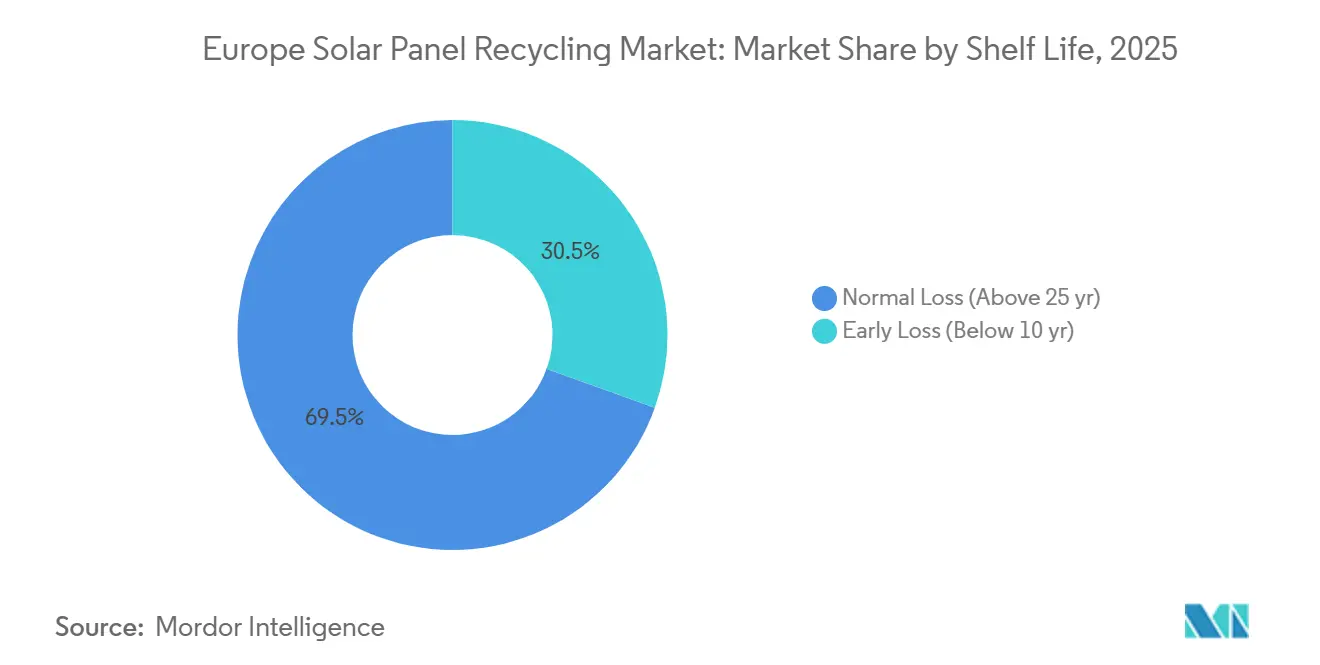
- By shelf life, normal-loss modules older than 25 years represented 69.5% of inbound waste in 2025; early-loss units under 10 years will advance at a 16.2% CAGR to 2031.
- By material recovered, glass held a 48.2% share of the European solar panel recycling market size in 2025, yet silver recovery is expected to rise at a 15.3% CAGR over the outlook period.
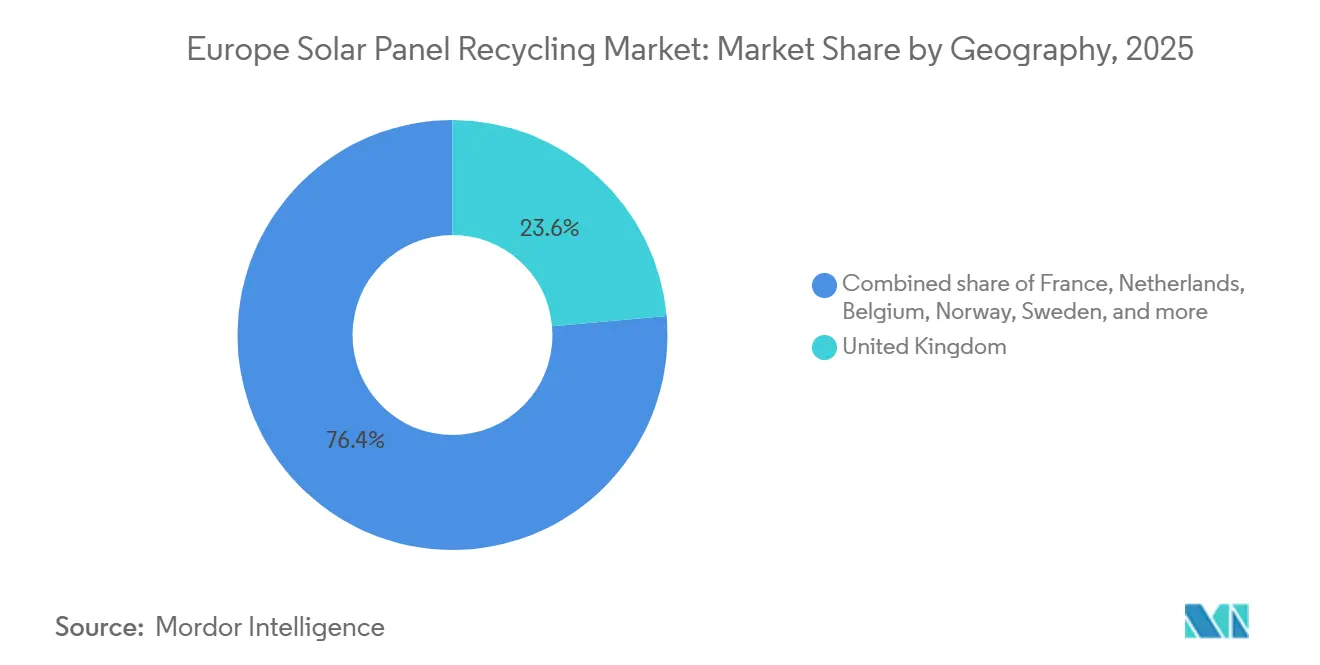
- By geography, the United Kingdom accounted for 23.7% of revenue in 2025 and is projected to maintain the fastest 13.7% CAGR between 2026-2031.
- Veolia, Reiling, ROSI Solar, PV Cycle, and First Solar collectively controlled roughly 35-40% of 2025 revenues, reflecting a market that is consolidating but still offers headroom for technology-driven challengers.
Note: Market size and forecast figures in this report are generated using Mordor Intelligence’s proprietary estimation framework, updated with the latest available data and insights as of January 2026.
Market Trends and Insights
Drivers Impact Analysis of Europe Solar Panel Recycling Market*
| Driver | (~) % Impact on CAGR Forecast | Geographic Relevance | Impact Timeline |
|---|---|---|---|
| Rapid growth of EU PV installations reaching >70 GW p.a. | +3.2% | EU-wide, with concentration in Germany, France, Spain, Netherlands | Medium term (2-4 years) |
| Mandatory producer-financed recycling under WEEE & EPR | +2.8% | EU-wide, with stricter enforcement in UK, Germany, France | Short term (≤ 2 years) |
| Commercialisation of high-value silicon & silver recovery technologies | +2.1% | Germany, France, Italy, Netherlands | Medium term (2-4 years) |
| EU Critical Raw Materials Act prioritising PV waste streams | +1.9% | EU-wide, strategic focus in Germany, France, Poland | Long term (≥ 4 years) |
| Automotive OEM demand for recycled solar-grade silicon for EV batteries | +1.5% | Germany, France, UK, with spillover to Central Europe | Long term (≥ 4 years) |
| Source: Mordor Intelligence | |||
Rapid Growth of EU PV Installations Reaching >70 GW Annually
Photovoltaic build-outs exceeded 70 GW in 2024 and remain on pace for similar yearly additions, front-loading a deferred waste surge estimated at 2.5 million tonnes by 2031.[2] Rising volumes give recyclers long-term visibility that supports 10-plus-year plant lifetimes. Germany and Spain contributed over 14 GW each in 2024, accelerating the need for collection partnerships that pre-book fleet decommissioning. The growth also tightens landfill restrictions because environmental agencies now track module flows against installation registries. Collectively, these forces create a predictable, sizable feedstock that encourages creditors to underwrite large-scale capacity.
Mandatory Producer-Financed Recycling Under WEEE & EPR
The 2012 WEEE amendment, and its country-specific EPR transpositions, compel manufacturers to absorb all collection and processing costs, eliminating volume risk for recyclers but compressing fee margins when the distance to the plant exceeds 400 km. France’s SOREN scheme gathered 6,200 tonnes of PV waste in 2024, a 40% increase over 2023, proving regulatory teeth are now fully in place.[3] Germany’s Stiftung EAR issued fines for non-registered imports, signaling that passive compliance is no longer tolerated. These penalties encourage module redesign for easier disassembly, indirectly improving recycling yields.
Commercialization of High-Value Silicon & Silver Recovery Technologies
Laser-based delamination and thermo-chemical silicon extraction demonstrated pilot-scale success in 2024, lifting wafer recovery to 87% and securing 99.99%-pure silver fractions when paired with METALOR refining lines. By cutting contamination, recyclers can sell silicon at 60-70% of virgin polysilicon prices, bringing an additional USD 20-30 per module in value capture. These margins justify capital budgets near EUR 3 million per line when throughput tops 5,000 tonnes annually, tipping ROI calculations decisively in favor of advanced systems.
EU Critical Raw Materials Act Prioritizing PV Waste Streams
Adopted in March 2024, the Act earmarks EUR 400 million in Innovation Fund grants for recycling plants that secure silicon, silver, and indium domestically. It also sets a 15% recycled-content requirement for public-procured panels post-2027, creating a guaranteed offtake channel for recovered fractions. Poland and the Czech Republic are positioning themselves as processing hubs by offering fast-track permits and lower labor costs, but must still align with EU certification protocols slated for release in mid-2026.
Restraints Impact Analysis of Europe Solar Panel Recycling Market*
| Restraint | (~) % Impact on CAGR Forecast | Geographic Relevance | Impact Timeline |
|---|---|---|---|
| High logistics cost for bulky modules across EU borders | -1.8% | Cross-border routes, particularly Eastern Europe to Western Europe | Short term (≤ 2 years) |
| Slow scale-up of purpose-built recycling lines (<30 kt/yr capacity) | -1.5% | EU-wide, with bottlenecks in Spain, Italy, Poland | Medium term (2-4 years) |
| Silver price volatility undermining recycler ROI | -1.2% | EU-wide, affecting all recyclers dependent on precious-metal recovery | Short term (≤ 2 years) |
| Source: Mordor Intelligence | |||
High Logistics Cost for Bulky Modules Across EU Borders
Transport dominates cost structures when modules travel beyond 300 km, reaching EUR 0.12 per kilogram on some Poland-to-France routes.[4] Basel Convention paperwork and lead-cadmium testing add week-long delays, eroding recycler cash flow. Regional shredding hubs cut weight by up to 70%, but replicating equipment across 10-15 satellite sites strains balance sheets for small operators.
Slow Scale-Up of Purpose-Built Recycling Lines (< 30 kt/yr)
Europe had only 30 kt of annual capacity in 2025 against 200 kt of waste looming by 2030. Veolia’s Rousset plant, though pioneering, maxes out at 4 kt per year and took 24 months to permit. Financing hurdles persist because revenue depends on uncertain future waste flows; EIB loans to ROSI Solar are disbursed only after offtake contracts are signed, prolonging start-up timelines.
*Our forecasts treat driver/restraint impacts as directional, not additive. The impact forecasts reflect baseline growth, mix effects, and variable interactions.
Europe Solar Panel Recycling Market Segment Analysis
By Process:
Laser Delamination Challenges Mechanical DominanceMechanical shredding controlled 65.8% of 2025 revenue because legacy lines are fully depreciated and remain easy to operate. However, laser systems are expanding at a 16.9% CAGR, the sharpest among all processes, thanks to 95% glass purity and residue-free wafer output that garners higher sale prices. In USD terms, laser-enabled plants add USD 25-30 per tonne in incremental value, a differential sufficient to amortize EUR 3 million equipment packages when annual volumes exceed 5,000 tonnes. ROSI Solar’s hybrid flow pairs low-cost shredding for aluminum removal with laser finishing for high-grade fractions, demonstrating a pragmatic bridging strategy that aligns with evolving WEEE air-emission norms. Over the forecast horizon, mechanical methods will still serve thin-film modules and small-scale feeders, but laser units are poised to command premium fractions and set new benchmarks for environmental compliance within the European solar panel recycling market.
Operational scale remains the decisive adoption filter. Below 2,500 tonnes per year, simple shredders outcompete in capex and uptime, giving them an embedded base in smaller Eastern European and Mediterranean markets. Yet national tenders increasingly score bids on recovery rates, gradually shifting procurement in favor of laser or thermo-chemical lines. Public funding under the EU Innovation Fund specifically prioritizes > 85% recovery thresholds, effectively nudging future capacity toward advanced configurations and trimming the long-term share of basic mechanical plants within the European solar panel recycling market landscape.

By Panel Type:
Thin-Film Waste Accelerates Despite Crystalline PrevalenceCrystalline silicon modules represented 81.6% of inbound waste in 2025, mirroring their installation share. Their diversified material mix, glass, aluminum, silicon, and silver, keeps them the economic backbone of the European solar panel recycling market. Thin-film CIGS, however, is growing at a 19.1% CAGR because many first-wave utility arrays are failing earlier than projected. Although CIGS panels lack silver, they contain indium and gallium, which the Critical Raw Materials Act now ranks as strategic, propelling specialized recovery ventures in Germany and Italy. Early adopters such as First Solar illustrate closed-loop viability, recovering 90% of cadmium-telluride material for re-use.
Variations in regulatory costs further shape segment economics. Thin-film recyclers must manage hazardous-waste permits, adding EUR 50-100 per tonne. Crystalline processors steer clear of these surcharges, but they may face diminishing silver returns as modern modules adopt lower metallization loadings. Panel OEMs are responding with take-back programs that interlock with their own recycling pilots, a trend exemplified by Trina Solar’s 2024 fully recycled module, which showcases how manufacturer control can shorten material loops and reshape competition across panel categories within the European solar panel recycling market.
By Shelf Life:
Early-Loss Failures Move Center StageModules older than 25 years accounted for 69.5% of 2025 waste, but units under 10 years will rise at a 16.2% CAGR, fueled by storm damage, manufacturing defects, and grid-code upgrades. Early-loss modules complicate planning because they appear unpredictably, yet they offer higher residual performance, enabling resale into off-grid uses. ROSI Solar’s April 2025 pact with Yingli segregates such modules through automated flash testing, extracting a secondary revenue stream that offsets recycling costs. Parallel trends in insurance, hail-damage claims jumped 60% in Germany and France in 2024, meaning that decommissioning decisions now rest as much with underwriters as asset owners.
Normal-loss modules still deliver superior silver yields because older cells used heavier metallization. Yet they also suffer deeper encapsulant browning and micro-cracking, requiring aggressive mechanical or thermal treatment that elevates energy input. By 2031, recyclers anticipate processing equal volumes from both age cohorts, demanding flexible plant layouts that can switch between resale screening and material shredding without lengthy changeovers.
By Material Recovered:
Silver Growth Outpaces Glass VolumeGlass accounted for 48.2% of 2025 material value owing to its mass share, but price points remain low at EUR 30-70 per tonne. Silver, only a few hundred grams per tonne, is projected to post the fastest 15.3% CAGR because purity upgrades unlock direct sales to electronics and jewelry supply chains that pay 10-15% above bullion traders. Fixed-price agreements, such as ROSI Solar’s tie-up with METALOR, illustrate how vertical deals hedge market swings, stabilizing EBITDA even when spot markets soften. Silicon wafer recovery, showcased by the FORESi consortium’s 87% yield pilot, may scale to 5,000 tonnes yearly by 2027, but still faces high chem-refining costs that limit near-term margin contribution.
Aluminum and copper remain quick-cash fractions, easy to process and liquid to sell, yet they deliver limited upside. Conversely, indium and gallium from CIGS lines could command strategic premiums once hydrometallurgical routes mature, backed by Innovation Fund calls that reward critical-material extraction. The evolving hierarchy underscores why glass tonnage may shrink in relative value even as volumes climb, while high-purity metals and silicon dictate profitability arcs inside the European solar panel recycling market.
Geography Analysis
United Kingdom Solar Panel Recycling Market
The United Kingdom dominated the European solar panel recycling market in 2025 with 23.7% revenue share and is set to grow at 13.7% CAGR through 2031. The advance reflects stringent WEEE enforcement, dense rooftop fleets, and ROSI Solar’s partnership with Waste Experts, which extends collection to 95% of postal codes and lowers per-module logistics costs by 25%. Government grants aimed at “green jobs” further sweeten project economics, encouraging domestic processing rather than export to continental plants.
France and Germany Solar Panel Recycling Market
France and Germany together supplied over 40% of regional capacity in 2025. Veolia’s Rousset plant and Reiling’s dual German sites anchor Western Europe’s infrastructure, processing 12,000-plus tonnes annually. Both countries benefit from transparent compliance registries, SOREN and Stiftung EAR, that provide recyclers with advance visibility into decommissioning schedules, enabling feedstock contracts that run five years or longer. Germany’s industrial clusters also host glass and metal buyers, trimming transport legs for recovered fractions.
Southern, Eastern Europe and Nordics Solar Panel Recycling Market
Southern and Eastern Europe are emerging fast. Spain, propelled by the Trabede and Greening Group’s 8,000-tonne plant planned for 2027, leverages lower labor costs and proximity to Iberian utility portfolios facing EPR mandates. Italy, with 9-Tech’s Venice laser pilot, positions itself as a technology testbed, though national capacity remains under 3 kt per year. Poland and the Czech Republic advertise rapid-permit zones to lure investors under the Critical Raw Materials Act, but capital deployment is lagging due to financing constraints and refining bottlenecks. Nordic markets remain niche, yet Norsk Solar Recycling’s 1,500-tonne line offers a template for high-latitude nations seeking localized processing that avoids expensive cross-Baltic transport.
Regulatory Landscape
Solar panel waste management in Europe is primarily governed by the EU Waste Electrical and Electronic Equipment (WEEE) Directive (2012/19/EU). It places photovoltaic panels under producer responsibility rules and requires producers to finance collection and treatment through national Extended Producer Responsibility (EPR) schemes. The framework sets minimum targets for equipment in the relevant category, including 85% recovery and 80% preparation for re-use or recycling, which in turn shapes tender requirements and encourages recycler process choices toward higher-yield configurations.
In 2024, Directive (EU) 2024/884 amended WEEE to clarify obligations for photovoltaic panels, including marking requirements for panels placed on the market from 13 August 2012, and it reinforces traceable identification. EN 50419:2022 is commonly referenced as the preferred marking standard to support date tracking. This helps registries and compliance schemes allocate responsibility and supports enforcement actions against non-registered imports at the member-state level.
Competitive Landscape
Competition in the European solar panel recycling market is moderate and technology-centric. Veolia, Reiling, ROSI Solar, PV Cycle, and First Solar hold 35-40% combined revenue, but entry barriers are falling as Innovation Fund grants cover up to 60% of eligible capex. Veolia’s 2024 move to purchase aging solar farms illustrates a vertical strategy that locks in feedstock before rivals bid. ROSI Solar counters with a refining ecosystem, AGC Glass for cullet, METALOR for silver, Yingli for resale testing, tightening its grip on value-add steps and achieving margins smaller plants struggle to match.
Manufacturers are entering the fray. Trina Solar’s fully recycled module, shielded by 37 patents, stakes a claim that OEMs can internalize circularity, leveraging brand and scale to outflank independent recyclers. First Solar remains the thin-film specialist, operating closed-loop CdTe lines since 2018 and supplying tales of 90% material recovery that resonate with policymakers targeting hazardous-waste reduction. Laser trailblazers 9-Tech and Apellix differentiate on purity and carbon metrics; however, capital needs above EUR 2 million per line pose a hurdle unless throughput tops 5,000 tonnes annually.
Consolidation is expected as midsize firms lacking proprietary technology pair with collection specialists to survive. Cross-border partnerships, typified by ROSI Solar’s UK and Swiss logistics tie-ups, foreshadow a regional supply-web where high-value fractions flow to centralized refiners while low-value glass remains local. Regulatory harmonization on recycled-content verification, due mid-2026, will likely raise compliance costs, nudging the market toward fewer but larger, certified operators.
Europe Solar Panel Recycling Industry Leaders
-
Veolia Environnement S.A.
-
Reiling PV-Recycling GmbH
-
ROSI Solar
-
PV Cycle (incl. Soren)
-
First Solar Inc. (Europe ops)
- *Disclaimer: Major Players sorted in no particular order
Europe Solar Panel Recycling Market Companies Covered in this Report
- Veolia Environnement S.A.
- Reiling PV-Recycling GmbH
- ROSI Solar
- PV Cycle
- First Solar Inc.
- SunPower Corporation
- JA Solar Holdings Co. Ltd.
- Trina Solar Co. Ltd.
- Canadian Solar Inc.
- Renesola Ltd.
- Suez SA
- 9-Tech Srl
- Soren (PV Cycle France)
- Envaris GmbH
- Iberia Solar Recycling (Endesa)
- REC Solar EMEA GmbH
- SMA Solar Technology AG
- Enel Green Power (3Sun recycling)
- Greenmet Solar
- Solarglass Recycling BV
- Norsk Solar Recycling AS
- Apellix Laser Ablation
Market Opportunities and Future Outlook
A near-term opportunity is the build-out of regional pre-processing and collection networks that reduce the high cost of moving bulky modules across borders, while still feeding centralized, high-purity refining. SolarPower Europe has advocated for measures that support a single European market for waste and smoother intra-EU shipments, which supports larger batch sizes and steadier plant utilization for recyclers that can coordinate multi-country logistics.
A second opportunity is scaling advanced recovery routes that unlock higher-value secondary raw materials, notably silicon and silver, and enable partnerships with downstream buyers in glass and metals. Recent industry moves point in this direction, including AGC Glass Europe partnering with SOLAR MATERIALS (October 2025) to incorporate high-purity recycled solar glass into float glass production. ROSI Solar also secured over EUR 20 million in Series B funding and grants (April 2026) tied to scaling capacity, including a 10,000-tonne-per-year facility in Teruel, Spain. Together, these actions support a shift from fee-only recycling toward integrated offtake-driven models where recovered fractions meet tighter quality requirements from industrial buyers and public-procurement recycled-content rules emerging under broader EU raw-material security priorities.
Recent Industry Developments in Europe Solar Panel Recycling Market
- April 2026: ROSI Solar secured over EUR 20 million in Series B funding and grants to scale PV recycling, including a 10,000 t/yr facility in Teruel, Spain. The investment expands Europe-wide PV recycling capacity and accelerates cross-border deployment of recycled materials.
- April 2026: ROSI Solar secured over EUR 20 million (approx. USD 23 million) in Series B funding and grants to scale photovoltaic recycling across Europe, including a new 10,000-tonne-per-year facility in Teruel, Spain. The funding expands capacity to recover higher fractions from end-of-life modules.
- March 2026: Veolia Recycling deployment of next-generation processing for electronic and battery waste with capacity expansion to 50,000 tons annually in Germany and France; continued 95% glass recovery in pilots. The upgrade broadens processing capabilities for PV related waste streams.
Europe Solar Panel Recycling Market Report Scope and Research Methodology
Market Definition and Coverage
For this report, the market covers paid services and processing revenues earned from collecting, transporting, treating, and recycling end-of-life solar PV panels within Europe, where value is recognized when panels enter an approved waste or recycling stream.
Scope exclusions: We exclude revenues from new panel manufacturing, resale of second-hand working modules, and non-PV electronic waste recycling that is not directly tied to PV panels.
Segments Covered in This Report
-
By Process
- Thermal
- Mechanical
- Laser
-
By Panel Type
- Crystalline Silicon
- Thin Film
-
By Shelf Life
- Normal Loss (Above 25 yr)
- Early Loss (Below 10 yr)
-
By Material Recovered
- Glass
- Silicon Wafers
- Silver
- Aluminium
- Other Metals (Cu, Indium, etc.)
-
By Geography
- United Kingdom
- France
- Italy
- Spain
- Netherlands
- Belgium
- Poland
- Sweden
- Norway
- Russia
- Rest of Europe
Data Sources, Market Sizing, and Validation
Desk Research
Desk research was used to build the policy and volume foundation for Europe, since end-of-life flows are strongly shaped by regulated collection and reporting. We leaned on public sources such as Eurostat waste and trade series, European Commission texts on WEEE, and national environment agencies that publish compliance and waste-handling guidance.
To translate PV deployment into future recycling demand, we also reviewed sources such as IEA PVPS publications, IRENA PV end-of-life work, and peer-reviewed studies on PV waste-stream scenarios and material composition. Company filings, investor presentations, association websites, and reputable press were then used to check processing capacity signals, typical service steps, and price direction for recovered materials. In some cases, paid subscriptions for company financials, patent databases, and shipment-level trade data were referenced to cross-check claims and close small gaps, and this list is illustrative rather than exhaustive because other sources were also used during data collection and clarification.
Primary Interviews and Surveys
Primary work was done through expert interviews and structured surveys with recyclers, waste-collection stakeholders, compliance specialists, and downstream material buyers, so assumptions could be tested against real operating practices. Because Europe is not one uniform system, we also checked differences in take-back coverage, treatment routes, and reporting discipline across major PV countries and smaller markets before locking model inputs.
Distribution of primary research fieldwork respondents
| Company type | Respondent position |
|---|---|
| Top tier: 39% | CXOs: 14% |
| Mid tier: 46% | Functional/Unit leaders: 29% |
| Smaller Players: 15% | Managers: 57% |
Market-Sizing & Forecasting
Sizing started with a top-down demand reconstruction based on Europe PV installed base trends and expected end-of-life flows, which were then filtered through WEEE-linked collection behavior and the share of panels that realistically enter formal recycling routes. Once the demand pool was set, the revenue model applied service steps (collection and logistics, dismantling, and material separation) using practical price points that were confirmed through interviews.
Key inputs used to keep the model market-specific included: annual PV waste volumes and their timing under normal-loss and early-loss patterns, the split between crystalline silicon and thin-film panels, average module weight and typical glass share, collection and recovery thresholds linked to WEEE compliance, and realized yields for valuable fractions such as aluminum frames and silver-bearing components. Bottom-up approximations were then used as a cross-check, mainly by sanity-testing totals against visible processing capacity and a sampled ASP x volume build for major routes, and gaps were handled by using conservative utilization ranges when facility-level throughput was not consistently disclosed.
Forecasting relied on scenario analysis supported by expert views on three drivers that swing revenues the most, namely PV retirements timing, the tightening of compliance enforcement, and recovered-material price direction. The final forecast path was adjusted only after the scenarios were reconciled to the same waste-flow logic and checked against practical constraints such as transport distance economics and plant ramp-up timing.
Data Validation & Update Cycle
Validation was done through several rounds of checks so outputs stayed consistent with real market signals. We compared modeled revenues to independent indicators such as reported PV waste collection volumes, recycling facility capacity announcements, and policy-driven recovery targets, and we investigated any outliers before sign-off.
When a large variance showed up, we rechecked unit conversions, currency timing, and the implied price per ton across process routes, then re-contacted sources if the assumption still looked weak. Reports are refreshed annually, with interim updates triggered by material events such as major regulation changes, large capacity additions, or sudden shifts in scrap pricing. Before delivery, a final analyst pass is completed so clients receive the most current view available.
Mordor Intelligence's Europe Solar Panel Recycling Market Size Compared Against Other Published Estimates
Published numbers for Europe solar panel recycling often do not match because the same activity can be counted in different ways, from what qualifies as recycling revenue to how much informal or delayed collection is assumed. Differences also come from how panel retirement timing is modeled, and whether the value of recovered materials is treated as part of the market or kept separate.
Eurostat-linked collection signals, WEEE recovery thresholds, and cross-checks against named processing capacity are the evidence used to keep Mordor Intelligence tied to panels that actually enter formal recycling streams, which reduces inflation from assumed waste that is not collected or is stored for later treatment.
Benchmark comparison
| Source | Market Size | Gaps in Research Methodology |
|---|---|---|
| Mordor Intelligence | USD 162.87 M (2025) | |
| Industry Association A | USD 135.00 M (2025) | Uses a narrower view of value capture that leans on compliance fees and reported collections, and it tends to undercount revenues from logistics, dismantling, and multi-step processing that sit outside a single stewardship program. |
| Trade Journal B | USD 210.00 M (2026) | Applies aggressive early-loss assumptions and a higher effective collection rate, and it also blends in higher recovered-material price uplifts without consistently checking those against realized yields and plant utilization limits. |
The table shows that the spread mostly comes from how waste inflows are timed and how much of the chain is counted as market revenue. By anchoring the model to observable collection and capacity signals, and then pricing the recycling steps with interview-validated ranges, the estimate stays traceable to simple variables that can be rechecked each update cycle.
Key Questions Answered in the Report
How large is the Europe solar panel recycling market in 2026?
The Europe solar panel recycling market size is estimated at USD 179.92 million in 2026, keeping pace with the 11.51% CAGR projected through 2031.
Which recycling process is growing fastest in Europe?
Laser-based delamination leads with a 16.9% CAGR because it achieves 95% glass purity and high-grade silver and silicon recovery.
Why is the United Kingdom the largest national market?
Stringent WEEE enforcement, dense rooftop installations, and ROSI Solar's nationwide collection partnership give the UK a 23.7% revenue share.
How do silver price swings affect recycler profitability?
Silver contributes up to 25% of recovered value, so price drops below USD 24/oz can wipe out margins unless firms hold hedging contracts or fixed-price refinery deals.
What role does the EU Critical Raw Materials Act play?
The Act channels EUR 400 million in grants and enforces a 15% recycled-content rule for publicly procured panels, ensuring steady demand for recovered silicon and silver.
Which companies are the current market leaders?
Veolia, Reiling, ROSI Solar, PV Cycle, and First Solar collectively hold 35-40% market share, leveraging integrated collection networks and proprietary technologies.