
Market Overview
| Study Period | 2021 - 2031 |
|---|---|
| Forecast Data Period | 2026 - 2031 |
| Base Year Market Size (2025) | 20.55 gigawatt |
| Market Volume (2026) | 22.67 gigawatt |
| Market Volume (2031) | 36.97 gigawatt |
| Growth Rate (2026 - 2031) | 10.29 % |
| Market Concentration | Medium |
Major Players *Disclaimer: Major Players sorted in no particular order Image © Mordor Intelligence. Reuse requires attribution under CC BY 4.0. | |
Greece Renewable Energy Market Analysis by Mordor Intelligence
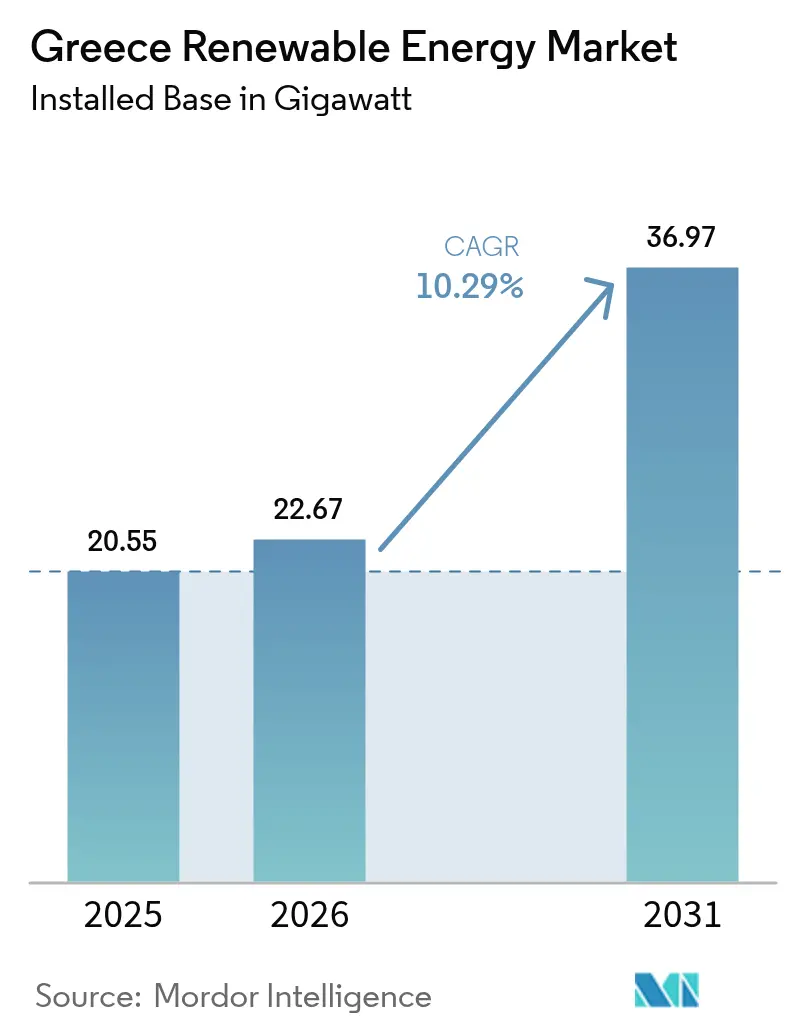
The Greece Renewable Energy Market size is expected to grow from 20.55 gigawatt in 2025 to 22.67 gigawatt in 2026 and is forecast to reach 36.97 gigawatt by 2031 at 10.29% CAGR over 2026-2031.
Solar technology retained 51.3% of capacity in 2024, while wind, hydropower, and fast-emerging geothermal resources are diversifying the generation mix. Falling utility-scale solar capital costs, accelerated offshore legislation, and EU-funded grid expansions are strengthening project fundamentals despite a higher cost-of-capital environment. Corporate power-purchase agreements are deepening demand from data-center operators and energy-intensive manufacturers, while HVDC export cables are unlocking cross-border revenue streams. Competitive positioning is evolving rapidly as large international utilities and sovereign investors consolidate portfolios and secure scarce grid-connection slots..[1]
Key Report Takeaways
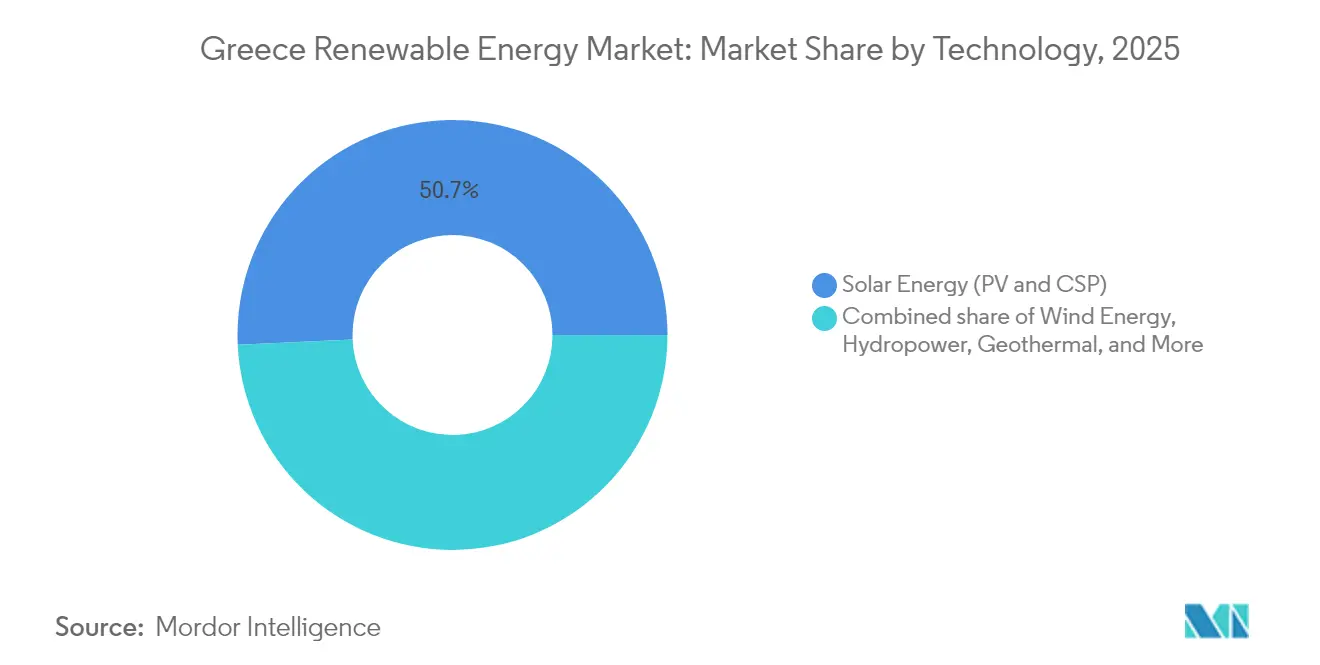
- By technology, solar retained 50.72% of the Greek renewable energy market share in 2025, whereas geothermal is forecast to post the fastest 78.46% CAGR through 2031.
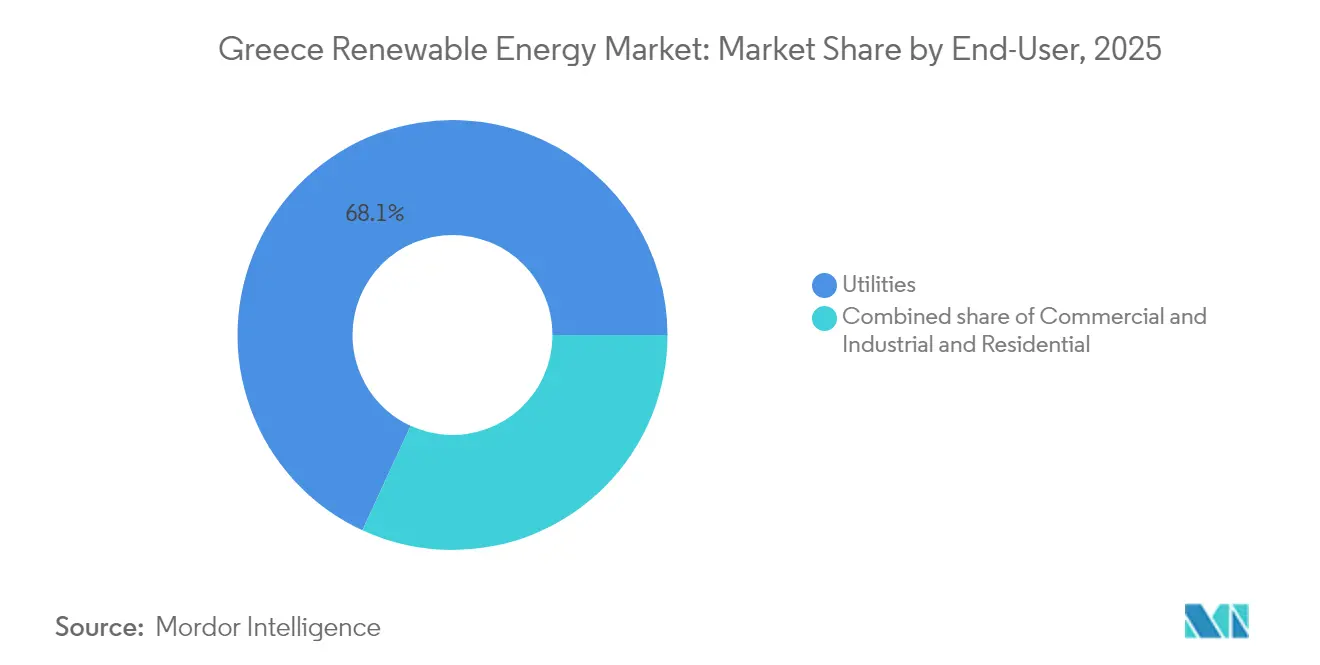
- By end-user, utilities commanded 68.12% of the Greek renewable energy market size in 2025, while commercial and industrial installations are projected to advance at a 10.62% CAGR to 2031.
Note: Market size and forecast figures in this report are generated using Mordor Intelligence’s proprietary estimation framework, updated with the latest available data and insights as of 2026.
Greece Renewable Energy Market Trends and Insights
Drivers Impact Analysis*
| Driver | (~) % Impact on CAGR Forecast | Geographic Relevance | Impact Timeline |
|---|---|---|---|
| Accelerated offshore wind legislation & 2 GW target | +2.1% | Aegean and Ionian priority zones | Medium term (2-4 years) |
| EU-funded grid and storage upgrades | +1.8% | Western Macedonia, Crete, Cyclades | Medium term (2-4 years) |
| Rapid decline in utility-scale solar CAPEX | +2.3% | Thessaly, Central Greece, Peloponnese | Short term (≤ 2 years) |
| Rise of corporate PPAs | +1.2% | Attica and Thessaloniki industrial clusters | Medium term (2-4 years) |
| Cross-Mediterranean export cables | +1.5% | Crete and mainland export hubs | Long term (≥ 4 years) |
| Pumped-hydro and battery tenders | +1.4% | Western Macedonia and island grids | Medium term (2-4 years) |
| Source: Mordor Intelligence | |||
Accelerated Offshore Wind Legislation & 2 GW Target by 2030
Greece enacted a comprehensive offshore wind framework in June 2024, setting a 2 GW deployment goal for 2030 and introducing streamlined licensing for floating platforms located in waters deeper than 50 meters. Priority development zones in the Aegean and Ionian Seas record average wind speeds above 8 m/s, positioning floating technology for high utilization factors.[2] International turbine suppliers quickly established Hellenic service hubs, enabling developers to sign grid connection agreements ahead of final investment decisions. The 2 GW target equates to nearly 6% of forecast capacity in 2030, yet its superior capacity factors promise outsized contributions to grid stability and export volumes.
EU-Funded Grid & Storage Upgrades Under REPowerEU/NECP
The European Commission allocated EUR 790 million in REPowerEU funding, and the European Investment Bank committed EUR 1.2 billion in loans to reinforce Greek transmission assets from 2024-2027. Projects include the Cyclades interconnection, which links seven islands to the mainland, and 400 kV substation upgrades in Western Macedonia. The National Energy and Climate Plan mandates 900 MW of new storage, split between pumped-hydro and lithium-ion batteries. Terna Energy’s 680 MW Amfilochia pumped-storage plant alone will supply 816 GWh of annual balancing energy, a critical buffer as thermal baseload retires.[3]
Rapid Decline in Utility-Scale Solar CAPEX
Utility-scale solar costs in Greece decreased by 48% between 2022 and 2023, to approximately USD 0.65/W, driven by module price deflation and efficient EPC practices on flat, high-irradiation sites.[4] Merchant projects now achieve levelized costs below EUR 40/MWh, beating natural-gas peakers. Lightsource bp’s 560 MW Enipeas solar complex, financed in April 2024, illustrates the robust bankability of large-scale solar without feed-in tariffs. Continued declines are expected as bifacial modules and single-axis trackers become more widely adopted, although land prices in prime zones are rising due to grid capacity scarcity.
Rise of Corporate PPAs from Greek Industrials & Data-Centers
Corporate renewable PPAs topped 1.5 GW of signed or advanced capacity in 2024. Amazon secured approximately 500 MW of wind power for its European data center network, underscoring the surging demand for hyperscale data centers. Aluminum, cement, and food-processing plants are locking in long-term PPAs to hedge wholesale price volatility that exceeded EUR 180/MWh during the 2024 winter gas crunch. The Regulatory Authority for Energy shortened PPA approval cycles to eight weeks, enabling direct contracts between generators and industrial offtakers. These developments underpin the double-digit growth outlook for the commercial and industrial segment.
Restraints Impact Analysis*
| Restraint | (~) % Impact on CAGR Forecast | Geographic Relevance | Impact Timeline |
|---|---|---|---|
| Regional permitting bottlenecks | −1.3% | Cyclades and forested mainland areas | Short term (≤ 2 years) |
| Grid hosting limits and curtailment risk | −1.1% | Island grids and Western Macedonia clusters | Medium term (2-4 years) |
| Community push-back on wind farms | −0.8% | Paros, Mykonos, Santorini, coastal Peloponnese | Medium term (2-4 years) |
| Higher post-2024 cost of capital | −1.2% | National, with sharper impact on merchant offshore | Short term (≤ 2 years) |
| Source: Mordor Intelligence | |||
Regional Permitting Bottlenecks Delaying Projects
Despite the availability of a digital one-stop licensing portal, environmental impact assessments, archaeological clearances, and grid studies still extend the average approval time to 18-24 months.[5] Staffing constraints at RAE left 800 connection requests pending in 2024, discouraging smaller developers. Tourism-driven Cyclades islands add local consultation layers that often end in municipal rejection, redirecting capital to faster-moving Balkan markets.
Grid Hosting Limits & Curtailment Risks
Island grids in Crete and Rhodes recorded curtailment rates exceeding 3% in 2024, as renewable energy injection outpaced local demand.[6] Crete–Attica and Cyclades interconnections will ease constraints from 2025 to 2026; however, Western Macedonia solar clusters already face midday voltage swings that demand reactive-power investments. Lenders apply 10-15% revenue haircuts in high-penetration zones, raising financing costs.
*Our forecasts treat driver/restraint impacts as directional, not additive. The impact forecasts reflect baseline growth, mix effects, and variable interactions.
Segment Analysis
By Technology: Solar Dominance Meets Geothermal Surge
Solar accounted for 50.72% of the country's capacity in 2025, underscoring the Greek renewable energy market's reliance on photovoltaics. Geothermal capacity, currently under 0.90%, is forecast to scale at an 78.46% CAGR, increasing the segment's share of the Greek renewable energy market to approximately 2.85% by 2031. Mytilineos is drilling a 50 MW plant on Milos, supported by EU Innovation Fund grants that showcase enhanced geothermal systems. Wind, including nascent offshore projects, accounted for approximately 34.83% of installations in 2025, and floating platforms are expected to deliver capacity factors above 45%. Hydropower, at 12.05%, is expected to expand through the 680 MW Amfilochia pumped-storage complex, scheduled for commissioning in 2027. Bioenergy and ocean technologies remain niche due to barriers related to feedstock and cost.
New solar plants benefit from low installed costs and generous irradiation. However, competition for substation capacity is intensifying, prompting developers to shift toward hybrid solar-plus-storage projects that capitalize on higher peak pricing. Geothermal growth relies on successful exploration in the volcanic arc, where heat gradients reach 200°C at economically viable drilling depths. Should resource mapping confirm the presence of commercial reservoirs, geothermal energy could provide a baseload output that complements intermittent solar and wind energy, thereby smoothing the Greek renewable energy market share across technologies.

By End-User: Utilities Lead, C&I Accelerates
Utilities controlled 68.12% of installations in 2025, illustrating the historical dominance of PPC Renewables, Terna Energy, and Mytilineos. Nonetheless, commercial and industrial offtakers are set to raise their share of the Greek renewable energy market, expanding at a 10.62% CAGR on the back of streamlined corporate PPAs and REC-indexed pricing. Amazon’s 500 MW wind contracts in 2024 and Microsoft’s ongoing data-center expansion reflect the decarbonization drive among global cloud providers. The residential segment, assisted by zero-interest Recovery Fund loans, now allows rooftop systems of up to 10 kW to operate without utility approval and is piloting virtual net-metering for apartment dwellers.
Utilities are pivoting toward hybrid solar-plus-storage on rehabilitated lignite sites, adding flex capabilities that position them competitively in balancing markets. Industrial offtakers view PPAs as a hedge against wholesale price volatility, while residential prosumers are reducing bills by exporting excess generation at regulated feed-in premiums. This diversification helps distribute the Greek renewable energy market share more evenly across end-user categories.
Geography Analysis
Mainland regions, Thessaly, Central Greece, and Western Macedonia, hosted 54.26% of the installed capacity in 2025, thanks to their strong grid backbones. The EUR 1.6 billion EU Just Transition Fund supports 2.5 GW of renewables on rehabilitated lignite mines, exemplified by RWE’s 450 MW Amynteo solar cluster that employs 300 local staff. Hydropower and wind in Evia and the Peloponnese balance seasonal solar peaks with steady Meltemi winds.
Island grids present both opportunity and challenge. Crete’s 1,000 MW Crete–Attica interconnection goes live in mid-2025, integrating the island’s 1.2 GW portfolio into mainland dispatch. Seven Cyclades islands will be connected by 2026, unlocking 400-500 MW of new renewable capacity and displacing diesel generation. Pilot microgrids on Astypalaia and Chalki demonstrate the viability of a 100% renewable supply complemented by storage and demand response.
Offshore zones in the Aegean and Ionian Seas are the next frontier for growth. Legislation adopted in 2024 earmarks 10,000 km² for floating platforms in water depths beyond 50 m. Terna Energy and Ocean Winds are advancing a 1.5 GW joint venture off Crete that uses semi-submersible foundations to minimize seabed impact. The Hellenic Navy and the Ministry of Maritime Affairs are finalizing spatial plans to deconflict fishing and shipping lanes, paving the way for 2-3 GW of additional capacity decisions in 2025-2027.
Regulatory Landscape
Greece’s renewable-energy permitting and market oversight sits under the Regulatory Authority for Energy, Waste and Water (RAAEY), which supervises licensing and competition alongside sector stakeholders involved in grid-connection and consumer protection. In May 2026, Greece enacted Law 5299/2026 (FEK A 67), modernizing the renewables framework by transposing RED III elements and introducing Renewable Energy Acceleration Areas (REAAs). The goal is to shorten development lead times through defined administrative timelines and, for eligible projects, potential relief from standard environmental permitting pathways.
Spatial planning is also tightening alongside acceleration measures. In May 2026, the Ministry of Environment and Energy opened public consultation (through June 24, 2026) on a draft Special Spatial Framework for Renewable Energy Sources that sets new siting restrictions for wind and solar in selected coastal, protected, and tourism-sensitive zones. This is pushing project strategy toward compliant zones and clearer land-use rules, while aiming to reduce conflict-driven delays.
Competitive Landscape
The top five operators, Terna Energy, PPC Renewables, Mytilineos, Motor Oil Renewables, and Enel Green Power, controlled nearly 60% of operational assets in 2024, yielding a moderate market concentration. Masdar’s EUR 3.2 billion purchase of 70% of Terna Energy positions the Abu Dhabi group to add 6 GW by 2029 and signals continued inbound investment. Mytilineos and PPC struck a EUR 2 billion solar partnership spanning Southeastern Europe, rotating mature Greek assets into PPC’s balance sheet and funneling proceeds into regional growth. RWE and PPC are co-developing 450 MW of solar energy with integrated battery storage on a former lignite mine.
Strategic differentiation is shifting toward storage integration, early grid access, and floating offshore intellectual property. Terna Energy locked a 35-year grid right for its 680 MW Amfilochia pumped-storage plant, while Lightsource bp leveraged BP’s balance sheet to finance 560 MW in Thessaly at competitive spreads. Mytilineos and Ocean Winds dominate patent activity in enhanced geothermal systems and floating foundations. As capital costs rise, well-capitalized incumbents are expected to widen their lead, although corporate PPAs offer a niche for agile developers willing to assume merchant exposure.
Greece Renewable Energy Industry Leaders
-
Terna Energy SA
-
PPC Renewables (PPC SA)
-
Mytilineos SA
-
Enel Green Power Hellas
-
Motor Oil Renewable Energy
- *Disclaimer: Major Players sorted in no particular order

Market Opportunities and Future Outlook
Large brownfield solar buildouts in former lignite regions, paired with co-located flexibility, remain the clearest whitespace theme, supported by the Western Macedonia transition pipeline and new permitting tools. PPC’s completion of a 2.13 GW solar PV portfolio in northern Greece (including the Phoebe plant and the Amyntaio complex) illustrates how rehabilitated mining land, combined with existing grid proximity, can enable utility-scale projects at speed. The Meton Energy (RWE-PPC) 930 MWp Amynteo cluster also reinforces how developers and EPCs can replicate this approach on mine land. With buildout activity concentrated in Western Macedonia, developers can target procurement and construction demand around substations, grid compliance, and reactive-power or curtailment-mitigation packages that are increasingly required in high-penetration zones.
Hybridization is another near-term opportunity as the market addresses grid-hosting limits and curtailment risk through storage-backed projects and portfolio optimization. MORE’s 72 MW/144 MWh battery projects reaching the final grid-connection phase indicates movement from awards toward commissioning activities. The METLEN and Tsakos partnership for a 251.9 MW PV plant paired with a 375 MWh storage system also points to growing C&I and developer appetite for integrated revenue stacking. On the policy side, Law 5299/2026 and the REAA concept, alongside the draft 2026 spatial framework consultation, create a clearer lane for projects aligned with designated acceleration areas and updated siting rules, favoring players that can secure compliant land positions and structure bankable grid-connection and dispatch strategies.
Recent Industry Developments
- July 2026: RWE and PPC completed the Meton Energy Amynteo solar cluster of 930 MWp in northern Greece, comprising multiple solar farms on former lignite-mine land. The commissioning reinforces Western Macedonia’s role as a utility-scale renewables hub and expands the pool of large, grid-connected assets competing for connection capacity and balancing resources.
- June 2026: PPC Renewables signed an agreement to acquire a portfolio from MORE (Motor Oil Renewable Energy) that includes about 1,175 MW of solar projects under development and 107.1 MW of operational wind capacity. The deal accelerates consolidation by shifting development pipelines and operating generation into a larger utility platform with greater access to capital and grid slots.
- April 2026: PPC Group announced completion of construction for a 2.13 GW photovoltaic portfolio in Western Macedonia, developed on former lignite mining sites in areas including Amyntaio and Ptolemaida. The completion adds scale to Greece’s solar pipeline and highlights the strategic reuse of brownfield land to reduce land-use friction while leveraging existing regional energy infrastructure.
Research Methodology Framework and Report Scope
Market Definition and Coverage
For this study, the Greece renewable energy market is defined as renewable power capacity that is installed and grid connected in Greece, measured in gigawatts (GW) across relevant renewable technologies.
Scope exclusions: We exclude fossil and nuclear generation, and we do not count behind the meter equipment unless it is captured as installed renewable generation capacity.
Segmentation Overview
- By Technology
- Solar Energy (PV and CSP)
- Wind Energy (Onshore and Offshore)
- Hydropower (Small, Large, PSH)
- Bioenergy
- Geothermal
- Ocean Energy (Tidal and Wave)
- By End-User
- Utilities
- Commercial and Industrial
- Residential
Data Sources, Market Sizing, and Validation
Desk Research
Desk research was used to build the starting data backbone for capacity, generation signals, and policy context in Greece, and then to keep the assumptions consistent across technologies. We referenced public sources such as Eurostat energy statistics, International Energy Agency data tables, IRENA capacity datasets, the European Commission and national energy and climate plan publications, and grid and market updates from Greek power sector institutions.
Along with these, we reviewed company annual reports, investor presentations, project press releases, and credible media coverage to track commissioning timelines and headline project sizes. A paid company financials and intelligence subscription and a patent database were used selectively to validate developer activity and to sense technology direction, especially where public disclosures were thin. These sources are illustrative only, and we checked many additional public documents to clarify data points, validate assumptions, and close small gaps.
Primary Interviews and Surveys
Interviews and surveys with Greece-based project developers, utilities, equipment and service providers, grid specialists, regulators, financiers, CXOs, functional leaders, and managers clarify commissioning dates, grid access, project pipelines, capacity utilization, curtailment, and expected additions. These responses are used to test secondary data and resolve gaps before the model is finalized.
Distribution of primary research fieldwork respondents
| Company type | Respondent position |
|---|---|
| Top tier: 27% | CXOs: 15% |
| Mid tier: 48% | Functional/Unit leaders: 33% |
| Smaller Players: 25% | Managers: 52% |
Market-Sizing & Forecasting
Sizing is built using a top-down reconstruction where national installed capacity series and technology-wise additions are used to form the total GW base, and then split using consistent technology definitions and commissioning timing. The total is corroborated with selective bottom-up checks, such as sampled project pipelines, developer-level rollups where disclosures exist, and sanity checks on typical project sizes and build rates, and then adjustments are made when the two views disagree.
Key inputs used in the model include annual installed capacity additions by technology, grid connection and curtailment signals, auction or PPA momentum as a demand pull indicator, permitting and interconnection lead times, and observed solar and wind build pace in recent years. Forecasting is driven through scenario analysis, where the base case is anchored on policy targets and grid constraints, and then sensitized using interview feedback on execution risk and financing comfort. Where a bottom-up view has missing data, we fill gaps with conservative ranges tied to historical commissioning conversion rather than counting every announced project at face value.
Data Validation & Update Cycle
Outputs are checked against independent signals such as total power sector capacity totals, public renewable share trends, and technology-wise additions reported in official statistics. Any sharp jumps are reviewed by re-checking inputs, re-running the model with alternate assumptions, and then revisiting the underlying source trail before final sign-off.
We refresh the model annually and also run interim checks when there are material policy, grid, or project pipeline shifts that can change the near-term trajectory. Before delivery, a final pass is completed so the shared view reflects the latest available public releases and confirmed market feedback.
Mordor Intelligence's Greece Renewable Energy Market Sizing Compared With Other Published Estimates
Published market sizes can look far apart because some studies measure value in USD revenue, while others measure physical build-out, and they also differ on what they count as renewable and when they count it. Differences also show up when one source assumes optimistic commissioning from the pipeline, while another only counts capacity after grid connection is visible.
In this study, the market is sized in installed capacity (GW), so estimates that focus on investment or electricity revenue will not line up year for year. The gap also widens when forecasts treat permitting backlogs and grid congestion differently, since those two factors directly change what can be commissioned within the forecast window, which is why the capacity-based view is kept separate here, including in the way it is refreshed and validated by Mordor Intelligence.
Benchmark comparison
| Source | Market Size | Gaps in Research Methodology |
|---|---|---|
| Mordor Intelligence | USD 20.55 B (2025) | |
| Global Consultancy A | USD 7.00 B (2023) | Uses revenue value for a broader energy equipment and services view, so it blends price and investment cycles rather than tracking installed, grid connected renewable capacity in GW. |
| Industry Publisher B | USD 10.20 B (2031) | Presents a value forecast that depends heavily on assumed capex and pricing paths, which can diverge even if physical capacity additions slow due to grid constraints. |
Looking across the table, most of the spread comes from mixing a capacity metric with value based reporting, and from how quickly projects are assumed to move from permits to grid connection. By keeping the unit consistent to installed GW and then cross checking against commissioning reality, the final series stays traceable to clear build-out drivers and can be repeated when new capacity data is released.
Key Questions Answered in the Report
How fast is renewable capacity in Greece expanding?
Installed capacity is forecast to rise from 22.67 GW in 2026 to 36.97 GW by 2031, equal to a 10.29% CAGR.
Which technology will grow the quickest by 2031?
Geothermal is projected to register an 78.46% CAGR, albeit from a small base of 30 MW.
What role do corporate PPAs play in new projects?
PPAs exceeding 1.5 GW are in negotiation or signed, enabling data-center operators and heavy industry to lock in long-term renewable supply.
How will new interconnectors affect the market?
The Greece–Egypt and Great Sea HVDC links will export surplus solar and wind, lowering curtailment risk and improving project bankability.
What storage capacity is being added?
RAE tendered 900 MW of storage in 2024, led by the 680 MW Amfilochia pumped-hydro plant and 300 MW of island batteries, to balance rising solar penetration.
Which regions attract the most new capacity?
Western Macedonia, Thessaly, and Central Greece lead due to grid strength and EU transition funds, while island grids gain once subsea links become operational.