Poland Data Center Rack Market Size and Share
Market Overview
| Study Period | 2020 - 2031 |
|---|---|
| Forecast Data Period | 2026 - 2031 |
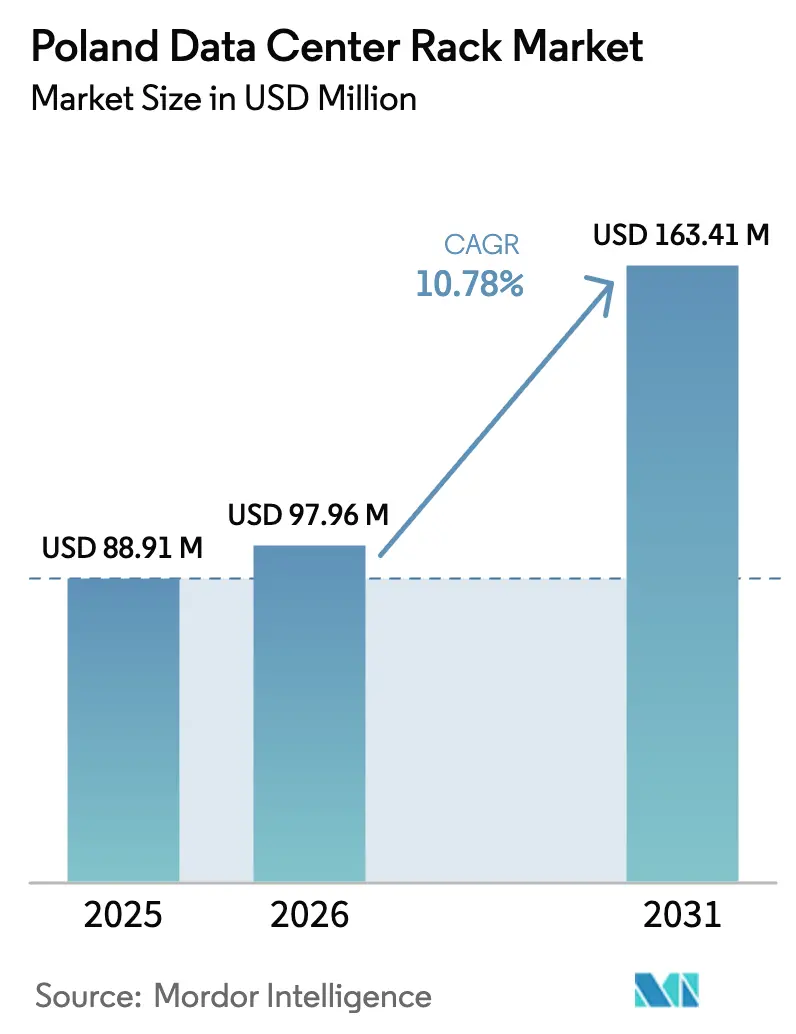
| Base Year Market Size (2025) | USD 88.91 Million |
| Market Size (2026) | USD 97.96 Million |
| Market Size (2031) | USD 163.41 Million |
| Growth Rate (2026 - 2031) | 10.78% CAGR |
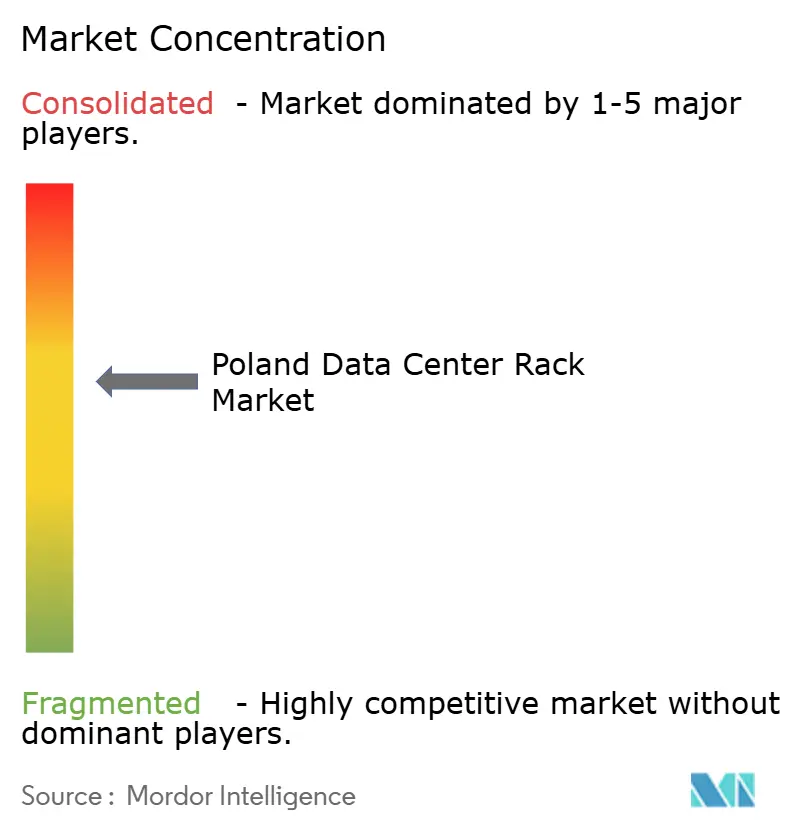
| Market Concentration | Medium |
Major Players *Disclaimer: Major Players sorted in no particular order Image © Mordor Intelligence. Reuse requires attribution under CC BY 4.0. | |
Poland Data Center Rack Market Analysis by Mordor Intelligence
The Poland data center rack market size was valued at USD 88.91 million in 2025 and is estimated to grow from USD 97.96 million in 2026 to reach USD 163.41 million by 2031, at a CAGR of 10.78% during the forecast period (2026-2031). Poland’s accelerated transition into a Central European digital-infrastructure hub rests on hyperscaler capital expenditure, sovereign-cloud mandates and energy-efficiency incentives. Microsoft’s PLN 2.8 billion (USD 704 million) Warsaw build-out, Google’s USD 2 billion cloud region, and Switch Datacenters’ EUR 720 million (USD 792 million) campus underline mounting demand for high-density racks that support AI training clusters. National installed capacity is on course to reach 1,200 megawatts by 2034, while rack densities are climbing from 10-15 kilowatts toward 40-100 kilowatts as enterprises pivot to edge-AI architectures. Competitive intensity remains moderate, with global operators vying against domestic providers, yet grid-capacity bottlenecks near Warsaw and an acute digital-skills gap continue to temper the expansion tempo.
Key Report Takeaways
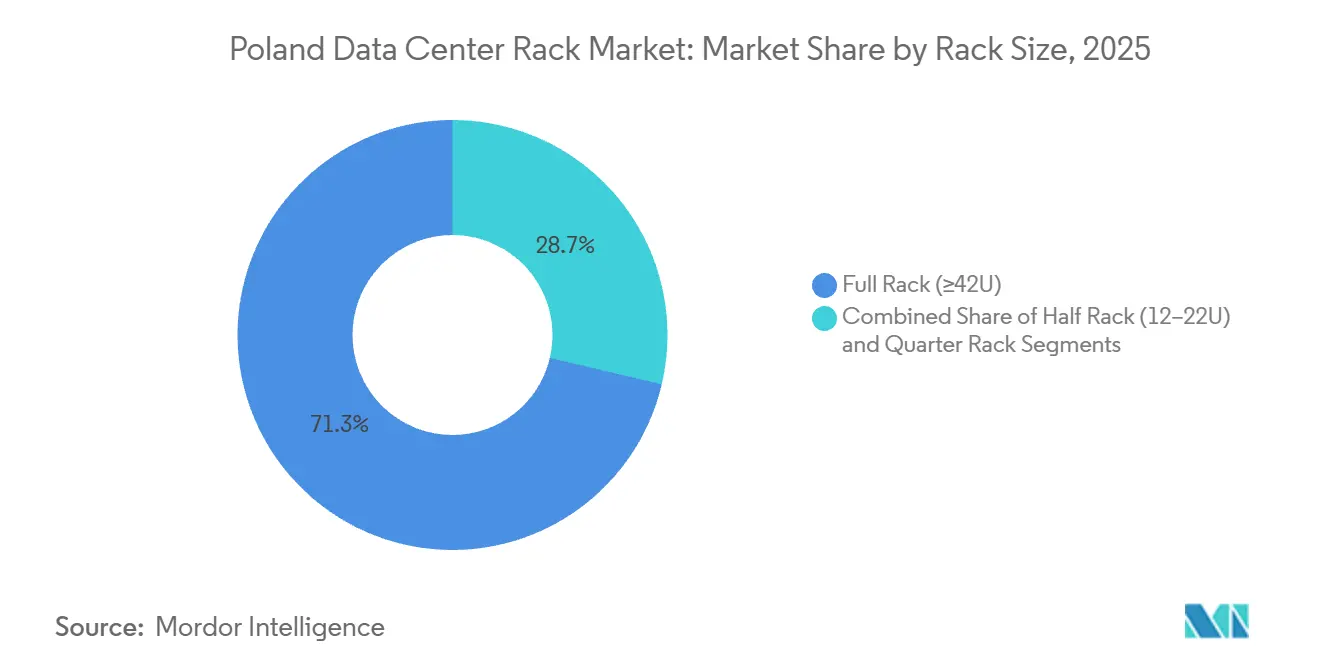
- By rack size, full rack configurations held 71.32% market share in 2025, whereas half rack units are forecast to expand at an 11.54% CAGR through 2031.
- By rack type, enclosed cabinet designs captured 75.33% of the Poland data center rack market share in 2025 and are projected to advance at an 11.46% CAGR to 2031.
- By tier classification, tier 3 facilities represented 53.21% of share in 2025, but tier 4 is the fastest-growing segment with an 11.62% CAGR over 2026-2031.
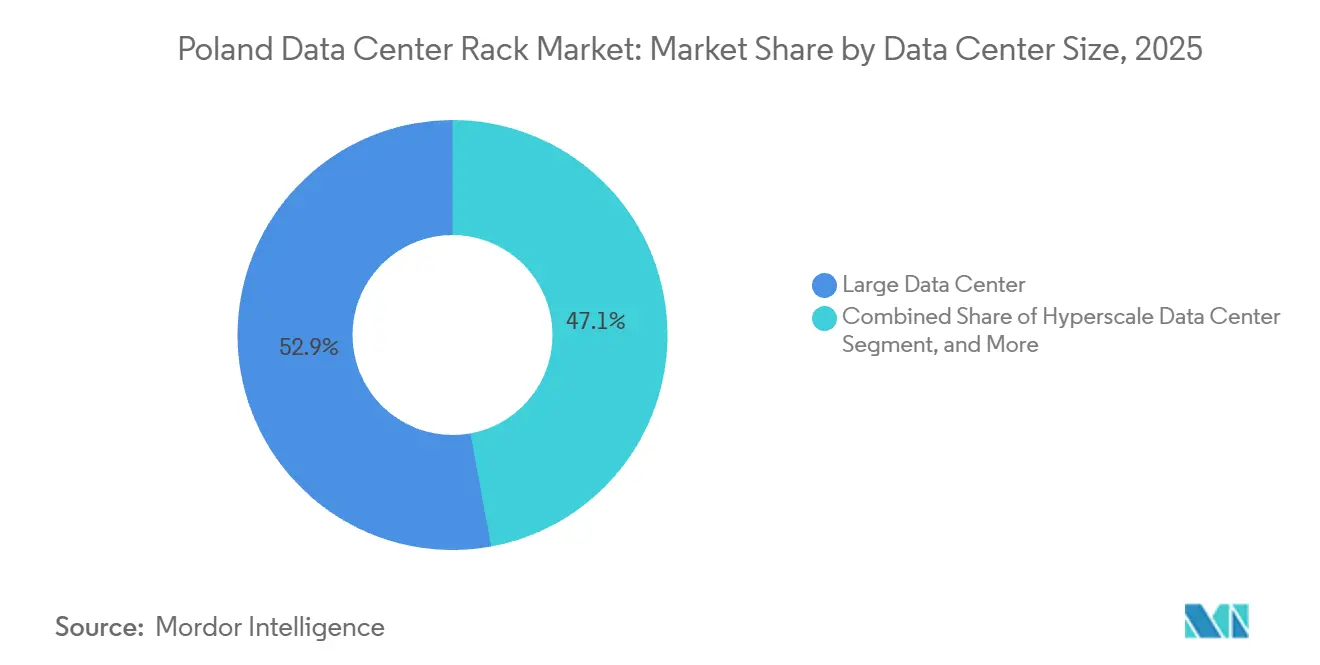
- By data-center size, large data centers accounted for 52.88% of the Poland data center rack market size in 2025, while hyperscale campuses lead growth at an 11.24% CAGR.
- By data-center type, colocation sites held 51.68% share in 2025, and hyperscalers data Center/CSPs are expanding at an 11.78% CAGR across the forecast horizon.
Note: Market size and forecast figures in this report are generated using Mordor Intelligence’s proprietary estimation framework, updated with the latest available data and insights as of January 2026.
Figures recorded within Poland feed into a worldwide estimate while studying the global industry. Mordor Intelligence's data center rack market size captures this aggregation.
Poland Data Center Rack Market Trends and Insights
Drivers Impact Analysis*
| Driver | (~) % Impact on CAGR Forecast | Geographic Relevance | Impact Timeline |
|---|---|---|---|
| EU Sovereign-Cloud Compliance Push | +2.8% | Poland, broader EU with spillover to CEE | Medium term (2-4 years) |
| Rapid Adoption of Cloud Services | +2.5% | Poland, with Warsaw as primary hub | Short term (≤ 2 years) |
| Edge-AI Workload Localisation | +2.2% | Poland, Warsaw and Krakow leading, expansion to Poznań | Medium term (2-4 years) |
| Accelerated Enterprise IT Outsourcing | +1.8% | Poland, national with concentration in Warsaw, Krakow, Wrocław | Short term (≤ 2 years) |
| Explosion in IoT and Smart-Device Data | +1.2% | Poland, lagging EU average but accelerating in urban centers | Long term (≥ 4 years) |
| National Energy-Efficiency Tax Incentives | +0.9% | Poland, national policy with regional implementation | Medium term (2-4 years) |
| Source: Mordor Intelligence | |||
EU Sovereign-Cloud Compliance Push
The General Data Protection Regulation, the Network and Information Systems Directive 2 and the Digital Operational Resilience Act require sensitive workloads to stay within EU borders, steering enterprises toward in-country Tier 3 and Tier 4 facilities that guarantee incident reporting and 24-hour response windows.[1]European Commission, “NIS2 Directive,” DIGITAL-STRATEGY.EC.EUROPA.EU Enforcement rigor is visible in the EUR 1.2 billion of GDPR penalties recorded in 2025, a level that persuades firms to migrate to operators with certified compliance frameworks.[2]DLA Piper, “GDPR Fines and Data Breach Survey 2025,” DLAPIPER.COM The trend amplifies demand for fault-tolerant rack environments that support granular access control, redundant power paths and continuous monitoring. Hyperscalers exploit this regulatory moat by locating new availability zones in Warsaw, enabling customers to satisfy data-residency clauses without building captive estates. Consequently, the Poland data center rack market is experiencing sustained uptake of enclosed cabinets fitted with biometric locks and environmental sensors.
Rapid Adoption of Cloud Services
Microsoft, Google and Switch Datacenters together earmarked more than USD 3.4 billion in Polish cloud infrastructure between 2024 and 2026, catalyzing immediate rack-installation cycles as soon as shell space becomes available. Cloud migration could add 4% to Poland’s GDP by 2030, propelling service-provider spending on high-density cabinets, busways and liquid-cooling manifolds. Latency-sensitive workloads, including real-time analytics and immersive retail, now require sub-20-millisecond round trips, encouraging operators to install micro-modular racks in urban aggregation nodes. Secondary-city campuses receive spillover demand once Warsaw’s grid allocation fills, ensuring steady order flow for rack manufacturers through the short-term horizon.
Edge-AI Workload Localisation
Training and inference clusters based on NVIDIA GB200 NVL72 draw roughly 120 kilowatts per rack, crossing the 40-50 kilowatt air-cooling limit and enforcing liquid-cooling adoption. Vertiv’s CEO confirms that markets such as India already operate 600-kilowatt units, a density Poland is expected to emulate once AI transparency rules under the EU AI Act push model training inside sovereign borders. Atman’s WAW-3 campus pre-installs direct-to-chip coolant loops to future-proof halls for such workloads.[3]Atman, “Atman WAW-3 Campus,” ATMAN.PL Edge-AI localisation also boosts Half Rack demand because micro-sites at factories, cell towers and smart-city kiosks require compact, self-contained enclosures that tolerate 30-50 kilowatts yet remain serviceable by two technicians.
Accelerated Enterprise IT Outsourcing
EU Directive 2023/1791 obliges member states to reduce final energy use by 11.7% by 2030, prompting enterprises to offload on-premises rooms in favor of colocation halls that already operate at PUE levels below 1.3. Poland’s Energy Efficiency Act sweetens the shift through tax credits tied to verified savings, directly linking operational expenditure with sustainability milestones. Orange Polska’s integration-services revenue rose 5% year-over-year in Q3 2025 as customers embraced managed colocation to counter limited in-house talent pools. Outsourcing thus translates into recurring rack orders that align with migration wavelets, minimising stranded capacity risk for operators.
Restraints Impact Analysis*
| Restraint | (~) % Impact on CAGR Forecast | Geographic Relevance | Impact Timeline |
|---|---|---|---|
| Rising Data-Security Breach Costs | -1.5% | Poland, EU-wide with GDPR and NIS2 enforcement | Short term (≤ 2 years) |
| Limited Skilled Labor Pool | -1.3% | Poland, national with acute shortages in Warsaw, Krakow, Wrocław | Medium term (2-4 years) |
| Grid-Capacity Bottlenecks Near Warsaw | -0.8% | Poland, concentrated in Warsaw metropolitan area | Medium term (2-4 years) |
| Surging Water-Usage Restrictions | -0.5% | Poland, national with regional enforcement | Long term (≥ 4 years) |
| Source: Mordor Intelligence | |||
Rising Data-Security Breach Costs
GDPR penalties reached EUR 1.2 billion in 2025, matching 2024 and lifting cumulative sanctions to EUR 7.1 billion. Daily breach notifications grew 22% year-over-year, highlighting adversaries’ focus on hybrid and edge nodes where security controls lag. Under NIS2, data-center managers shoulder personal liability and face fines up to EUR 10 million or 2% of turnover for non-conformance. Smaller operators must now fund 24-hour Security Operations Centers and zero-trust overlays, diluting capital available for capacity adds. Insurance premiums for cyber-liability coverage also escalate, making rack expansion decisions more cautious.
Limited Skilled Labor Pool
Only 44.3% of Poles possess basic digital skills, well below the EU’s 80% 2030 target. A European Commission foresight study cites 50% gaps in cybersecurity and 49% in data science across Poland, inflating wages and extending project timelines. Hyperscalers can import specialists or run boot camps, yet mid-tier colocation firms face talent shortages that hamper 24-hour operations and maintenance of liquid-cooling loops. Delays in commissioning staff-intensive Tier 4 modules compress revenue recognition and slow rack uptake in constrained labor markets.
*Our forecasts treat driver/restraint impacts as directional, not additive. The impact forecasts reflect baseline growth, mix effects, and variable interactions.
Segment Analysis
By Rack Size: Half-Rack Surge Driven by Edge Deployments
Half Rack units are forecast to outpace the broader Poland data center rack market with an 11.54% CAGR across 2026-2031, closing ground on Full Rack systems that dominated 71.32% of share in 2025. Operators favor Half Rack footprints for cell-tower, factory-floor and retail-edge pods where floor space is limited yet power budgets now stretch toward 50 kilowatts. JLL projects the global edge economy to reach USD 317 billion in 2026, a trajectory mirrored domestically as latency-sensitive services proliferate.
Full Rack cabinets still anchor hyperscale halls because consolidated 42U-48U frames simplify structured cabling and maximize square-foot output. Vertiv’s Liebert DSE liquid-cooling solution handles 100-kilowatt densities and is already specified for NVIDIA GB200 NVL72 clusters shipping to Warsaw in 2026. Quarter Rack enclosures remain niche, supporting smart-kiosk and branch-office rollouts, but the Poland data center rack market continues to diversify as edge-computing use cases multiply.


By Rack Type: Enclosed Cabinets Dominate on Security Mandates
Enclosed Cabinets controlled 75.33% share in 2025 and are expected to expand at an 11.46% CAGR through 2031. This growth is driven by NIS2 physical-security clauses that mandate controlled access, environmental sensing, and incident logging. Schneider Electric’s EcoStruxure platform embeds temperature and humidity probes at the cabinet level, enabling predictive maintenance and audit trails to minimize unplanned downtime.
Open-Frame racks persist within test labs and low-risk edge sheds where free airflow takes precedence over tamper resistance. Wall-mount micro-edge boxes fulfill retail and industrial automation needs under 5 kilowatts and often integrate Eaton’s 93PM UPS for short-duration backup. As enterprise outsourcing accelerates, enclosed cabinets become the de facto standard for Tier 3 and Tier 4 halls targeting financial and healthcare tenants, reinforcing their lead within the Poland data center rack market.
By Tier Type: Tier 4 Gains on AI Fault-Tolerance Demands
Tier 4 footprints are forecast to grow at 11.62% CAGR through 2031. This growth surpasses the overall Poland data center rack market as AI training clusters mandate 99.995% availability and 2N redundancy. The Uptime Institute notes more than 2,800 global certifications, with a rising share of Polish facilities seeking Tier 4 stamps to win sovereign-cloud contracts.
Tier 3 dominated the market with 53.21% of the market share in 2025, balancing N+1 economics against 99.982% uptime, yet single-fault exposure makes them less attractive for regulated workloads under DORA. Tier 1 and Tier 2 halls continue serving development and archival use cases where brief outages are acceptable. Atman’s WAW-3 campus illustrates a blended model, hosting both Tier 3 and Tier 4 rooms to match varied customer resilience appetites.
By Data Center Size: Hyperscale Facilities Lead Growth Trajectory
Hyperscale campuses, defined as exceeding 10 megawatts and 10,000 servers, are on track for an 11.24% CAGR over 2026-2031, outstripping Large Data Centers that held 52.88% of the Poland data center rack market size in 2025. Microsoft’s PLN 2.8 billion (USD 704 million) Warsaw expansion and Google’s USD 2 billion cloud region highlight operators’ pursuit of economies of scale in power procurement and renewable-energy sourcing. Switch Datacenters’ EUR 720 million (USD 792 million) Warsaw campus, engineered for 90 megawatts, is pairing liquid cooling with on-site solar arrays to push PUE toward 1.2, demonstrating how hyperscale design compresses operating costs. Surging AI workloads that demand 40-100 kilowatts per rack further reinforce the hyperscale model, allowing centralized thermal-management and high-density power trains to be amortized across thousands of cabinets.
Medium and Small Data Centers provide disaster-recovery topology and serve regional public-sector workloads that require national residency but not hyperscale density. The Poznań AI Campus targets 150 megawatts and leverages Baltic offshore wind to attract large-language-model training clusters, illustrating geographic diversification away from Warsaw’s congested grid. Secondary cities such as Krakow and Wrocław are now receiving grid-connection offers exceeding 100 megawatts, signaling that the ecosystem is maturing beyond the capital. Their land prices, often 30-40% lower than Warsaw levels, add a cost buffer that appeals to operators pursuing distributed, fault-tolerant topologies.
By Data Center Type: Hyperscalers and CSPs Capture Cloud Migration
Hyperscalers Data Center/CSPs will register an 11.78% CAGR, the fastest across data-center types, as enterprises retire aging server rooms to meet energy and security mandates. Schneider Electric logged 1.5 gigawatts of AI data-center orders in 2025, largely from CSPs adopting prefabricated modules that cut build times by 60%. Operators are also packaging confidential-computing enclaves and zero-carbon power-purchase agreements into these campuses, satisfying both regulatory and ESG scorecards. The ability to bolt on prefabricated power blocks lets cloud providers stage capacity in nine-month sprints that track unpredictable AI demand curves.
Colocation halls, which claimed 51.68% market share in 2025, remain pivotal for mid-sized firms and agencies that need dedicated cages without full hyperscale overhead. Orange Polska’s managed-services growth underlines colocation relevance for customers lacking in-house digital skills. Domestic software houses increasingly colocate testing sandboxes in the same halls to minimize data-gravity penalties. As Poland approaches 500 megawatts of installed capacity by 2030, colocation vendors are differentiating through bundled managed security and compliance reporting that map directly to NIS2 evidence requirements. Edge pods continue to emerge along 5G corridors, integrating Half Rack cabinets for latency-critical inference tasks, widening the overall customer base for rack vendors in Poland.
Geography Analysis
Warsaw hosts roughly 30 operational facilities and anchors the Poland data center rack market, yet transmission-system operator PSE has already received 500-1,000 megawatt interconnection requests that challenge existing substations. Developers therefore pivot toward Krakow, Wrocław and Poznań, where land prices sit 30-40% below Warsaw and grid headroom is still available. Cisco’s Krakow build, scheduled for mid-2026 hand-over, positions the southern corridor as a viable alternative for cross-border workloads serving Slovakia and the Czech Republic.
Poznań leverages proximity to German industrial clusters and renewable-energy inflows from Baltic offshore wind farms, underpinning the 150-megawatt AI campus announced in 2025. EdgeConneX’s Warsaw-4 project combines hyperscale and edge suites, signaling operator appetite for hybrid footprints that distribute inference nodes closer to consumers while centralizing training jobs. EU energy-efficiency legislation steers new builds toward free-cooling compatible climates, a factor that favors coastal and high-altitude sites across northern and southern Poland.
Secondary cities such as Łódź, Gdańsk and Katowice now attract disaster-recovery suites as enterprises seek geographic redundancy inside national borders. HOSTKEY’s Tier II+ LIM DC site in Warsaw illustrates the modular approach where operators deploy 2.5-megawatt increments to match demand rather than risk stranded capacity. The national objective of 1,200 megawatts by 2034 remains feasible provided grid reinforcements align with the European Data Centre Association’s EUR 176 billion continental investment roadmap.
Mordor Intelligence evaluates the data center rack market across all key regional markets, including Europe, Middle East, and South America, with deeper country-level insights covering Italy, Germany, Saudi Arabia, Brazil, France, and Thailand.
Competitive Landscape
Global colocation giants Equinix, Data4, EdgeConneX and Vantage compete with domestic incumbents Atman, Beyond.pl, Netia and Orange Polska, creating a moderately fragmented arena. Schneider Electric shipped integrated power and cooling systems totaling 1.5 gigawatts in 2025, leveraging its EcoStruxure digital twin suite to compress project delivery windows to under nine months. Vertiv’s thermal-management revenue jumped 35% year-over-year to USD 2.9 billion on surging demand for direct-to-chip liquid-cooling loops that handle racks above 100 kilowatts. Rittal and Eaton are widening competitive intensity by introducing prefabricated micro-data-center pods that can be installed curbside in eight weeks, giving smaller Polish service providers a fast-track route into edge markets. Private-equity funds, attracted by power-purchase-agreement-backed cash flows, have begun scouting secondary-city campuses, signaling that consolidation rounds could accelerate over the next 12-24 months.
Atman’s PLN 1.35 billion WAW-3 campus exemplifies domestic operators’ pivot toward Tier 4 modules and liquid-cooling readiness, positioning the firm for AI training tenants that will drive premium rack demand. Meanwhile, Switch Datacenters and the Poznań AI Campus aim to bypass Warsaw’s grid constraints by deploying hyperscale plots in under-utilized corridors, challenging incumbent market shares. Data4’s recent land-banking near Łódź and Vantage’s commitment to a 20-megawatt Krakow facility indicate that secondary clusters are now integral to national rollout plans, rather than stop-gap redundancy nodes. Growing interest from automotive OEMs looking to host autonomous-vehicle telemetry inside Poland further broadens the tenant mix and intensifies the scramble for permits along high-capacity transmission lines.
Equipment vendors Dell Technologies and HPE enjoy double-digit growth in AI-optimized servers, funneling high-density chassis into both hyperscale and enterprise edge projects. Insurance carriers now price cyber-liability premiums based on NIS2 compliance, incentivizing operators to upgrade security appliances and monitoring kits, which indirectly raises demand for smart-rack PDUs and sensor arrays across the Poland data center rack market. nVent and Panduit are capitalizing on this shift by embedding tamper-evident fiber trunks and biometric access modules inside their newest cabinets, turning physical infrastructure into a frontline security layer. Rising circular-economy mandates are also prompting vendors to design racks with tool-less, reusable aluminum frames, creating a residual-value stream that improves total cost of ownership for operators focused on sustainability scorecards.
Poland Data Center Rack Industry Leaders
Atman Sp. z o.o.
Orange Polska S.A.
Equinix Inc.
Beyond.pl Sp. z o.o.
Netia S.A.
- *Disclaimer: Major Players sorted in no particular order

Recent Industry Developments
- February 2026: Nokia and Telefónica España completed a nationwide edge network achieving sub-10-millisecond latency, showcasing reference architecture for distributed data-center racks.
- January 2026: DLA Piper confirmed EUR 1.2 billion in GDPR fines during 2025, underscoring regulatory pressure on data-center compliance budgets.
- December 2025: Vertiv posted 18% year-over-year revenue growth in Q4 2025, lifting thermal-management sales to USD 2.9 billion for the year.
- November 2025: Dell Technologies reported Q3 FY2026 Infrastructure Solutions Group revenue of USD 11.4 billion, a 34% surge driven by AI servers.


Research Methodology Framework and Report Scope
Market Definitions and Key Coverage
Our study views the Poland data center rack market as the annual value of newly manufactured steel or aluminum enclosures that hold servers, storage, and network gear inside purpose-built enterprise, colocation, edge, and hyperscale facilities. All form factors from quarter to full racks and both open-frame and cabinet designs are counted, expressed in USD at factory-gate prices.
Scope Exclusion: Telecom closets used in office buildings and retrofit containment add-ons were kept outside the scope because their buying drivers and pricing differ markedly.
Segmentation Overview
- By Rack Size
- Quarter Rack (More than 11U)
- Half Rack (12-22U)
- Full Rack (≥42U)
- By Rack Type
- Enclosed Cabinet
- Open-Frame
- Wall-Mount and Micro-Edge Enclosure
- By Tier Type
- Tier 1 and 2
- Tier 3
- Tier 4
- By Data Center Size
- Small Data Center
- Medium Data Center
- Large Data Center
- Hyperscale Data Center
- By Data Center Type
- Colocation Data Center
- Hyperscalers Data Center/CSPs
- Enterprise and Edge Data Center
Detailed Research Methodology and Data Validation
Primary Research
Our team held interviews with colocation operators, rack integrators, and power-distribution specialists across Warsaw, Krakow, and Wroclaw. We then followed up with CIO surveys that revealed preferred rack heights, lead-time pain points, and expected price corridors. These conversations helped us confirm secondary findings and patch data gaps.
Desk Research
We pulled macro cues from Glowny Urzad Statystyczny, Eurostat, ENTSO-E power data, and the Office of Electronic Communications to gauge electricity tariffs, fiber reach, and cloud uptake. Shipment clues came from customs dashboards and Questel patent analytics, while Dow Jones Factiva and local trade press traced hyperscale build announcements. Company 10-Ks, investor decks, and notes from the Polish Chamber of Information Technology rounded out the picture. The sources named are illustrative only, and many further open datasets informed validation.
Market-Sizing & Forecasting
We began with a top-down reconstruction that multiplies installed IT load by average kilowatts per rack and by blended rack selling prices. These are then cross-checked with bottom-up supplier shipment samples and channel checks. Key variables feeding the multivariate regression include hyperscale capex pipelines, grid connection queues, average rack density, enterprise cloud spending, and steel cost indices. Scenario analysis covers currency shifts and energy-price shocks, and any missing shipment data is bridged through verified purchase-order extrapolation.
Data Validation & Update Cycle
Each model pass undergoes peer review; anomaly flags trigger re-contact with sources, and outputs are compared with independent trade and customs data. Mordor refreshes the model annually and issues interim updates when large campus announcements or regulatory moves alter demand assumptions. A final analyst sweep ensures clients get the freshest baseline.
Why Mordor's Poland Data Center Rack Baseline Commands Reliability
Published numbers often diverge because firms choose different rack mixes, price bases, and forecast horizons. By anchoring on verified IT-load metrics and refreshing assumptions yearly, Mordor Intelligence offers figures stakeholders can trace back to clear drivers.
Key gap drivers include: some publishers fold installation services into hardware totals, others lift Western Europe price points into Poland, and a few project aggressive hyperscale scenarios without accounting for local grid constraints.
Benchmark comparison
| Market Size | Anonymized source | Primary gap driver |
|---|---|---|
| USD 88.91 million (2025) | Mordor Intelligence | - |
| USD 380 million (2024) | Regional Consultancy A | Service revenue blended and Western Europe ASPs applied |
| USD 250 million (2024) | Global Consultancy B | Constant 15 kW-per-rack assumption ignores enterprise self-build share |
The comparison shows that our disciplined scope choices, multi-layer triangulation, and timely refresh cadence give decision makers a balanced, transparent baseline they can rely on.


Key Questions Answered in the Report
What is the forecast revenue for racks installed in Polish data centers by 2031?
The Poland data center rack market size is expected to reach USD 163.41 million by 2031.
Which rack configuration is expanding the fastest through 2031?
Half Rack units are projected to grow at an 11.54% CAGR, outpacing other sizes.
Why are enclosed cabinets preferred over open-frame racks in Poland?
NIS2 security requirements and enterprise demand for lockable, climate-controlled enclosures drive the preference for enclosed cabinets.
How will Tier 4 facilities influence future rack demand?
AI and financial workloads needing 99.995% uptime fuel Tier 4 builds, lifting demand for high-density, fully redundant racks.
Which cities outside Warsaw are emerging for new data-center capacity?
Krakow, Wrocław and Poznań are attracting projects due to available grid capacity and lower land costs.
What is the main challenge slowing rack deployments in Warsaw?
Grid-capacity bottlenecks, with interconnection requests exceeding current substation limits, are constraining new builds in the capital.
Page last updated on:


