New Zealand Data Center Rack Market Size and Share
Market Overview
| Study Period | 2020 - 2031 |
|---|---|
| Forecast Data Period | 2026 - 2031 |
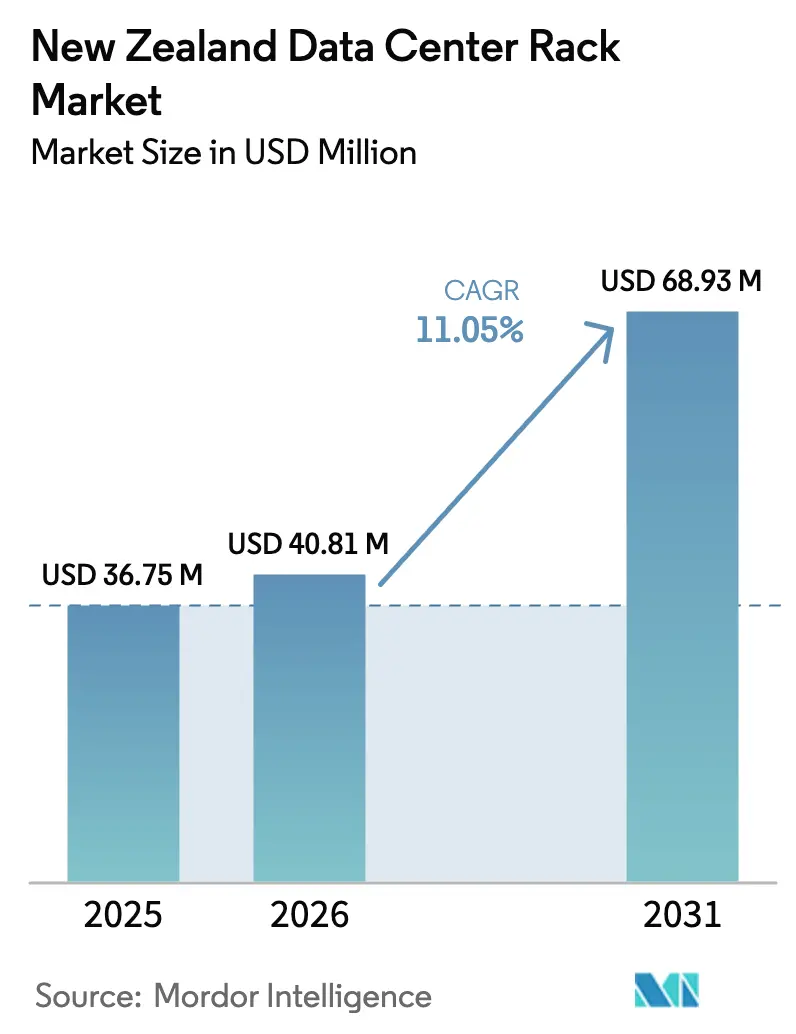
| Base Year Market Size (2025) | USD 36.75 Million |
| Market Size (2026) | USD 40.81 Million |
| Market Size (2031) | USD 68.93 Million |
| Growth Rate (2026 - 2031) | 11.05% CAGR |
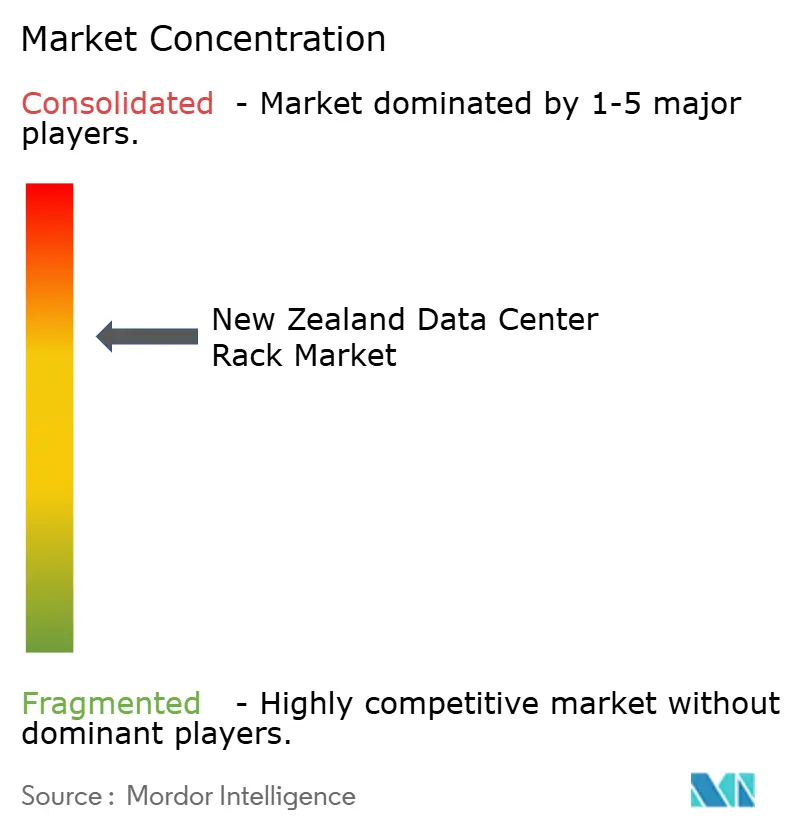
| Market Concentration | Medium |
Major Players *Disclaimer: Major Players sorted in no particular order Image © Mordor Intelligence. Reuse requires attribution under CC BY 4.0. | |
New Zealand Data Center Rack Market Analysis by Mordor Intelligence
The New Zealand data center rack market size is expected to grow from USD 36.75 million in 2025 to USD 40.81 million in 2026 and is forecast to reach USD 68.93 million by 2031 at 11.05% CAGR over 2026-2031. Heightened hyperscale commitments from Microsoft and AWS, sustained submarine-cable investments, and expanding 5G coverage collectively elevate rack demand. Growth also stems from public-sector projects such as the Government Communications Security Bureau’s sovereign facility, which strengthens data-sovereignty compliance and stimulates procurement of seismic-compliant racks. Meanwhile, nationwide carbon-neutral mandates propel the adoption of energy-efficient cabinet solutions, and renewable power availability enhances the country’s attraction for sustainable data center deployments. Racks that accommodate AI-ready power densities and liquid-cooling loops are becoming mainstream, and operators increasingly specify ruggedized form factors for edge sites serving 5G and remote renewables.
Key Report Takeaways
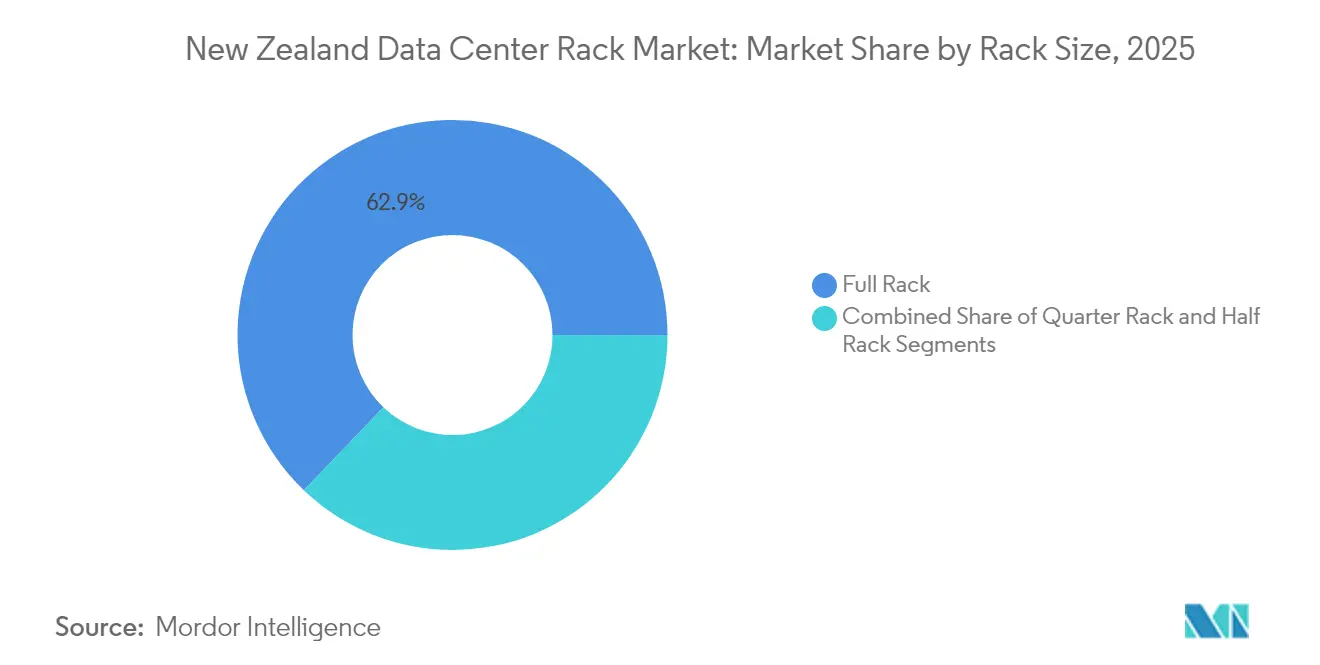
- By rack size, Full Rack solutions commanded 62.85% of New Zealand data center rack market share in 2025, while Quarter Rack deployments trailed but address edge use cases.
- By rack height, 42U maintained 50.65% share of New Zealand data center rack market size in 2025; 48U units are growing fastest at a 12.1% CAGR to 2031.
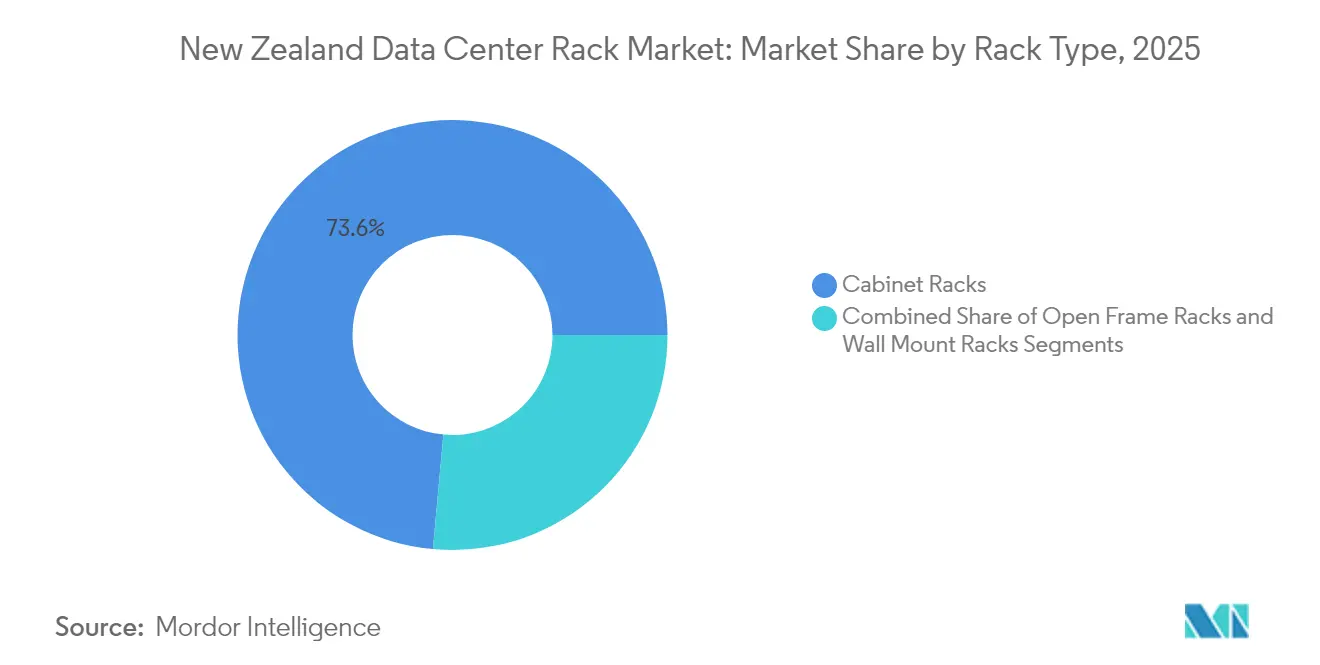
- By rack type, Cabinet formats led with a 73.55% revenue share in 2025, and their category is forecast to expand at 12.84% CAGR through 2031.
- By data-center type, Colocation facilities held 53.85% of New Zealand data center rack market size in 2025, but Hyperscale and CSP sites post the highest 13.02% CAGR to 2031.
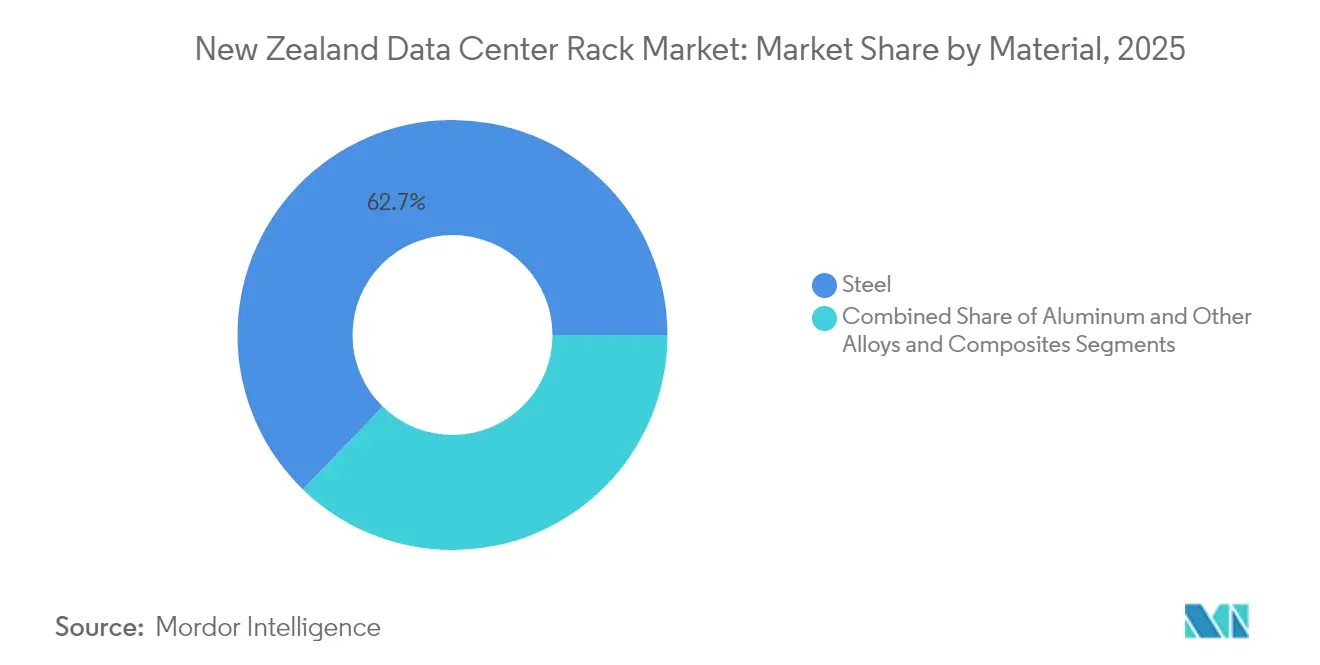
- By material, Steel accounted for 62.75% share in 2025, whereas Aluminum racks exhibit an 11.06% CAGR due to weight and thermal benefits through 2031.
Note: Market size and forecast figures in this report are generated using Mordor Intelligence’s proprietary estimation framework, updated with the latest available data and insights as of 2026.
Global valuation is assembled from multiple country-level and regional contributions, with New zealand representing one of those inputs. The data center rack market size in our global report represents that cumulative total.
New Zealand Data Center Rack Market Trends and Insights
Drivers Impact Analysis*
| Driver | (~) % Impact on CAGR Forecast | Geographic Relevance | Impact Timeline |
|---|---|---|---|
| Rising dominance of 5G networks | +2.1% | National, with early gains in Auckland, Wellington, Christchurch | Medium term (2-4 years) |
| Expansion of fibre-optic backbone connectivity | +1.8% | National, concentrated in urban centers and submarine landing points | Long term (≥ 4 years) |
| Accelerating cloud & hyperscale investments | +2.7% | Auckland-centric, expanding to regional centers | Short term (≤ 2 years) |
| Government "Zero-Carbon 2050" push for energy-efficient racks | +1.4% | National, with South Island renewable energy advantages | Long term (≥ 4 years) |
| Edge-computing demand from remote renewables and IoT sites | +1.6% | Rural and remote areas, renewable energy sites | Medium term (2-4 years) |
| New international submarine-cable landings spurring DC build-outs | +2.2% | Coastal landing points, Auckland, Wellington | Medium term (2-4 years) |
| Source: Mordor Intelligence | |||
Rising Dominance of 5G Networks
Nationwide 5G rollout accelerates distributed computing, requiring compact racks for cell-site edge nodes. Spark’s Nokia partnership across 700 towers exemplifies this shift, while Auckland Airport’s private 5G showcases ultra-low-latency use cases.[1]Reseller News Editors, “Spark selects Nokia for 5G network expansion,” reseller.co.nzSpectrum allocations in the 3.5 GHz and upcoming 24-30 GHz bands extend coverage into rural zones, prompting demand for weather-resistant enclosures. Operators now prefer factory-sealed cabinet designs that support redundant power feeds and filtered ventilation to withstand remote environments. This evolution differentiates the New Zealand data center rack market from traditional centralized models and sustains a premium for ruggedized solutions.
Expansion of Fibre-Optic Backbone Connectivity
The Southern Cross NEXT and forthcoming Te Waipounamu cables amplify international capacity and lower latency, spurring rack upgrades in coastal data centers. Direct South Island–Australia connectivity fosters regional hosting, encouraging taller racks that pack more servers per square meter to monetize new bandwidth paths. Enhanced redundancy positions New Zealand as an Asia-Pacific interconnect node, bolstering investor confidence in high-density deployments. Data center operators respond with 48U cabinets that handle hotter exhaust temperatures yet maintain seismic compliance, securing a scalable footprint for emerging AI workloads.
Accelerating Cloud and Hyperscale Investments
Microsoft’s hyperscale region and AWS’s USD 7.5 billion programme compress build timelines, pushing standardization on 42U and 48U cabinets with pre-installed busbars and liquid-ready manifolds.[2]National Cyber Security Centre, “Annual Cyber Threat Report 2023,” ncsc.govt.nzLocal telco Spark counters with a NZD 15 million edge facility, signalling multicloud ecosystems that blend centralized and regional capacity. Intensifying competition lifts order volumes for full-depth steel racks able to house multi-node GPU clusters. Deloitte estimates that data centers could consume 7% of national electricity by 2030, reinforcing the preference for racks that integrate granular power monitoring and containment accessories to sustain PUE targets.
Government “Zero-Carbon 2050” Push for Energy-Efficient Racks
The Carbon-Neutral Government Programme forces agencies to cut emissions, driving procurement of cabinets compatible with liquid cooling and renewable integrations.[3] Operators now specify aluminum or low-carbon steel frames to reduce embodied emissions. Vendors differentiate through in-rack heat-recovery coils and sensor arrays that feed ESG dashboards, a capability prized by hyperscalers under 24×7 carbon-free energy commitments. South Island sites leveraging 100% hydro and wind supply gain visibility among international investors, amplifying regional diversification.
Restraints Impact Analysis*
| Restraint | (~)% Impact on CAGR Forecast | Geographic Relevance | Impact Timeline |
|---|---|---|---|
| Escalating cybersecurity & ransomware risks | -1.8% | National, with higher impact on government and financial sectors | Short term (≤ 2 years) |
| Shortage of local data-center skillsets | -1.4% | National, acute in Auckland and Wellington | Medium term (2-4 years) |
| High national electricity tariffs | -1.1% | National, with regional variations | Long term (≥ 4 years) |
| Seismic-compliance cost for rack installations in quake zones | -0.9% | High and medium seismic risk areas, primarily North Island | Long term (≥ 4 years) |
| Source: Mordor Intelligence | |||
Escalating Cybersecurity & Ransomware Risks
Three hundred-plus critical incidents in 2022/23 highlight rising cyber exposure. Higher security expectations translate into closed-cabinet preferences with locking side panels, tamper sensors and segmented cable troughs.Colocation tenants demand multi-factor cage access and camera-ready enclosures, elevating specification costs. While new tools like the Malware Free Networks service mitigate threats, insurance underwriters now scrutinize physical security ratings, discouraging open-frame rack adoption in sensitive workloads and moderating market expansion.
Shortage of Local Data-Center Skillsets
New Zealand needs 4,000-5,000 additional technology professionals annually, but graduations lag requirements. Scarce expertise in liquid cooling, high-density power wiring and seismic anchoring forces operators to import labour or prolong deployment cycles. Smaller enterprises hesitate to refresh legacy racks, slowing addressable demand. Training schemes such as Mission Ready help, yet upskilling timelines extend beyond immediate project horizons, constraining near-term shipment growth in the New Zealand data center rack market.
*Our forecasts treat driver/restraint impacts as directional, not additive. The impact forecasts reflect baseline growth, mix effects, and variable interactions.
Segment Analysis
By Rack Size: Hyperscale Standardization Anchors Full-Rack Supremacy
Full Rack cabinets dominated at 62.85% New Zealand data center rack market share in 2025, reflecting hyperscalers’ preference for 600 mm×1,200 mm 42U footprints that streamline supply chains. Quarter and Half Racks cater to edge and enterprise niches where space, power, or budget restrict full-height units. Over 2026-2031, Full Rack demand scales in tandem with the overall New Zealand data center rack market, projected at an 11.34% clip as cloud tenants consolidate workloads into denser cabinets.
Operators also explore nine-foot (48U) variants when ceiling height permits. These units improve kW-per-footprint metrics, reduce white-space leasing costs, and align with AI training cluster designs. Quarter Rack deployments remain pivotal for 5G micro-edge sites and IoT gateways situated at base stations or renewable plants, though their aggregate contribution to the New Zealand data center rack market size stays modest. Vendors position modular accessories—busway extensions, blanking panels, cable lacing bars—to offer growth paths within the same footprint.


By Rack Height: 48U Configurations Lead Density Drive
The 42U format held 50.65% of New Zealand data center rack market size in 2025 due to entrenched telecom standards. Yet 48U units deliver the highest 12.1% CAGR through 2031, feeding appetites for GPU-dense nodes requiring vertically stacked servers. Taller frames also amortize floor costs as land values in Auckland rise.
Engineering consultancies adapt anchoring kits to meet NZS 4219 seismic guidelines, ensuring stability without footprint penalties. Meanwhile, custom ≥52U racks target experimental liquid-immersion pods or extra-high OCP sleds. Such formats introduce new thermal gradients, prompting active rear-door heat exchangers and chilled-water loop integration that elevate procurement value per rack in the New Zealand data center rack market.
By Rack Type: Cabinets Strengthen Security and Thermal Control
Cabinet solutions captured a 73.55% share in 2025 and are forecast for 12.84% CAGR, buoyed by surge in multi-tenant footprints where airflow containment and access control are vital. Closed designs enable cold-aisle isolation, door-mounted sensors and side-panel locks that satisfy PSA and ISO 27001 audits. Open-frame racks persist in non-production labs and high-airflow HPC pods but face security caveats.
Wall-mount racks underpin rural edge nodes and telco roadside huts, integrating shallow depths and convection vents. Cabinet vendors now embed brush strips, high-CFM top fans and micro-PDU rails that support AI-grade loads. Immersion-ready versions arrive pre-coated for dielectric fluid tolerance, preserving structural rigidity across temperature swings crucial to New Zealand’s seismic zones.
By Data Center Type: Colocation Holds Ground While Hyperscale Surges
Colocation operators maintained 53.85% of New Zealand data center rack market size in 2025, supplying compliance-ready floorspace to banks and government agencies. Hyperscalers lead future growth at 13.02% CAGR as Microsoft and AWS complete Auckland campuses that each exceed 30 MW phases. Their reference designs specify uniform full-rack rows, centralized busway channels, and liquid-ready manifolds that elevate dollar-value per unit sold.
Edge and enterprise sites address latency-sensitive workloads in agriculture, utilities and aviation. Telcos deploy micro-edge huts using 12-42U hybrid racks close to 5G antennas. This diversity broadens total addressable shipments yet amplifies customization needs across the New Zealand data center rack market.
By Material: Steel Remains Mainstay as Aluminum Gains Momentum
Structural steel frames dominated at 62.75% share in 2025, valued for load capacity and familiar seismic behavior. Yet aluminum units chart an 11.06% CAGR, propelled by South Island operators that prize low weight and corrosion resistance. Fabricators introduce hybrid SM45 steels with Eco-PZ coatings, cutting embodied CO₂, aligning with Zero-Carbon targets without sacrificing tensile strength.
Innovations such as Tate’s low-carbon alloy tray reduce rack mass by 30%, easing installation in retrofitted floors. TimberMod concepts integrate cross-laminated timber containment skeletons around steel cores, marrying sustainability with rigidity. Composite FRP enclosures emerge for coastal stations exposed to salt spray, illustrating expanding material palettes in the New Zealand data center rack industry.
Geography Analysis
The Auckland metropolitan area commands the majority of deployments owing to its concentration of submarine cables and hyperscale campuses, securing more than half of New Zealand data center rack market size in 2025 . Dense cloud footprints stimulate demand for 42U and 48U cabinets rated above 10 kW per rack. International interconnect exchanges anchored in Auckland further incentivize premium power-per-footprint solutions that maximize return on constrained downtown plots.
Wellington’s government agencies generate steady cabinet orders emphasizing security accreditation and seismic anchoring, although some public-sector workloads are migrating north to the new GCSB complex in Whenuapai, sustaining cabinet refresh cycles. Christchurch and Hamilton support regional enterprise nodes and research institutes, favoring modest-density racks outfitted with redundant PDUs for high availability.
South Island regions such as Invercargill present emerging clusters powered by 100% hydro and wind. The Te Waipounamu cable’s 120 Tbps capacity will unlock direct Australia routes, attracting operators pursuing carbon-free SLAs. Cooler ambient temperatures permit free-air cooling for nine months of the year, trimming OPEX and heightening appeal of taller 48U frames. Queenstown and Dunedin telecom shelters add low-touch rugged racks tied to renewable micro-grids, broadening geographic diversification within the New Zealand data center rack market.
Coverage of the data center rack market by Mordor Intelligence spans a wide geographic footprint, with regional analysis available for Europe, North America, and Africa, alongside detailed country-level intelligence for China, Philippines, Russia, United States, South Africa, and Hong Kong, each shaped by local operating conditions.
Competitive Landscape
Global infrastructure majors front-load the supply chain, but local integrators tune solutions for seismic and regulatory nuances. Schneider Electric’s Galaxy VXL UPS delivering 1.25 MW per frame complements its EcoStruxure-ready cabinets and positions the firm for AI data halls . Vertiv’s power and cooling portfolio addresses 10-140 kW per rack scenarios, mirroring rack power densities forecast to reach 1,000 kW in niche HPC pods. Eaton’s Fibrebond acquisition bolsters prefabricated modular data halls that embed steel or aluminum racks pre-wired with PV-ready switchboards.
nVent’s edgeNRG range services telco roadside shelters and offshore renewables, featuring NEMA 4-rated enclosures capable of remote DCIM. Rittal expands colocation-optimized TS IT variants with automatic airflow shutters and security bars. Dell, HPE and Supermicro cooperate with rack vendors on turnkey AI clusters, embedding NVIDIA Blackwell and GB200 GPU nodes that draw up to 80 kW per cabinet.
New Zealand Data Center Rack Industry Leaders
Schneider Electric SE
Eaton Corporation
Rittal GmbH & Co.KG
Hewlett Packard Enterprise
Vertiv Group Corp.
- *Disclaimer: Major Players sorted in no particular order

Recent Industry Developments
- May 2025: Dell Technologies unveiled next-generation PowerEdge XE9780 and XE9785 servers supporting up to 192 NVIDIA Blackwell Ultra GPUs, enhancing AI training capabilities through the Dell AI Factory with NVIDIA comprehensive solution for enterprise AI deployment.
- May 2025: Hewlett Packard Enterprise deepened its integration with NVIDIA on AI Factory portfolio, introducing HPE Private Cloud AI with support for NVIDIA AI Enterprise feature branch model updates and HPE Alletra Storage MP X10000 with SDK for NVIDIA AI Data Platform.
- April 2025: Vertiv reported Q1 2025 net sales of USD 2.04 billion, a 25% rise over Q1 2024, driven by hyperscale and colocation demand.
- March 2025: Schneider Electric announced plans to invest USD 700 million in US operations by 2027, expanding output of rack and power systems.


Research Methodology Framework and Report Scope
Market Definitions and Key Coverage
Our study treats the New Zealand data-center rack market as the revenue generated from new, factory-built steel or aluminum frames that hold IT servers, networking gear, power strips, and cable organizers inside purpose-built data-center halls.
Scope exclusion: Small office server cabinets, retrofit kits, and racks installed in broadcast or industrial control rooms sit outside this assessment.
Segmentation Overview
- By Rack Size
- Quarter Rack
- Half Rack
- Full Rack
- By Rack Height
- 42U
- 45U
- 48U
- Other Heights (52U and Custom)
- By Rack Type
- Cabinet (Closed) Racks
- Open-Frame Racks
- Wall-Mount Racks
- By Data Center Type
- Colocation Facilities
- Hyperscale and Cloud Service Provider DCs
- Enterprise and Edge
- By Material
- Steel
- Aluminum
- Other Alloys and Composites
Detailed Research Methodology and Data Validation
Primary Research
Analysts interview Auckland-based colocation managers, regional procurement heads at two global rack OEM distributors, and systems-integrator engineers in Wellington. These discussions clarify average selling prices, power-per-rack roadmaps, and deployment timelines that secondary data alone cannot surface.
Desk Research
We begin by reviewing public sources such as Stats NZ's building consents, MBIE's data-center tax incentive filings, and Transpower load curves, which reveal growth in high-density halls. Trade-association notes from the New Zealand Telecommunications Forum and the Asia Pacific Data Centre Association provide installed-rack benchmarks and pipeline updates. Company disclosures, investor decks, and planning documents lodged with the Overseas Investment Office round out local signals. To validate prices, our analysts pull shipment values from customs records and D&B Hoovers. Dow Jones Factiva screens help us monitor fresh facility announcements. This list is illustrative; many additional sources support data checks.
Market-Sizing & Forecasting
The model starts with a top-down read of installed racks and construction plans, reconstructed from building permits, public environmental filings, and colocation occupancy disclosures. Results are then tested with selective bottom-up snapshots, sampled OEM shipments and channel ASP × volume estimates, to fine-tune totals. Key inputs include annual hyperscale capex placed in New Zealand, average rack density (kW), raised-floor expansion, submarine-cable bandwidth growth, and 5G subscriber additions. A multivariate regression projects these drivers through 2030, after which scenario analysis checks sensitivity to power-price swings. Gaps where channel data are thin are bridged with conservative uptake ratios vetted by interviewed experts.
Data Validation & Update Cycle
Every quarter, Mordor analysts compare model outputs with fresh capacity news and customs trends, flag anomalies, and recontact at least one primary source before sign-off. Full report refresh happens yearly, with interim flashes for material events.
Why Mordor's New Zealand Data Center Rack Baseline Commands Reliability
Published estimates often diverge because firms choose wider infrastructure scopes, vary ASP ladders, or refresh at uneven intervals.
Key gap drivers include whether totals bundle enclosures, cooling modules, or power rails, the currency conversion year used, and how aggressively hyperscale build-outs are front-loaded. Mordor's base sticks to bare-rack hardware shipped into certified data-center spaces only, uses transaction-weighted ASPs, and is updated annually, which explains variance with peers.
Benchmark comparison
| Market Size | Anonymized source | Primary gap driver |
|---|---|---|
| USD 36.75 M (2025) | Mordor Intelligence | - |
| USD 5.34 B (2024) | Global Consultancy A | Combines racks with PDUs, containment, and adjacent Oceania markets |
| NZD 50 M ≈ USD 30 M (2025) | Trade Journal B | Uses retail cabinet pricing and excludes hyperscale self-build volumes |
In summary, Mordor's disciplined scope, variable selection, and annual refresh cadence yield a transparent baseline that decision-makers can trace back to hard capacity metrics and reproducible steps.


Key Questions Answered in the Report
What is the current value of the New Zealand data center rack market?
The market stands at USD 40.81 million in 2026 and is on track to reach USD 68.93 million by 2031.
Which rack height is growing fastest in New Zealand?
48U cabinets register the highest 12.1% CAGR through 2031 as operators seek higher server density.
Why is Auckland the primary hub for rack demand?
Auckland hosts most submarine cable landings and hyperscale campuses, driving concentration of high-density cabinet deployments.
What role does sustainability play in rack purchasing decisions?
Government Zero-Carbon 2050 goals and abundant renewable power spur demand for low-carbon materials and energy-efficient, liquid-cooling-ready racks.
Page last updated on:


