Data Center Rack Market Size and Share
Market Overview
| Study Period | 2020 - 2031 |
|---|---|
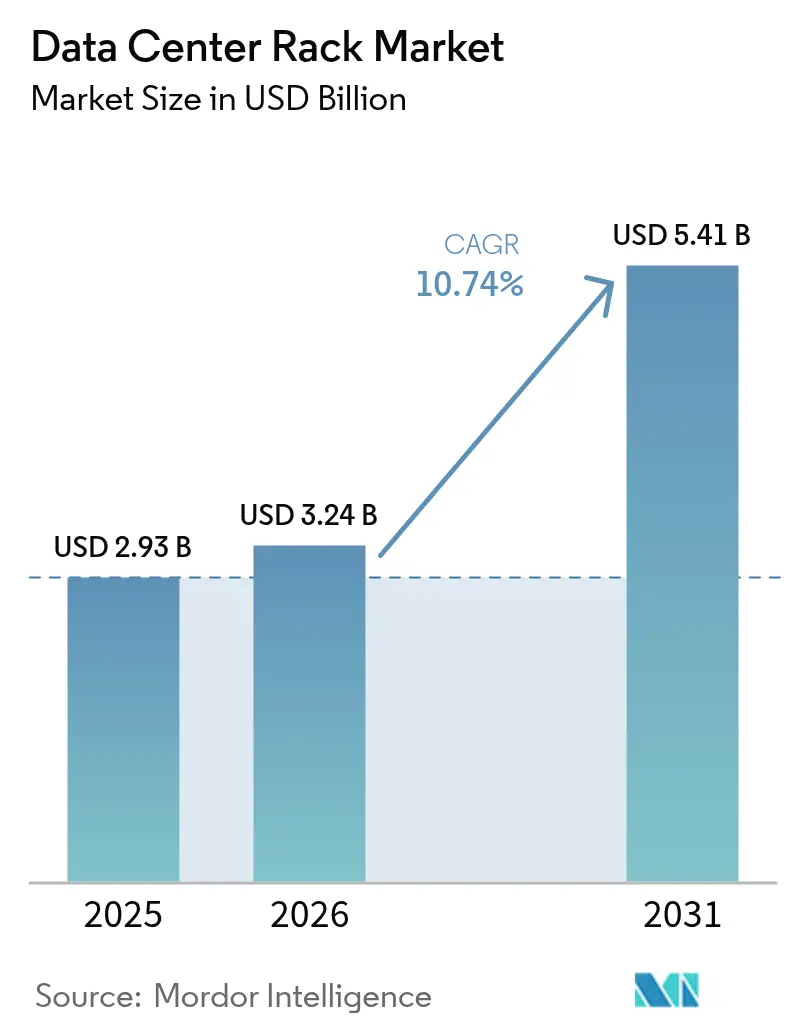
| Market Size (2026) | USD 3.24 Billion |
| Market Size (2031) | USD 5.41 Billion |
| Growth Rate (2026 - 2031) | 10.74% CAGR |
| Fastest Growing Market | Asia Pacific |
| Largest Market | North America |
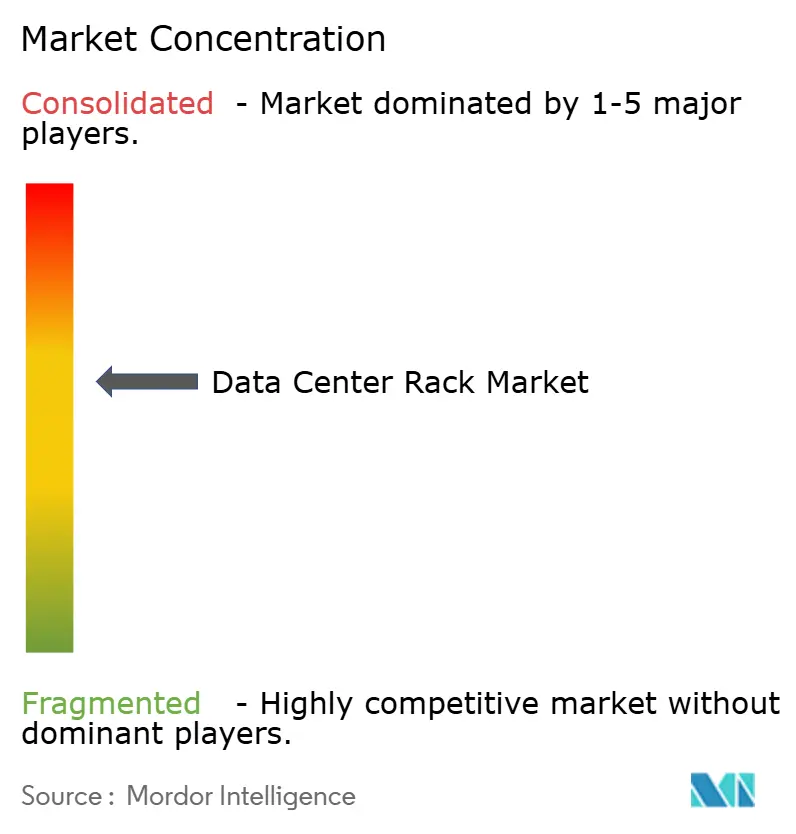
| Market Concentration | Medium |
Major Players *Disclaimer: Major Players sorted in no particular order Image © Mordor Intelligence. Reuse requires attribution under CC BY 4.0. | |
Data Center Rack Market Analysis by Mordor Intelligence
The Data Center Rack Market size was valued at USD 2.93 billion in 2025 and is estimated to grow from USD 3.24 billion in 2026 to reach USD 5.41 billion by 2031, at a CAGR of 10.74% during the forecast period (2026-2031).
The data center rack market is expanding because hyperscale operators, cloud service providers, and edge deployments are standardizing on rack-level liquid cooling and power delivery systems that support loads above 40 kW. Operators view rack infrastructure as the physical foundation for artificial intelligence (AI) workloads, high-performance computing clusters, and latency-sensitive edge nodes. Taller 48U configurations, cabinet-style containment, and liquid-ready structural designs are becoming mainstream as companies seek to maximize compute density while improving thermal management. The region-wide pivot toward sovereign AI, renewable-powered facilities, and stricter energy-efficiency rules further intensifies demand for advanced rack solutions capable of meeting regulatory, sustainability, and serviceability targets.
Key Report Takeaways
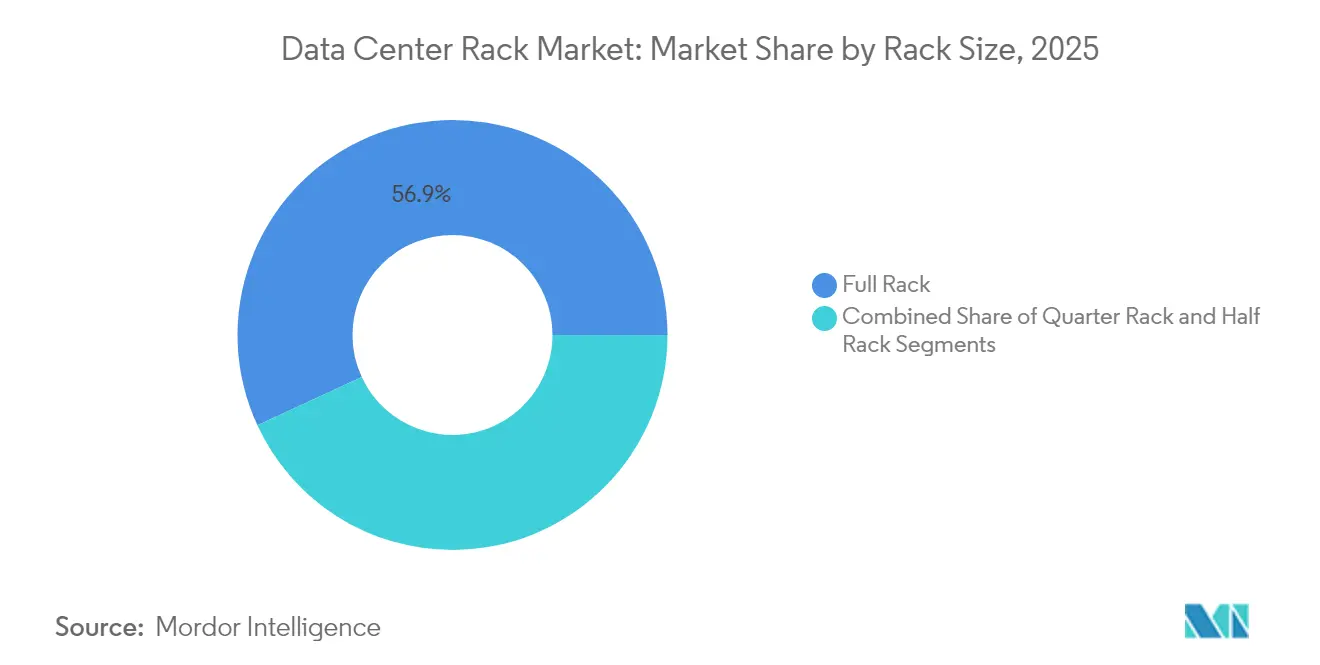
- By rack size, full rack systems commanded 56.90% of the data center rack market share in 2025; the same segment is projected to post a 12.55% CAGR through 2031.
- By rack height, 42U installations led with 53.10% revenue share in 2025, while 48U designs are set to expand at a 11.78% CAGR to 2031.
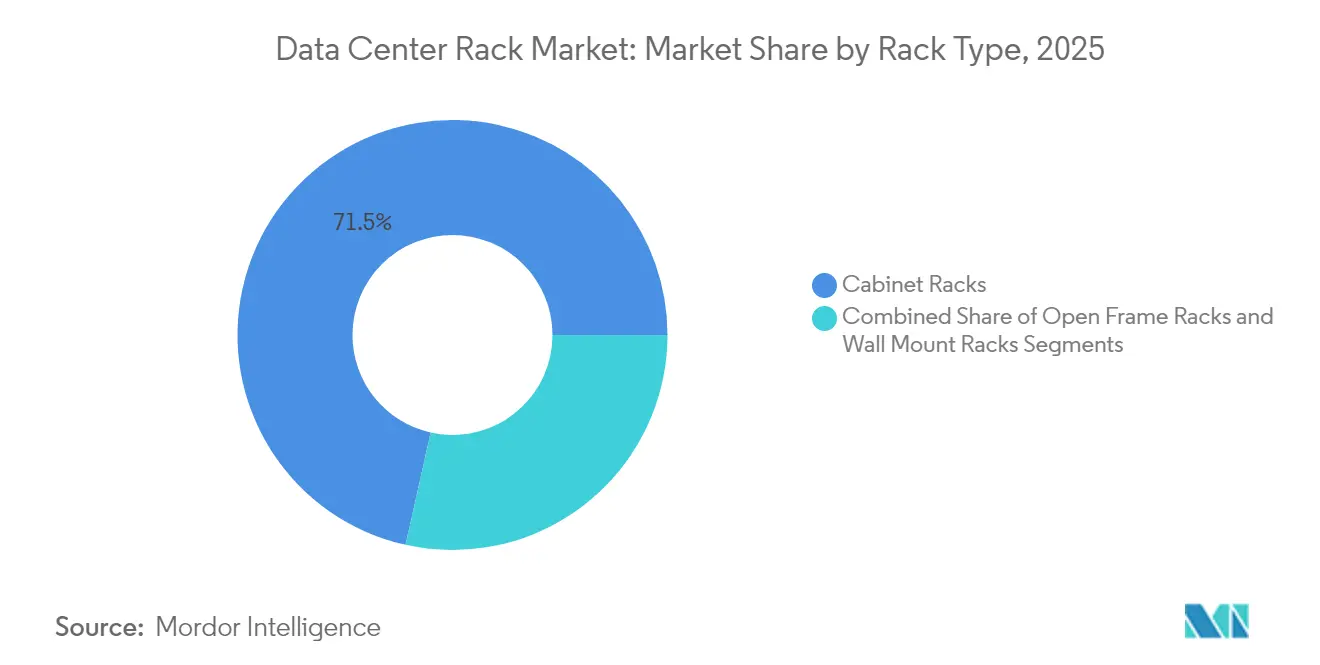
- By rack type, cabinet enclosures held 71.50% of the data center rack market in 2025; open-frame units lag as cabinet demand rises 11.22% annually.
- By data-center type, colocation facilities captured 53.70% of 2025 revenue, whereas hyperscale builds are on track for the fastest 12.85% CAGR to 2031.
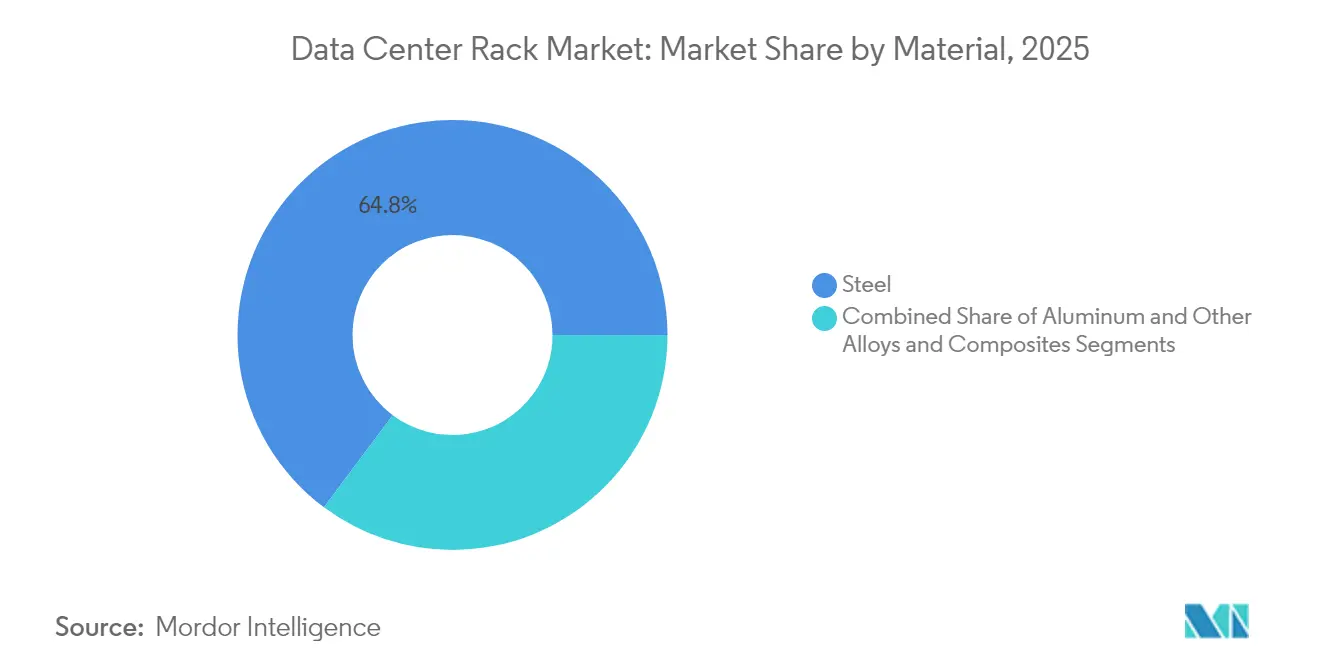
- By material, steel accounted for 64.80% of the data center rack market size in 2025, while aluminum is the quickest-growing material at 11.45% CAGR.
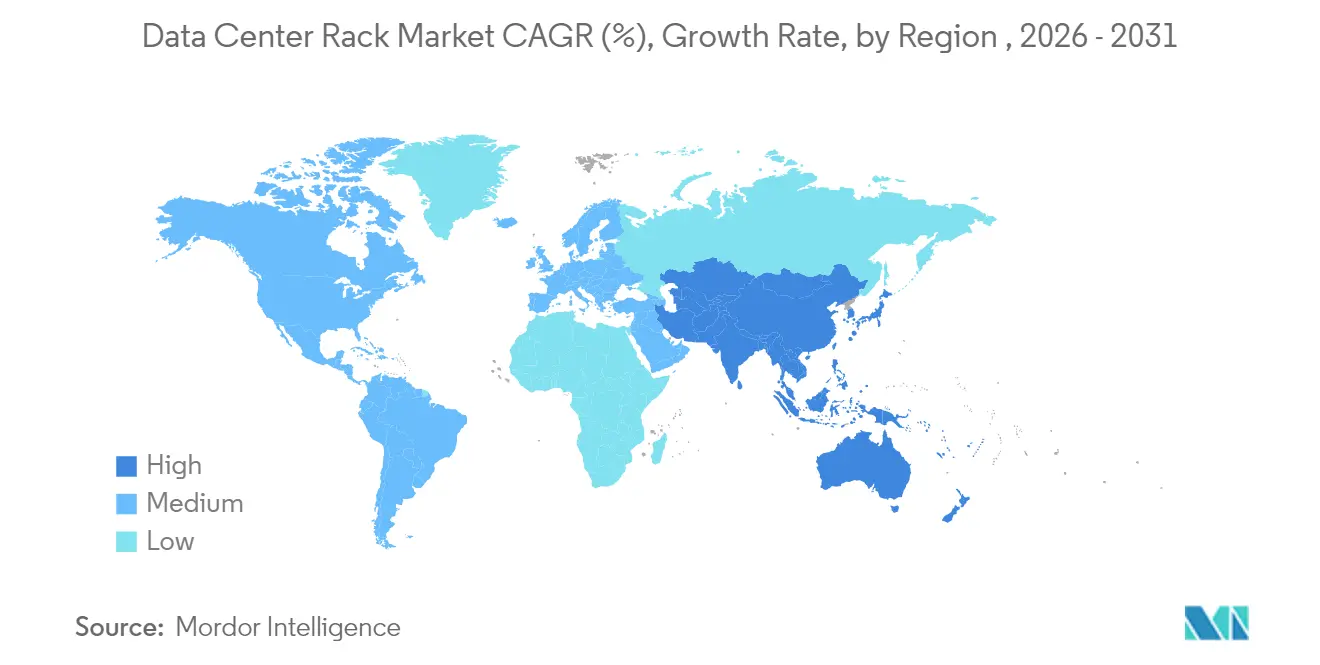
- By geography, North America led with 32.10% share in 2025; Asia-Pacific represents the fastest-growing region at 12.82% CAGR through 2031.
Note: Market size and forecast figures in this report are generated using Mordor Intelligence’s proprietary estimation framework, updated with the latest available data and insights as of 2026.
Global Data Center Rack Market Trends and Insights
Drivers Impact Analysis*
| Driver | (~)% Impact on CAGR Forecast | Geographic Relevance | Impact Timeline | Driver |
|---|---|---|---|---|
| Hyperscale and colocation build-outs surge | +3.2% | Global, concentrated in North America and APAC | Medium term (2-4 years) | Hyperscale & colocation build-outs surge |
| Rising cloud and edge adoption boosts rack demand | +2.8% | Global, with edge focus in urban metros | Long term (≥ 4 years) | Rising cloud & edge adoption boosts rack demand |
| High-density server deployment (>40 kW/rack) | +2.1% | North America and EU, expanding to APAC | Short term (≤ 2 years) | High-density server deployment (>40 kW/rack) |
| Energy-efficiency regulations (EU Code of Conduct / ASHRAE) | +1.4% | EU primary, North America secondary | Medium term (2-4 years) | Energy-efficiency regulations (EU Code of Conduct / ASHRAE) |
| AI-optimised liquid-cooled rack architectures | +1.8% | Global hyperscale markets | Short term (≤ 2 years) | AI-optimised liquid-cooled rack architectures |
| National incentives for local rack manufacturing | +0.9% | US, EU, select APAC markets | Long term (≥ 4 years) | National incentives for local rack manufacturing |
| Source: Mordor Intelligence | ||||
Hyperscale and Colocation Build-outs Surge
Hyperscale capital spending topped USD 27 billion in the United States during 2025, reflecting 69% year-over-year growth that cements data-center construction as the fastest-expanding non-residential segment. Individual GPU clusters now demand 10–140 kW per rack, pushing operators to redesign white-space layouts around liquid manifolds versus legacy air handling. Colocation leaders such as Digital Realty introduced AI-ready suites that sustain 70 kW per cabinet, signalling that premium rack infrastructure is a competitive differentiator. Because retrofit costs for air-cooled halls can eclipse new-build budgets, these expansions fuel multiyear ordering cycles for cabinet-class racks. The trend also illustrates hyperscalers’ shift toward owning facilities to preserve control of training and inference environments.
Rising Cloud and Edge Adoption Boosts Rack Demand
Enterprises are placing compute nodes next to factories, warehouses, and retail stores, compelling vendors to engineer ruggedized racks. FedEx deployed edge modules inside logistics hubs through a Dell–Switch collaboration that requires vibration-resistant enclosures and remote-management PDUs. Telecom operators like Etisalat are rolling out compact edge servers that mount in sealed cabinets installed on street furniture, illustrating how 5G pushes rack form factors beyond traditional data floors.[1]MEPS International, “Global Steel Market Monthly Review,” mepsinternational.com Manufacturers such as 3M leverage Azure SQL Edge on industrial shop floors, demanding NEMA-rated racks that tolerate dust and temperature swings. Consequently, the data center rack market accelerates in segments that supply pre-integrated, modular solutions suitable for thousands of distributed sites.
High-Density Server Deployment (Greater Than 40 kW/rack)
Liquid cooling partnerships, including Vertiv’s GB200 NVL72 reference platform with NVIDIA, support 132 kW heat loads per rack.[2]Intel, “Etisalat Deploys Edge Cloud on 5G,” intel.comAir systems cap out near 20 kW, so direct-to-chip coolant loops and rear-door heat exchangers become indispensable. Chatsworth Products demonstrated > 30 kW cabinets by channeling exhaust vertically into ceiling plenums, a tactic that enables legacy halls to defer large-scale chiller upgrades. Elevated rack weight from coolant manifolds drives redesigns of structural frames and seismic anchoring. These engineering shifts ripple through supply chains, spurring demand for thicker gauge steel, leak-proof quick couplings, and redundant power strips.
Energy-Efficiency Regulations (EU Code of Conduct / ASHRAE)
The European Union’s revised Energy Efficiency Directive mandates yearly reporting for facilities over 100 kW IT load, aligning incentives toward liquid cooling that can achieve PUE as low as 1.03. [3]European Commission, “Revised Energy Efficiency Directive 2025,” ec.europa.euASHRAE widened allowable inlet temperatures, enabling chiller-less economiser modes when racks maintain tight airflow containment. Germany’s Energy Efficiency Act compels data centers to reuse waste heat, favouring rear-door liquid coolers that can transfer high-grade thermal energy to district-heating loops. Vendors integrating compliant racks enjoy accelerated procurement cycles as operators race to meet disclosure deadlines.
Restraint Impact Analysis*
| Restraint | (~)% Impact on CAGR Forecast | Geographic Relevance | Impact Timeline | Restraint |
|---|---|---|---|---|
| High upfront capex for advanced cabinets | -1.8% | Global, acute in emerging markets | Short term (≤ 2 years) | High upfront capex for advanced cabinets |
| Growing use of blade/server-on-chip modules | -1.2% | North America & EU enterprise markets | Medium term (2-4 years) | Growing use of blade/server-on-chip modules |
| Power and space scarcity in tier-1 metros | -1.5% | Northern Virginia, Silicon Valley, London | Long term (≥ 4 years) | Power & space scarcity in tier-1 metros |
| Specialty steel and aluminium supply volatility | -0.9% | Global, supply chain dependent | Short term (≤ 2 years) | Specialty steel & aluminium supply volatility |
| Source: Mordor Intelligence | ||||
High Upfront Capex for Advanced Cabinets
Liquid-ready racks cost 20–35% more than air-only frames because they bundle manifolds, drip-less couplings, sensors, and heavier doors. While energy savings can offset the premium over a 3–5-year span, mid-market operators often face budget lockouts that delay adoption. Leasing providers now pre-stage customised racks to shorten deployment cycles; Networks Centre reduced installation costs 18% for a multinational bank by shipping fully cabled cabinets. Financing innovations ease the burden, yet price sensitivity remains a near-term brake on emerging-market roll-outs.
Power and Space Scarcity in Tier-1 Metros
Northern Virginia and Silicon Valley utilities quote transformer lead times of up to four years, restricting new-build capacity and raising land prices. Operators, therefore, squeeze more compute into existing shells, boosting demand for high-density racks that maximise watts per square foot. Iron Mountain’s geothermal-assisted hall in Pennsylvania cut energy use 34% with a 1.6 PUE, proving that creative cooling can unlock stranded power. Nevertheless, grid congestion spurs a migration to secondary markets, shifting rack sales geography toward sites with untapped megawatt allotments.
*Our forecasts treat driver/restraint impacts as directional, not additive. The impact forecasts reflect baseline growth, mix effects, and variable interactions.
Segment Analysis
By Rack Size: Full Racks Anchor Density Ambitions
Full racks delivered 56.90% of the data center rack market in 2025 and will outpace other sizes with a 12.55% CAGR to 2031. That share equates to a commanding portion of the data center rack market size and reflects hyperscalers’ preference for 42U footprints that streamline cabling, airflow, and PDU standardisation. AI clusters demand sprawling PCIe and NVLink interconnects, making full racks indispensable for clean cable routing that sustains signal integrity at 100 Gbps and higher. In retrofit halls, larger frames also minimise floor-tile reconfiguration costs by aligning with existing cold-aisle geometry.
Liquid cooling magnifies full-rack advantages because taller vertical spaces facilitate segregated supply-and-return coolant channels. Schneider Electric’s GB200 NVL72 blueprint achieves 132 kW per full rack through bespoke manifolds positioned below a 42U server zone. The data center rack market thus rewards vendors that deliver factory-integrated coolant loops, redundant pumps, and quick-disconnect couplings pre-installed within full-height cabinets. Half- and quarter-rack formats still serve edge closets and network rooms, yet their CAGR trails because these environments seldom require lavish GPU clusters.


By Rack Height: 48U Designs Become the New Baseline
Although 42U frames dominated 2025 with 53.10% revenue share, 48U variants are the fastest-growing height, posting 11.78% CAGR through 2031. Operators value the extra 6U for housing liquid manifolds, busways, or top-of-rack switches without sacrificing server slots. The incremental height reduces aisle count, yielding up to 12% floor-space savings in large halls. Taller frames also balance weight distribution across casters, vital when cabinets surpass 1,500 kilograms once coolant is added.
Rittal’s VX IT line lets technicians mix 42U and 48U frames on common rails, easing phased migrations that align with budget cycles. Custom 52U or 54U models appear in high-ceiling warehouses where vertical clearance is plentiful, but adoption remains niche. With liquid cooling pushing density ceilings higher, the data center rack market regards 48U as the sweet spot between legacy compatibility and forward-looking capacity.
By Rack Type: Cabinet Containment Dominates Thermal Strategy
Closed cabinets ruled 71.50% of the data center rack market share in 2025, and the segment is cruising at 11.22% CAGR. AI clusters rely on hot- and cold-aisle segregation plus liquid rear-door exchangers, both of which require sealed enclosures. Cabinet designs also permit door-mounted power meters and security sensors that open-frame racks cannot support.
TeleCommunication Systems slashed PUE to 1.15 by deploying Chatsworth’s passive chimney cabinets, underlining the efficiency leap from precise airflow management. Open-frame racks still populate network labs, while wall-mount units protect edge gear in retail sites, yet their limited containment ability caps growth. Consequently, cabinet suppliers with modular side-panel kits and DCIM-ready smart doors enjoy premium attach-rates in the expanding data center rack market.
By Data Center Type: Hyperscale Momentum Rewrites the Order Book
Colocation halls held 53.70% revenue share in 2025, but hyperscale projects are sprinting at a 12.85% CAGR after operators such as Microsoft budgeted USD 80 billion for AI-optimised campuses. GPU factories require bespoke rack heights, liquid pathways, and back-plane power rails that most multitenant sites cannot retrofit without lengthy outages. Accordingly, cloud giants sign direct supply contracts for cabinet batches that match global templates.
Colocation incumbents answer with AI suites rated 70 kW per rack, yet build-to-suit cycles lag hyperscaler timelines. Enterprises and edge deployments grow steadily as regulatory and latency needs localise workloads. However, their share of the data center rack market size remains secondary because deployment volumes are fragmented across hundreds of micro-sites.
By Material: Steel Holds Ground as Aluminum Gains Lift
Steel frames captured 64.80% of 2025 revenue owing to cost efficiency and compressive strength suited to 1-ton cabinets. Aluminum enclosures, expanding 11.45% annually, tempt buyers with 30% weight savings and double the thermal conductivity, enabling faster heat dissipation into rear-door coolers. Nucor’s USD 115 million buyout of Southwest Data Products exemplifies steel producers doubling down on digital-infrastructure demand.
Tariffs on Chinese steel and copper shortages inflate input costs, causing some operators to price-compare aluminum despite higher raw-metal premiums. Aluminum’s recyclability aligns with sustainability mandates, tipping decisions in ESG-focused tenders. Composite materials with electromagnetic shielding emerge in defense and healthcare data rooms, yet volumes stay modest. Over the forecast horizon, steel remains the bedrock of the data center rack market, while aluminum secures a growing niche in liquid-cooled GPU rows
Geography Analysis
North America commanded 32.10% of 2025 revenue thanks to deep hyperscale ecosystems, well-established supply chains, and regulatory clarity. Data-center capital expenditure surpassed USD 27 billion in the United States during 2025, though utility congestion in Northern Virginia and Silicon Valley tempers growth. Canada accelerates sustainability-centric builds that leverage hydro generation, while Mexico attracts near-shoring edge nodes supporting U.S. latency targets. Local manufacturing expansions, such as Schneider Electric’s USD 140 million Tennessee plant for switchgear, help suppliers dodge tariff headwinds.
Asia-Pacific is advancing at a 12.82% CAGR, the fastest regional clip in the data center rack market. China channels sovereign AI funds into massive GPU bases, India’s digital-services boom propels 5- to 20-MW campuses across tier-2 cities, and Japan backs edge clusters to automate factories. Regional fabrication hubs slash logistics lead times for racks, yet copper deficits could add cost volatility. Projects such as Vertiv-equipped iGenius AI centers illustrate how domestic supply ecosystems are rising to meet localised compute mandates.
Mordor Intelligence provides coverage of the data center rack market across other key regional markets, including Middle East, South America, Europe, North America, and Africa, each with their regulatory frameworks and demand patterns. Detailed country-level analysis extends to Saudi Arabia, Brazil, Italy, United States, and Nigeria incorporating local coverage and market participation, as required.

Competitive Landscape
The data center rack market remains moderately fragmented even as consolidation accelerates. Global leaders Schneider Electric, Vertiv, and Eaton are assembling full-stack portfolios that merge racks with power and cooling gear. Eaton’s USD 1.4 billion acquisition of Fibrebond delivers prefab power skids that shorten hyperscale deployment schedules. Schneider Electric deepened its liquid-cooling bench by buying Motivair, targeting AI clusters that exceed 100 kW per rack . Such vertical integration improves margin capture and supply-chain control while simplifying procurement for operators seeking turnkey blocks.
Mid-tier specialists Rittal, Chatsworth, and Panduit defend share through customisation, rapid shipping, and open-standards participation. The Open Compute Project’s Open Bridge Rack illustrates how hyperscalers set de-facto specifications and invite ecosystem vendors to build compatible enclosures that cut energy use 20%. Immersion-cooling disruptors present another flank, offering tank-based systems that bypass 19-inch racks altogether; however, adoption is still limited to niche HPC workloads.
Data Center Rack Industry Leaders
Schneider Electric SE
Vertiv Group Corp.
Eaton Corp. plc
Rittal GmbH & Co. KG
Hewlett Packard Enterprise
- *Disclaimer: Major Players sorted in no particular order

Recent Industry Developments
- May 2025: Vertiv announced an 800 VDC power architecture for AI factories, featuring centralized rectifiers and rack-level converters that cut copper mass.
- April 2025: Legrand launched the Fiber Express Ship Program, offering next-day dispatch of high-bandwidth assemblies to prevent build delays.
- March 2025: Eaton agreed to acquire Fibrebond for USD 1.4 billion, adding pre-integrated modular enclosures to its portfolio.
- March 2025: Vertiv released new rack power and cooling systems geared for AI workloads, boosting density and deployment speed.


Research Methodology Framework and Report Scope
Market Definitions and Key Coverage
Mordor Intelligence defines the data center rack market as all new, factory-built open-frame, cabinet, and wall-mount frameworks that physically house servers, storage, and networking gear inside colocation, hyperscale, enterprise, and edge facilities.
Scope exclusion: Used or refurbished racks, modular data-center pods, and non-standard Open Compute Project frames sit outside this study.
Segmentation Overview
- By Rack Size
- Quarter Rack
- Half Rack
- Full Rack
- By Rack Height
- 42U
- 45U
- 48U
- Other Heights (52U and Custom)
- By Rack Type
- Cabinet (Closed) Racks
- Open-Frame Racks
- Wall-Mount Racks
- By Data Center Type
- Colocation Facilities
- Hyperscale and Cloud Service Provider DCs
- Enterprise and Edge
- By Material
- Steel
- Aluminum
- Other Alloys and Composites
- By Geography
- North America
- United States
- Canada
- Mexico
- South America
- Brazil
- Argentina
- Rest of South America
- Europe
- Germany
- United Kingdom
- France
- Italy
- Spain
- Russia
- Rest of Europe
- Asia-Pacific
- China
- Japan
- India
- South Korea
- Australia and New Zealand
- Rest of Asia-Pacific
- Middle East and Africa
- Middle East
- Saudi Arabia
- United Arab Emirates
- Turkey
- Rest of Middle East
- Africa
- South Africa
- Nigeria
- Rest of Africa
- Middle East
- North America
Detailed Research Methodology and Data Validation
Primary Research
We interviewed global colocation planners, thermal engineers at leading rack OEMs, and procurement managers at cloud operators across North America, Europe, and Asia Pacific. Their insights on real-world rack densities, ASP shifts linked to liquid cooling, and deployment lead times filled data gaps and shaped assumption ranges that we later triangulated.
Desk Research
Our analysts first mapped demand drivers through freely available tier-one sources such as Uptime Institute's annual data-center survey, AFCOM State of the Data Center reports, US Energy Information Administration load statistics, European Commission Code of Conduct guidelines, and patent families pulled via Questel highlighting liquid-cool rack designs. We cross-checked shipment flows using Volza import records and reconciled price ranges with IT equipment lists disclosed in SEC 10-Ks and vendor investor decks.
To ground recent buildouts, we reviewed hyperscale land-bank announcements logged in Dow Jones Factiva, tracking megawatt additions by region, and consulted trade-association bulletins from the Open Compute Project and IMTMA for material cost trends. This desk input is illustrative, not exhaustive, and many additional sources informed data validation.
Market-Sizing & Forecasting
We begin with a top-down reconstruction of worldwide white-space additions and average racks-per-MW, which are then multiplied by region-specific ASPs to generate the 2025 baseline. Select bottom-up checks, supplier shipment roll-ups and sampled channel invoices, calibrate totals before final lock. Key variables include hyperscale MW pipeline, average rack density (kW), share of cabinet versus open frames, aluminum cost index, and liquid-cool penetration. A multivariate regression relating these drivers to rack installations produces annual forecasts through 2030; missing bottom-up data points are bridged using conservative imputation guided by primary-source consensus.
Data Validation & Update Cycle
Each draft model passes variance and anomaly checks, followed by a peer review round. When external metrics diverge by more than 5 percent, analysts re-contact sources or adjust assumptions. The study refreshes yearly, with interim updates triggered by material events such as a megawatt-scale hyperscale expansion.
Why Mordor's Data Center Rack Baseline Commands Confidence
Published figures often differ because firms choose unequal scopes, price stacks, and refresh cadences. We flag these factors upfront so buyers understand why numbers vary.
Primary gap drivers span inclusion of ancillary containment, bundling of maintenance fees, and currency-conversion timing, areas where Mordor's disciplined scope and annual refresh keep estimates consistent.
Benchmark comparison
| Market Size | Anonymized source | Primary gap driver |
|---|---|---|
| USD 2.93 billion | Mordor Intelligence | |
| USD 4.98 billion | Regional Consultancy A | counts refurbished units and micro-modular pods |
| USD 5.17 billion | Global Consultancy B | bundles rack PDUs and support services into revenue base |
| USD 6.69 billion | Industry Journal C | applies broader price inflation and includes containment aisles |
These comparisons show that Mordor's clear scope boundaries and variable-level cross-checks deliver a transparent, repeatable baseline that decision-makers can rely on.


Key Questions Answered in the Report
What is the current size of the data center rack market?
The global data center rack market size stood at USD 3.24 billion in 2026 and is projected to reach USD 5.41 billion by 2031.
Which rack configuration holds the largest market share?
Full rack systems led with 56.90% of data center rack market share in 2025, reflecting their dominance in hyperscale and colocation builds.
How fast is the Asia-Pacific market growing?
Asia-Pacific is the fastest-growing region, expected to register a 12.82% CAGR between 2026 and 2031 as sovereign AI and manufacturing digitisation fuel demand.
Why are cabinet racks preferred for AI workloads?
Cabinets provide sealed containment necessary for liquid cooling and structured airflow, enabling densities that routinely exceed 40 kW per rack.
What materials are most common in rack construction?
Steel frames remain prevalent with 64.80% share, while aluminum adoption is rising at 11.45% CAGR due to its lighter weight and superior thermal conductivity.
Page last updated on:


