
Poland Data Center Networking Market Size and Share
Market Overview
| Study Period | 2020 - 2031 |
|---|---|
| Forecast Data Period | 2026 - 2031 |
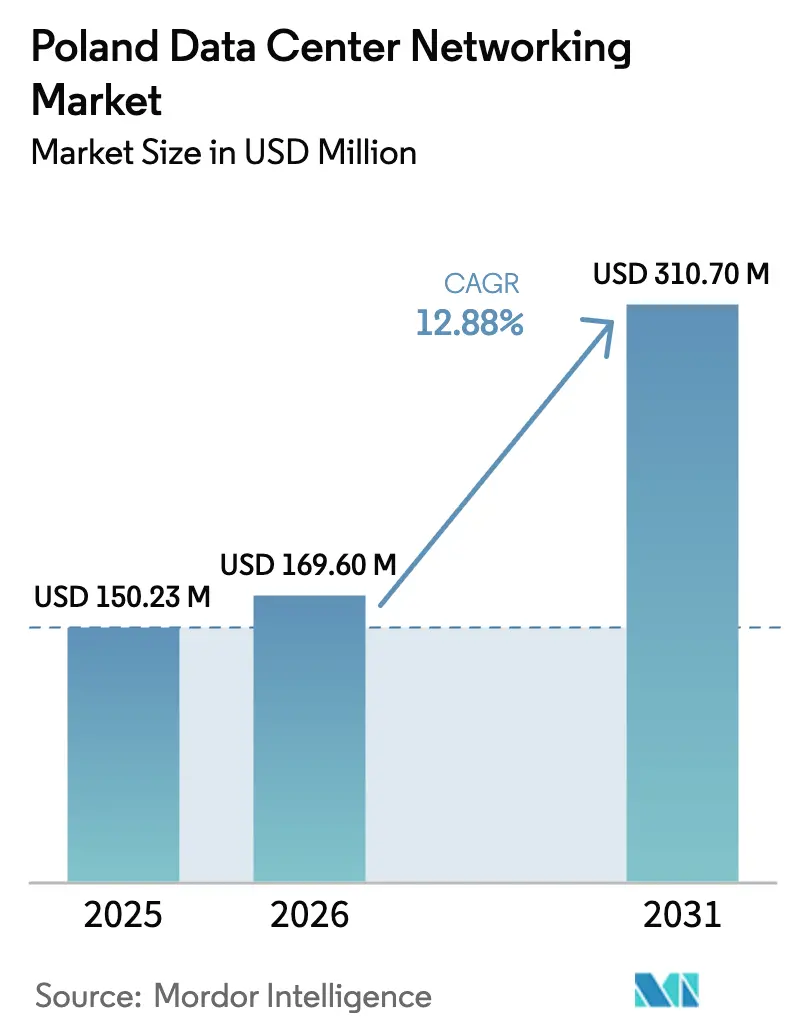
| Base Year Market Size (2025) | USD 150.23 Million |
| Market Size (2026) | USD 169.6 Million |
| Market Size (2031) | USD 310.7 Million |
| Growth Rate (2026 - 2031) | 12.88 % |
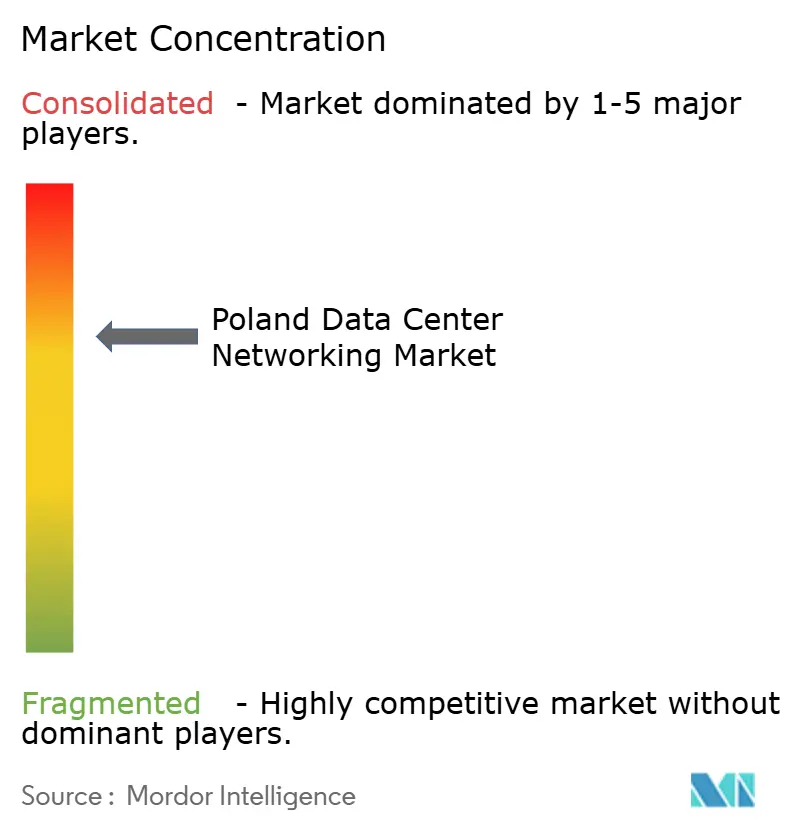
| Market Concentration | Medium |
Major Players *Disclaimer: Major Players sorted in no particular order Image © Mordor Intelligence. Reuse requires attribution under CC BY 4.0. | |
Poland Data Center Networking Market Analysis by Mordor Intelligence
The Poland data center networking market size is expected to grow from USD 150.23 million in 2025 to USD 169.6 million in 2026 and is forecast to reach USD 310.7 million by 2031 at 12.88% CAGR over 2026-2031. This robust outlook positions the Poland data center networking market as a pivotal node for European digital infrastructure, buoyed by hyperscale cloud commitments, accelerating AI adoption, and targeted EU funding. Microsoft’s USD 700 million hyperscale and AI deployment, slated for completion by June 2026, underscores the confidence global providers place in the country’s regulatory alignment and geographic advantage. Grid-connected capacity climbed to 174 MW in mid-2024, yet signed power purchase agreements point toward 500 MW by 2030, confirming that high-density builds are rapidly outpacing legacy capacity. Enterprises upgrading to 400/800 GbE, combined with the EU’s Recovery and Resilience Facility that earmarks 21.3% for digital transformation, funnel demand toward next-generation optical fabrics and software-defined networking. While energy tariffs remain a constraint, Poland’s cool climate and district-heating networks help lower PUE values, making the Poland data center networking market cost-competitive against Frankfurt, Amsterdam, and Dublin.
Key Report Takeaways
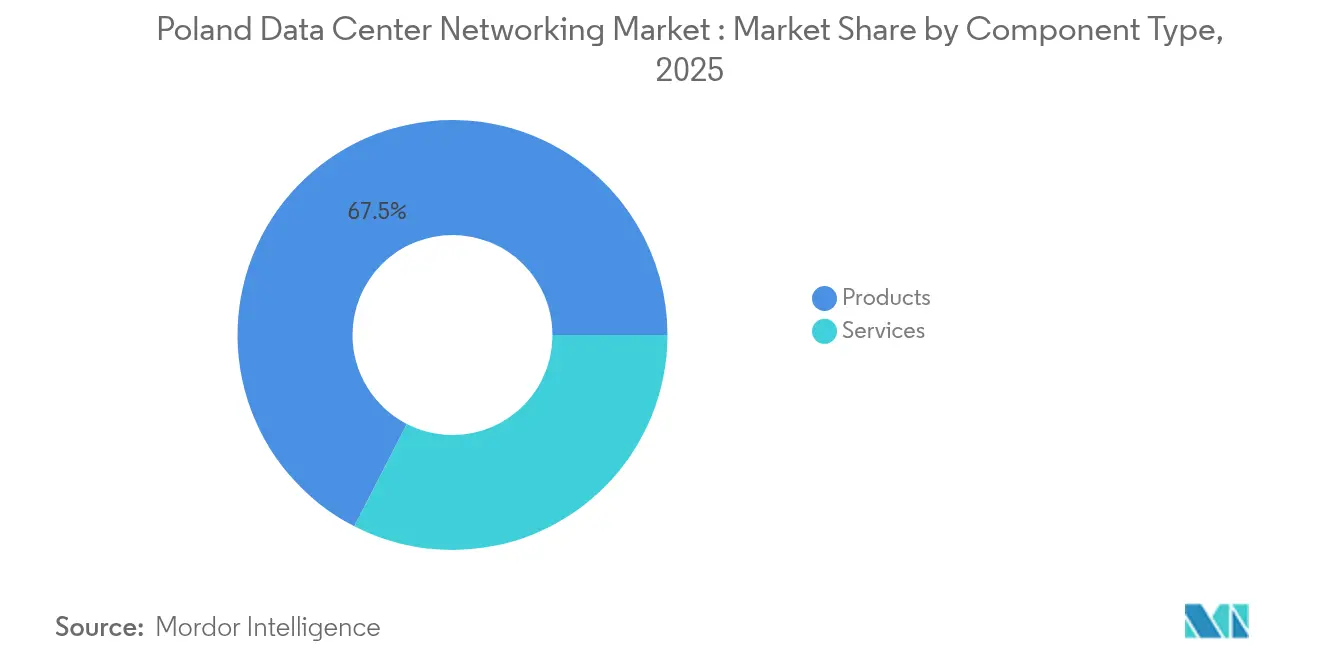
- By component, Products led with 67.45% of Poland data center networking market share in 2025; Services are projected to register the fastest 15.05% CAGR through 2031.
- By end user, IT & Telecommunications held 35.92% of Poland data center networking market size in 2025, whereas Healthcare & Life Sciences is poised for the highest 14.01% CAGR to 2031.
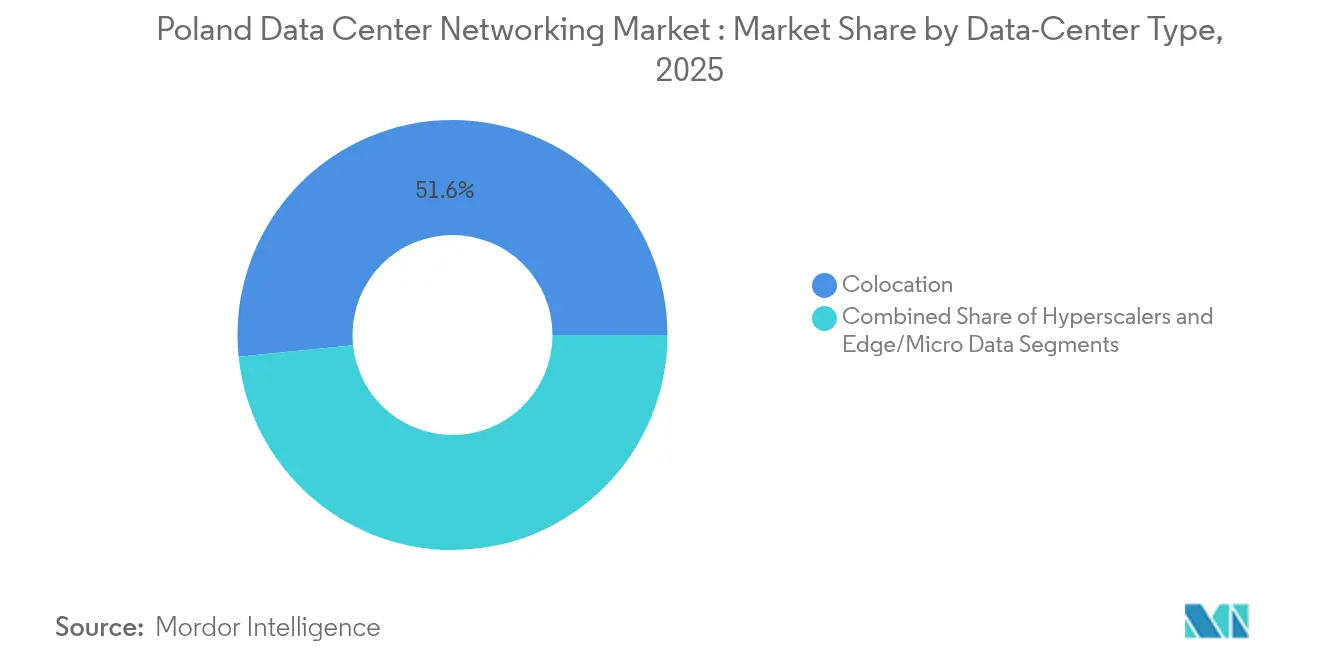
- By data-center type, Colocation facilities commanded 51.62% share of the Poland data center networking market size in 2025, while Hyperscalers & Cloud Service Providers are advancing at a 16.38% CAGR toward 2031.
- By bandwidth, 50-100 GbE configurations represented 35.88% of Poland data center networking market share in 2025; >100 GbE deployments will scale at a 15.53% CAGR as AI workloads intensify.
Note: Market size and forecast figures in this report are generated using Mordor Intelligence’s proprietary estimation framework, updated with the latest available data and insights as of 2026.
Poland Data Center Networking Market Trends and Insights
Drivers Impact Analysis*
| Driver | (~) % Impact on CAGR Forecast | Geographic Relevance | Impact Timeline |
|---|---|---|---|
| Hyperscale and cloud expansion in Poland | +3.2% | Warsaw metro, spillover to Kraków & Poznań | Medium term (2-4 years) |
| AI-driven 400/800 GbE upgrades | +2.8% | National hubs | Short term (≤2 years) |
| EU digital-transition funds and incentives | +2.1% | Nationwide, focus on Eastern regions | Long term (≥4 years) |
| 5G-edge compute demand for local interconnect | +1.8% | Warsaw, Kraków, Gdańsk, Wrocław | Medium term (2-4 years) |
| Poland-EU low-latency disaster-recovery hubs | +1.5% | Cross-border Warsaw financial district | Long term (≥4 years) |
| On-site renewable micro-grids | +1.3% | Rural & suburban campuses | Long term (≥4 years) |
| Source: Mordor Intelligence | |||
Hyperscale and cloud expansion in Poland
Microsoft’s USD 700 million build signals the shift of hyperscale build-outs eastward, establishing anchor tenancy that spurs auxiliary investments from local providers seeking interconnection nodes. The Poland data center networking market benefits as operators accelerate purchase orders for spine-leaf fabrics, high-density optics and automated management suites. Warsaw’s proximity to key internet exchanges keeps latency within stringent EU sovereignty requirements, luring enterprise workloads migrating from saturated Frankfurt and Amsterdam racks. Domestic players such as Atman and EdgeConneX scale footprints to meet colocation overflow created when hyperscalers pre-lease entire halls. As multi-tenant facilities fill, integrators upsell managed network services that optimize ingress-egress traffic and harden security postures
AI-driven 400/800 GbE upgrades
Soaring GPU cluster sizes are overwhelming 100 GbE links, forcing immediate migrations to 400 GbE ToR switches and 800 GbE DWDM optics.[1]PacketLight Communications, “PacketLight Demonstrates 800G Transport Over ER Fiber,” packetlight.com PacketLight’s 1.6 Tbps Muxponder proof-of-concept confirms commercial viability, while NVIDIA’s Spectrum-X fabrics shrink training times by dynamically rerouting congestion hotspots. Academic HPC centers now demand east-west bandwidth rivaling hyperscale tenants, escalating purchase volumes for coherent pluggables. Channel partners capitalize on the shift by bundling telemetry software that identifies microbursts and automates queue-depth tuning. This technology leap positions the Poland data center networking market as an attractive testbed for European AI consortiums seeking sovereign compute capacity.
EU digital-transition funds & incentives
The Recovery and Resilience Facility dedicates USD 149 billion to Poland, with more than one-fifth tagged for digital projects.[2]International Trade Administration, “Poland – Country Commercial Guide,” trade.gov Subsidized fiber backbones and tax credits for green builds reduce capex hurdles for data-center operators, allowing aggressive roll-outs in regions previously deemed unviable. Regulatory certainty improves after the Electronic Communications Act harmonizes local statutes with EU frameworks, accelerating permit approvals for ducting and dark-fiber leases. Public investment in 4,200 5G base stations multiplies edge-traffic that must backhaul into regional data hubs, stimulating orders for compact aggregation switches and SR-MPLS capable routers. As funds disperse over a multi-year horizon, integrators enjoy predictable demand pipelines that justify warehouse stocking of advanced optics.
5G-edge compute demand for local interconnect
European regulators anticipate 80% of workloads processing at the edge by 2025, making proximity networking a decisive factor.[3]BEREC Office, “Report on Cloud and Edge Computing Services,” berec.europa.eu T-Mobile Polska’s metro facilities, connected via low-loss fiber rings, validate telecom-data center convergence needed for latency-sensitive AR/VR and V2X applications. Vendors such as Cisco deploy Multi-Access Edge Computing blueprints that federate micro-pods under a single APIC domain, ensuring consistent policy enforcement. Demand for compact 1RU routers with full-table SR-v6 support grows as operators interlink street-level cabinets to regional cores. The Poland data center networking market thus captures incremental revenue from mobile operators pivoting toward edge disaggregation.
Restraints Impact Analysis*
| Restraint | (~) % Impact on CAGR Forecast | Geographic Relevance | Impact Timeline |
|---|---|---|---|
| Shortage of advanced networking talent | -2.4% | Nationwide, acute Warsaw and Kraków | Short term (≤2 years) |
| Rising electricity tariffs and grid congestion | -1.9% | Industrial corridors, metro Warsaw | Medium term (2-4 years) |
| Lengthy fibre-route permitting | -1.2% | Cross-regional and rural builds | Long term (≥4 years) |
| Import dependence for 800 G optics | -0.8% | National supply chain | Short term (≤2 years) |
| Source: Mordor Intelligence | |||
Shortage of advanced networking talent
More than half of European operators cannot recruit enough certified engineers for 400 G and 800 G deployments. Although Poland’s business-services headcount rose 3.8% year-on-year, only 21.2% of functions are automated, highlighting persistent skill gaps. Incoming Ukrainian specialists ease pressure, yet expertise in SONiC, SD-WAN scripting, and intent-based Fabric Controllers remains limited. Salary inflation surpasses 12% among senior network architects, inflating opex for managed-service providers. Training subsidies tied to EU funds are helping upskill 380,000 professionals, but the pipeline lags immediate project roll-outs, tempering near-term growth in the Poland data center networking market.
Rising electricity tariffs and grid congestion
Coal still underpins a significant share of Poland’s generation mix, exposing data-center operators to tariff volatility that erodes margin ceilings. Grid regulators increasingly reject new megawatt requests as distribution lines saturate with photovoltaic feed-in, compelling developers to bankroll substation upgrades that delay time-to-revenue. While on-site solar plus battery installations mitigate peak charges, capex climbs in tandem, straining ROI models. The government’s 72% renewables target by 2030 and planned nuclear blocks offer relief, but will not materially lower tariffs within the next two build cycles. Consequently, some hyperscalers hedge by pre-leasing sites in the Nordics, curbing upside for the Poland data center networking market during periods of acute power scarcity.
*Our forecasts treat driver/restraint impacts as directional, not additive. The impact forecasts reflect baseline growth, mix effects, and variable interactions.
Segment Analysis
By Component: Services Gain Ground amid Complex Upgrades
The component mix continues to tilt toward Services, forecast to grow 15.05% annually through 2031 as enterprises outsource design, deployment and lifecycle management. Services already streamline 24/7 operations, but AI-centric designs push dependency higher: orchestration tools must be tuned to react to non-deterministic east-west spikes, and micro-segmentation policies require continuous compliance audits. Installation and Integration teams now piece together 800 G transceivers, liquid-cooled switches and single-mode fiber runners inside three-phase power cages, a complexity rarely handled fully in-house. Training and Consulting revenues are propelled by Healthcare CIOs racing to conform with GDPR-aligned e-health records, while BFSI boards demand zero-trust architectures validated against EU Digital Operational Resilience Act. Support and Maintenance further expand because SLAs now stipulate five-minute fault-isolation windows, a bar impossible without remote telemetry analytics. Managed Network Services stand out: enterprises caught by the talent crunch pivot to NOC-as-a-Service contracts that bundle predictive AIOps dashboards and on-prem compliance reporting.
Products still make up 67.45% of 2025 revenue and remain indispensable as the Poland data center networking market size accompanies unavoidable silicon refreshes. Switch ASIC roadmaps deliver port-doubling every two years; thus leaf blocks purchased in 2023 cannot keep pace with 2025 GPUs hosting trillion-parameter models. High-capacity DWDM optics see brisk uptake because Poland’s backbone fibers approach fill rates. Power-aware routers that down-clock unused cores appeal to operators facing carbon-neutral pledges. Even with Services outpacing, Products’ dollar base expands as hyperscalers sign multi-year framework agreements locking in bulk discounts yet amplifying shipment volumes. Consequently, the Poland data center networking market sustains balanced growth; hardware churn funds the professional services envelope, while service engagements drive follow-on hardware cycles.



By End User: Healthcare Accelerates Digital Care Pathways
The Healthcare & Life Sciences vertical is on track for a 14.01% CAGR, the fastest in any sector. Polish hospitals deploy high-resolution tele-diagnosis, genomics analytics and robot-assisted surgery that demand deterministic latency and secure multi-site data replication. Integrators roll in redundant 400 G core spines and micro-segmented VLAN overlays to keep patient data within national borders yet universally reachable by authorized clinicians. Research centers tapping EU Horizon grants stitch GPU clusters across Kraków and Poznań, necessitating WAN fabrics with bandwidth-slicing and real-time telemetry. Thanks to these investments, the Poland data center networking market size attributed to Healthcare is projected to surpass USD 45.2 million by 2031.
IT & Telecommunications remains the largest spender, shouldering 35.92% of 2025 outlays as operators race to monetize 5G and fiber roll-outs. Edge POPs house scalable TOR pairs feeding Cloud-Native Network Functions; every base-band upgrade cascades into incremental switch and router orders. BFSI maintains strong share because Warsaw hosts many EU clearing houses whose algorithmic trading engines cannot tolerate microsecond jitter. Government & Defense invests aggressively in air-gapped networks aligned with NATO-classified traffic rulings. Meanwhile, Manufacturing lines installing machine-vision sensors integrate campus fabric extensions back to regional data hubs. Collectively, these dynamics keep the Poland data center networking industry diversified, cushioning any single-vertical downturn.
By Data-Center Type: Hyperscalers Recast Supply Chains
Colocation sites controlled 51.62% of 2025 revenue, a testament to Poland’s legacy as a disaster-recovery haven for German and Scandinavian firms. These facilities now bulk-up power halls to court AI start-ups that cannot justify proprietary builds. Conversely, Hyperscalers & Cloud Service Providers record a 16.38% CAGR, the fastest among all types. Their buying patterns prioritize leaf-spine fabrics with 800 G uplinks, open-gear BMC access and telemetry hooks for fleet-wide AIOps. Microsoft’s campus near Warsaw alone is expected to absorb thousands of 51.2 Tbps chassis switches once live, inflating short-run vendor backlogs.
Edge and Micro Data Centers, though starting from a small base, harness 5G traffic growth along Poland’s smart-port and smart-factory corridors. These units rely on low-power ARM servers and compact ToR switches supporting PTP for industrial control loops. As decentralised topologies proliferate, the Poland data center networking market adapts: vendors bundle turnkey pods including prefabricated cable harnesses, while leasing firms craft novel colocation-edge hybrids. Over the forecast horizon, hyperscalers drive volume, but colocation keeps portfolio resilience by integrating cross-connect fabrics and sovereign cloud meet-me rooms for regulated verticals.
By Bandwidth: Greater than 100 GbE Surges with AI East-West Traffic
AI clusters working on large-language models flood east-west paths, pushing operators beyond 50-100 GbE’s 35.88% deployment dominance toward greater than 100 GbE links graduating at a 15.53% CAGR. 400 GbE leaf-pairs feed 800 GbE spine fabrics, enabling non-blocking topologies for thousands of GPUs. Fiber cost economics tilt in favor of higher-speed optics because per-bit pricing falls even as module tariffs climb. Poland’s HPC Competence Centre hitting 14th worldwide in server capacity demonstrates upstream demand for terabit lanes linking compute to NVMe-oF arrays.
Legacy less than or equals to 10 GbE builds contract as support contracts lapse and OEMs cease firmware updates. 25-40 GbE remains transitional: regional universities pair them with 100 GbE uplinks to stretch budgets until EU grants finalize. The Poland data center networking market, therefore, enters a replacement super-cycle that benefits transceiver suppliers ramping 400ZR+ modules and line-card vendors shipping 51.2 Tbps ASICs. Optical component import dependence remains a risk, yet local fiber cabling plants partially offset logistics delays by pre-terminating high-fiber-count bundles onshore.
Geography Analysis
Warsaw commands roughly 39.45% of national installed capacity, totaling 142 MW online and 109 MW in pipeline builds, owing to its confluence of financial institutions, tech start-ups, and superior peering routes. Sub-1 ms latency to Frankfurt and Prague exchanges positions Warsaw as a low-latency alternative for trading workloads that cannot risk trans-Alpine fiber cuts. Power availability remains tighter than land supply, incentivising first-movers to secure grid allocations years in advance. Municipal incentives covering property-tax abatements and fast-track permits further anchor the Poland data center networking market inside the capital.
Kraków, Poznań,ń and Wrocław rise as secondary hubs, each leveraging university ecosystems that churn out STEM graduates and host regional innovation parks. T-Mobile Polska’s tri-city metro interconnect proves the viability of federated data-center meshes where latency budgets tolerate 3–5 round-trip trips. Poznań’s PIONIER backbone upgrade, co-financed by EU research funds, injects 500 next-gen routers across 21 city rings, extending enterprise IX reach and spurring colocation fills. Kraków’s historic coal infrastructure repurposed into renewable micro-grids seduces ESG-driven tenants seeking green PPAs to offset Warsaw’s fossil-heavy mix.
Eastern Poland, historically underserved, gains traction as EU digital-transition grants target gigabit broadband builds along the Lublin–Rzeszów corridor, laying groundwork for edge nodes serving cross-border low-latency links into Ukraine. Local authorities bundle land concessions with district-heating tie-ins for waste-heat reuse, trimming PUE, and aligning with EU taxonomy rules. As these regions emerge, the Poland data center networking market benefits from diversified demand, de-risking reliance on Warsaw while opening new reseller channels for mid-range switching gear.
Regulatory Landscape
Poland’s data center networking environment is shaped by telecom, cybersecurity, and energy-connection rules that affect fiber builds, interconnect choices, and resilient network design. The Electronic Communications Act enacted in November 2024 aligned national telecom regulation with EU frameworks, supporting more standardized processes for ducting, dark-fiber leasing, and carrier interconnection that underpin data center connectivity. Cybersecurity governance is split across sector authorities, with the Office of Electronic Communications (UKE) overseeing telecom-related matters and the Polish Financial Supervision Authority (KNF) influencing requirements for regulated BFSI networks, while the Ministry of Digital Affairs supports national incident-response capability through CSIRT Cyfra.
Permitting and power access remain key regulatory variables for data center projects that drive switching, routing, and optical upgrades. Data center investments can also trigger national security-related foreign direct investment screening and merger control, affecting ownership structures and large-scale capacity transactions. On the power side, regulatory signals in 2024 around grid connection conditions, including guidance attributed to the Energy Regulatory Office (URE) leadership, reinforced expectations that connection refusals be justified on objective grounds, keeping grid-access transparency central to project planning for high-density networking deployments.
Value Chain Analysis
The value chain for Poland data center networking spans global OEM hardware and optics suppliers, Polish and multinational distributors, local system integrators, and data center operators (colocation, hyperscale, and telecom edge) that procure and operate network fabrics. Core switching, routing, security appliances, and SDN platforms are largely sourced from global vendors, while Polish integrators and managed service providers handle design, installation, automation, and lifecycle operations aligned with enterprise compliance and SLA requirements. Industry coordination has also become more structured, with the Polish Data Center Association (PLDCA), founded in May 2023, representing 45+ companies across site acquisition, design engineering, general contracting, and facility management.
Execution increasingly depends on local capability to shorten lead times and reduce delivery risk across multi-site rollouts. PLDCA materials indicate that 57% of the domestic data center value chain is made up of local entities or firms with production facilities in Poland, supporting resilience for cabling, integration, and facility-layer components adjacent to networking. Activity is distributed across Warsaw, Wroclaw, Poznan, Gdansk, Krakow, and Rzeszow, enabling regional staging of integration teams and spares for high-speed optics, fabric switches, and edge aggregation builds, even as advanced 400/800 GbE optics and some specialized components remain import-dependent.
Competitive Landscape
Global OEMs dominate core switch and router shipments; Cisco retains the lead due to the widest product span and incumbent relationships dating back two decades. Arista chips away in AI fabrics by marketing 800 G-ready line cards bundled with latency-aware EOS software. Juniper leverages automation credentials, though its planned USD 14 billion merger with HPE faces U.S. antitrust scrutiny that, if approved, could create a powerful challenger pairing Silicon Photonics with unified compute stacks. Such consolidation prompts Polish channel partners to reassess vendor diversification, seeking to avoid single-vendor lock-in for sovereign cloud tenders.
Local integrators, including Asseco Data Systems and Comarch, capitalize on knowledge of Polish procurement law and multilingual support needs. They package foreign-made hardware with managed SOC services adapted to EU GDPR and upcoming NIS2 mandates, winning contracts in provincial hospitals and utilities. Niche optical specialists like Salumanus supply CWDM/DWDM optics tailored for Warsaw metro fiber runs, adding value through rapid RMA and localized wavelengths planning.
Sustainability steers competitive messaging: vendors now publish Scope 3 emissions and offer lifecycle carbon calculators to differentiate bids. Liquid-cool-ready switches and SmartNIC offload cards promise 20% energy savings, aligning with tenants’ RE100 pledges. Meanwhile, cloud on-ramps proliferate: Equinix Fabric and Megaport extend virtual interconnect to Microsoft Azure Warsaw region, intensifying competition among carrier-neutral facilities. Overall, the Poland data center networking market rewards players delivering open architectures, automation depth and credible green-energy roadmaps.
Poland Data Center Networking Industry Leaders
Cisco Systems
Juniper Networks
Huawei Technologies
Arista Networks
Dell Technologies
- *Disclaimer: Major Players sorted in no particular order

Market Opportunities and Future Outlook
A primary whitespace area sits at the intersection of grid access, sustainability, and high-density AI networking, where power procurement and connection certainty increasingly determine the pace of fabric upgrades. Cisco’s long-term renewable energy procurement in Poland via a virtual PPA with R.Power, announced in 2026 and later finalized, illustrates how vendors and large operators are working around electricity price volatility and carbon constraints. This is creating pull for energy-aware networking, telemetry, and automated capacity management. Poland’s positioning as a Central and Eastern Europe hub, supported by lower operating costs, cool climate advantages, and fiber connectivity, keeps demand focused on scalable interconnect, 400/800 GbE switching, and optical transport to connect Warsaw with secondary metros.
Policy actions in 2026 also create identifiable opportunity lanes for network vendors and integrators supporting customer compliance while modernizing infrastructure. The Council of Ministers adoption of Resolution No. 130 in June 2026, establishing the first State Digitalisation Strategy, ties digital infrastructure to national security and economic development, reinforcing demand for sovereign-ready architectures (segmentation, encryption, and robust operational monitoring). In addition, the March 2026 Energy Law amendment (Journal of Laws item 516) targeting grid connection bottlenecks by addressing non-advancing projects supports clearer capacity allocation for viable developments, which can translate into more bankable build pipelines for new halls and metro expansions that require fresh switching, routing, and optical interconnect orders.
Recent Industry Developments
- July 2026: Cisco Systems finalized a 15-year virtual Power Purchase Agreement (vPPA) with renewable developer R.Power to supply power for its Polish operations, tied to four new solar projects totaling 470 GWh. The launch expands renewable energy sourcing for Poland data center operations.
- May 2026: Cisco Systems signed a 15-year virtual Power Purchase Agreement (vPPA) with Polish renewable developer R.Power to procure power for its Polish operations. The arrangement anchors long-term renewable energy supply and signals green commitment for the regional data center footprint.
- February 2026: Cisco Systems announced plans to build a 4MW data center and R and D laboratory in Krakow with a 200 million PLN investment, to be completed by mid-2026. The project enhances Poland as a regional tech hub and expands the AI and data center networking capabilities.


Research Methodology Framework and Report Scope
Market Definition and Coverage
This market covers spending in Poland on networking products and related services used inside data centers to connect servers, storage, and external networks, covering both new builds and upgrades in operating sites.
Scope exclusions: It excludes general enterprise campus networking that is not deployed in a data center environment, even if sold by the same suppliers.
Segmentation Overview
- By Component
- Products
- Ethernet Switches
- Routers
- Storage Area Network (SAN)
- Application Delivery Controllers (ADC)
- Network Security Appliances
- Software-Defined Networking (SDN) Controllers
- Optical Interconnects
- Services
- Installation and Integration
- Training and Consulting
- Support and Maintenance
- Managed Network Services
- Products
- By End-User
- IT and Telecommunications
- Banking, Financial Services and Insurance (BFSI)
- Government and Defense
- Media and Entertainment
- Healthcare and Life Sciences
- Manufacturing and Industrial
- Other End-Users
- By Data-Center Type
- Colocation
- Hyperscalers/Cloud Service Providers
- Edge/Micro Data Centers
- By Bandwidth
- Less Than equals to 10 GbE
- 25–40 GbE
- 50–100 GbE
- Greater Than 100 GbE
Data Sources, Market Sizing, and Validation
Desk Research
Desk work started with building a Poland demand context for data centers and connectivity, so the model inputs have a real-world anchor. We relied on public and official sources such as Statistics Poland (GUS) for ICT and business indicators, Eurostat for digital economy time series, the EU Digital Economy and Society Index (DESI) for adoption signals, and UKE (Poland telecom regulator) publications for broadband and network infrastructure facts.
To convert those signals into networking demand, we reviewed standards and technical references (including IEEE and IETF materials) to keep bandwidth and port-speed assumptions realistic. We also used company filings, investor presentations, and reputable press to capture project timing and refresh cycles. Where useful, paid subscriptions for company financials, patent intelligence, and shipment-level trade tracking were used to sanity check supplier presence and equipment flow patterns. The sources listed here are illustrative and not exhaustive, since many other references were used for data collection, clarification, and cross-checking.
Primary Interviews and Surveys
We use expert interviews and surveys with data center operators, network equipment distributors, integrators, cloud infrastructure specialists, and enterprise technology leaders in Poland. Responses help validate capacity, bandwidth upgrades, pricing, procurement timing, and service demand, while filling gaps in public disclosures. Conflicting responses are rechecked before assumptions and final results are accepted.
Distribution of primary research fieldwork respondents
| Company type | Respondent position |
|---|---|
| Top tier: 30% | CXOs: 15% |
| Mid tier: 50% | Functional/Unit leaders: 30% |
| Smaller Players: 20% | Managers: 55% |
Market-Sizing & Forecasting
Sizing began with a top-down build that translates Poland data center activity into networking demand, by reconstructing the addressable equipment and service pool linked to data center expansions and in-life upgrades. The model was then corroborated using selective bottom-up approximations, such as supplier revenue disclosures that can be attributed to Poland, channel checks on typical bill-of-material splits, and sampled ASP-by-volume math for key device families.
Inputs were chosen because they can be checked and rechecked over time. In practice, items such as new data center capacity additions and upgrade cycles, the mix of colocation versus hyperscale build-outs, typical network architecture needs (including leaf-spine density), bandwidth requirements by workload, and the shift in port speeds were used as practical drivers. When gaps appeared, ranges were built from interview feedback and then narrowed after cross-checking against trade flows and publicly visible project announcements.
Forecasts were produced using scenario analysis, where build pipelines, refresh cadence, and speed migration assumptions are varied, and then the most likely case is selected based on what primary respondents consider realistic for Poland over the next few years. Trend lines were kept stable unless there was a clear trigger, such as a step-change in data center commissioning activity or a meaningful change in buyer preference for managed networking services.
Data Validation & Update Cycle
Outputs were tested through multiple checks so the final numbers do not depend on any single dataset. We compared results against independent signals such as data center build timing, observed equipment trade patterns, and interview-based reality checks on typical spend per site size. Any unusual jumps were reviewed before sign-off.
A second analyst review is completed for key assumptions, and re-contacts are triggered when variances show up by product or end-user group. Reports are refreshed annually, and interim updates are made if a material event changes the outlook. Before delivery, a final pass is done to make sure the latest public information is reflected in the estimates.
Mordor Intelligence's Poland Data Center Networking Market Size Compared Against Other Published Estimates
Published market values can look far apart even when they use similar sounding titles, because the underlying scope and demand pool can be set up differently. In this space, the largest causes are usually whether cloud networking services are blended with data center networking, whether colocation service revenues are counted as part of networking, and how each source handles multi-year project timing.
Observed data center build announcements, connectivity and bandwidth signals, and interview validation on speed migration are the checks that keep Mordor Intelligence aligned to in-data-center products plus networking services. This approach avoids pulling in broader cloud networking subscriptions or colocation rental revenues that sit outside this market.
Benchmark comparison
| Source | Market Size | Gaps in Research Methodology |
|---|---|---|
| Mordor Intelligence | USD 150.23 M (2025) | |
| Global Consultancy A | USD 721.40 M (2024) | This figure tracks cloud networking services across industries, so recurring cloud service spend (security enforcement, managed cloud WAN, traffic optimization) is included beyond data center networking equipment and site-level services in Poland. |
| Industry Research B | USD 463.36 M (2025) | This estimate is for colocation market revenues, which mainly reflect leased space and power services. It can overstate networking by capturing facility service charges that are not dedicated networking product or networking service spend. |
The comparison shows that the spread is mostly a scope boundary issue, not just a different math style. By keeping the market tied to data center networking products and associated services, and then validating with build activity and buyer-reported refresh behavior, the model stays easier to replicate and interpret year after year.


Key Questions Answered in the Report
What is the current value of the Poland data center networking market?
The Poland data center networking market is valued at USD 169.6 million in 2026 and is projected to reach USD 310.7 million by 2031.
Which factors contribute most to market growth?
Hyperscale cloud investments, AI-driven 400/800 GbE upgrades and EU digital-transition funding together add more than 8% to forecast CAGR.
Which component segment is expanding the fastest?
Services are growing at a 15.05% CAGR through 2031 as enterprises outsource installation, integration and managed network operations.
What bandwidth category shows the highest growth rate?
100 GbE links will scale at a 15.53% CAGR, driven by AI workloads that overwhelm legacy 50-100 GbE deployments.
Which end-user vertical is the most dynamic?
Healthcare and Life Sciences lead with a 14.01% CAGR thanks to telemedicine, genomics and AI-assisted diagnostics needing low-latency networks.
Why is Warsaw the primary data center hub in Poland?
Warsaw hosts 142 MW of operational capacity, enjoys sub-1 ms latency to major EU exchanges and attracts large cloud providers, including Microsoft’s USD 700 million build.
Page last updated on:
- Data Center Power Market Power systems worldwide, split by component, tier and facility size.
- Artificial Intelligence (AI) Data Center Market Global AI facilities demand, split by facility type, component and tier.
- Data Center Cooling Market Cooling worldwide, split by cooling technology, cooling component and facility type.
- Poland Hyperscale Data Center Market Hyperscale sites in Poland, split by facility type, component and tier.
- Poland Data Center Power Market Poland power systems, split by component, facility type and facility size.
- Data Center Accelerator Market Accelerators across all regions, split by processor type, application and deployment model.
- Global Data Center Physical Security Market Physical security worldwide, split by solution type and service type.
- Indonesia Data Center Power Market Power systems in Indonesia, split by component, facility type and facility size.
- Poland Data Center Rack Market Racks demand across Poland, covering rack size, rack type and tier.
- Indonesia Data Center Processor Market Indonesia processors, split by processor type, application and architecture.
- North America Data Center GPU Market North America GPUs, split by deployment type, gpu type and interconnect.





