
Technology, Media and Telecom
5th MayPricing Strategy for Semiconductor Components
3 Min Read
The Netherlands Data Center Networking Market Report Segments the Industry Into Components (By Product, by Services), End-Users (IT & Telecommunication, BFSI, Other End-Users). Data-Center Type(Colocation, Hyperscalers/Cloud Service Providers, and More). And Bandwidth( ≤10 GbE, 25–40 GbE, and More). The Market Forecasts are Provided in Terms of Value (USD).
Market Overview
| Study Period | 2020 - 2031 |
|---|---|
| Base Year For Estimation | 2025 |
| Forecast Data Period | 2026 - 2031 |
| Market Size (2026) | USD 0.99 Billion |
| Market Size (2031) | USD 1.14 Billion |
| Growth Rate (2026 - 2031) | 2.87 % CAGR |
| Market Concentration | Medium |
Major Players *Disclaimer: Major Players sorted in no particular order. Image © Mordor Intelligence. Reuse requires attribution under CC BY 4.0. |
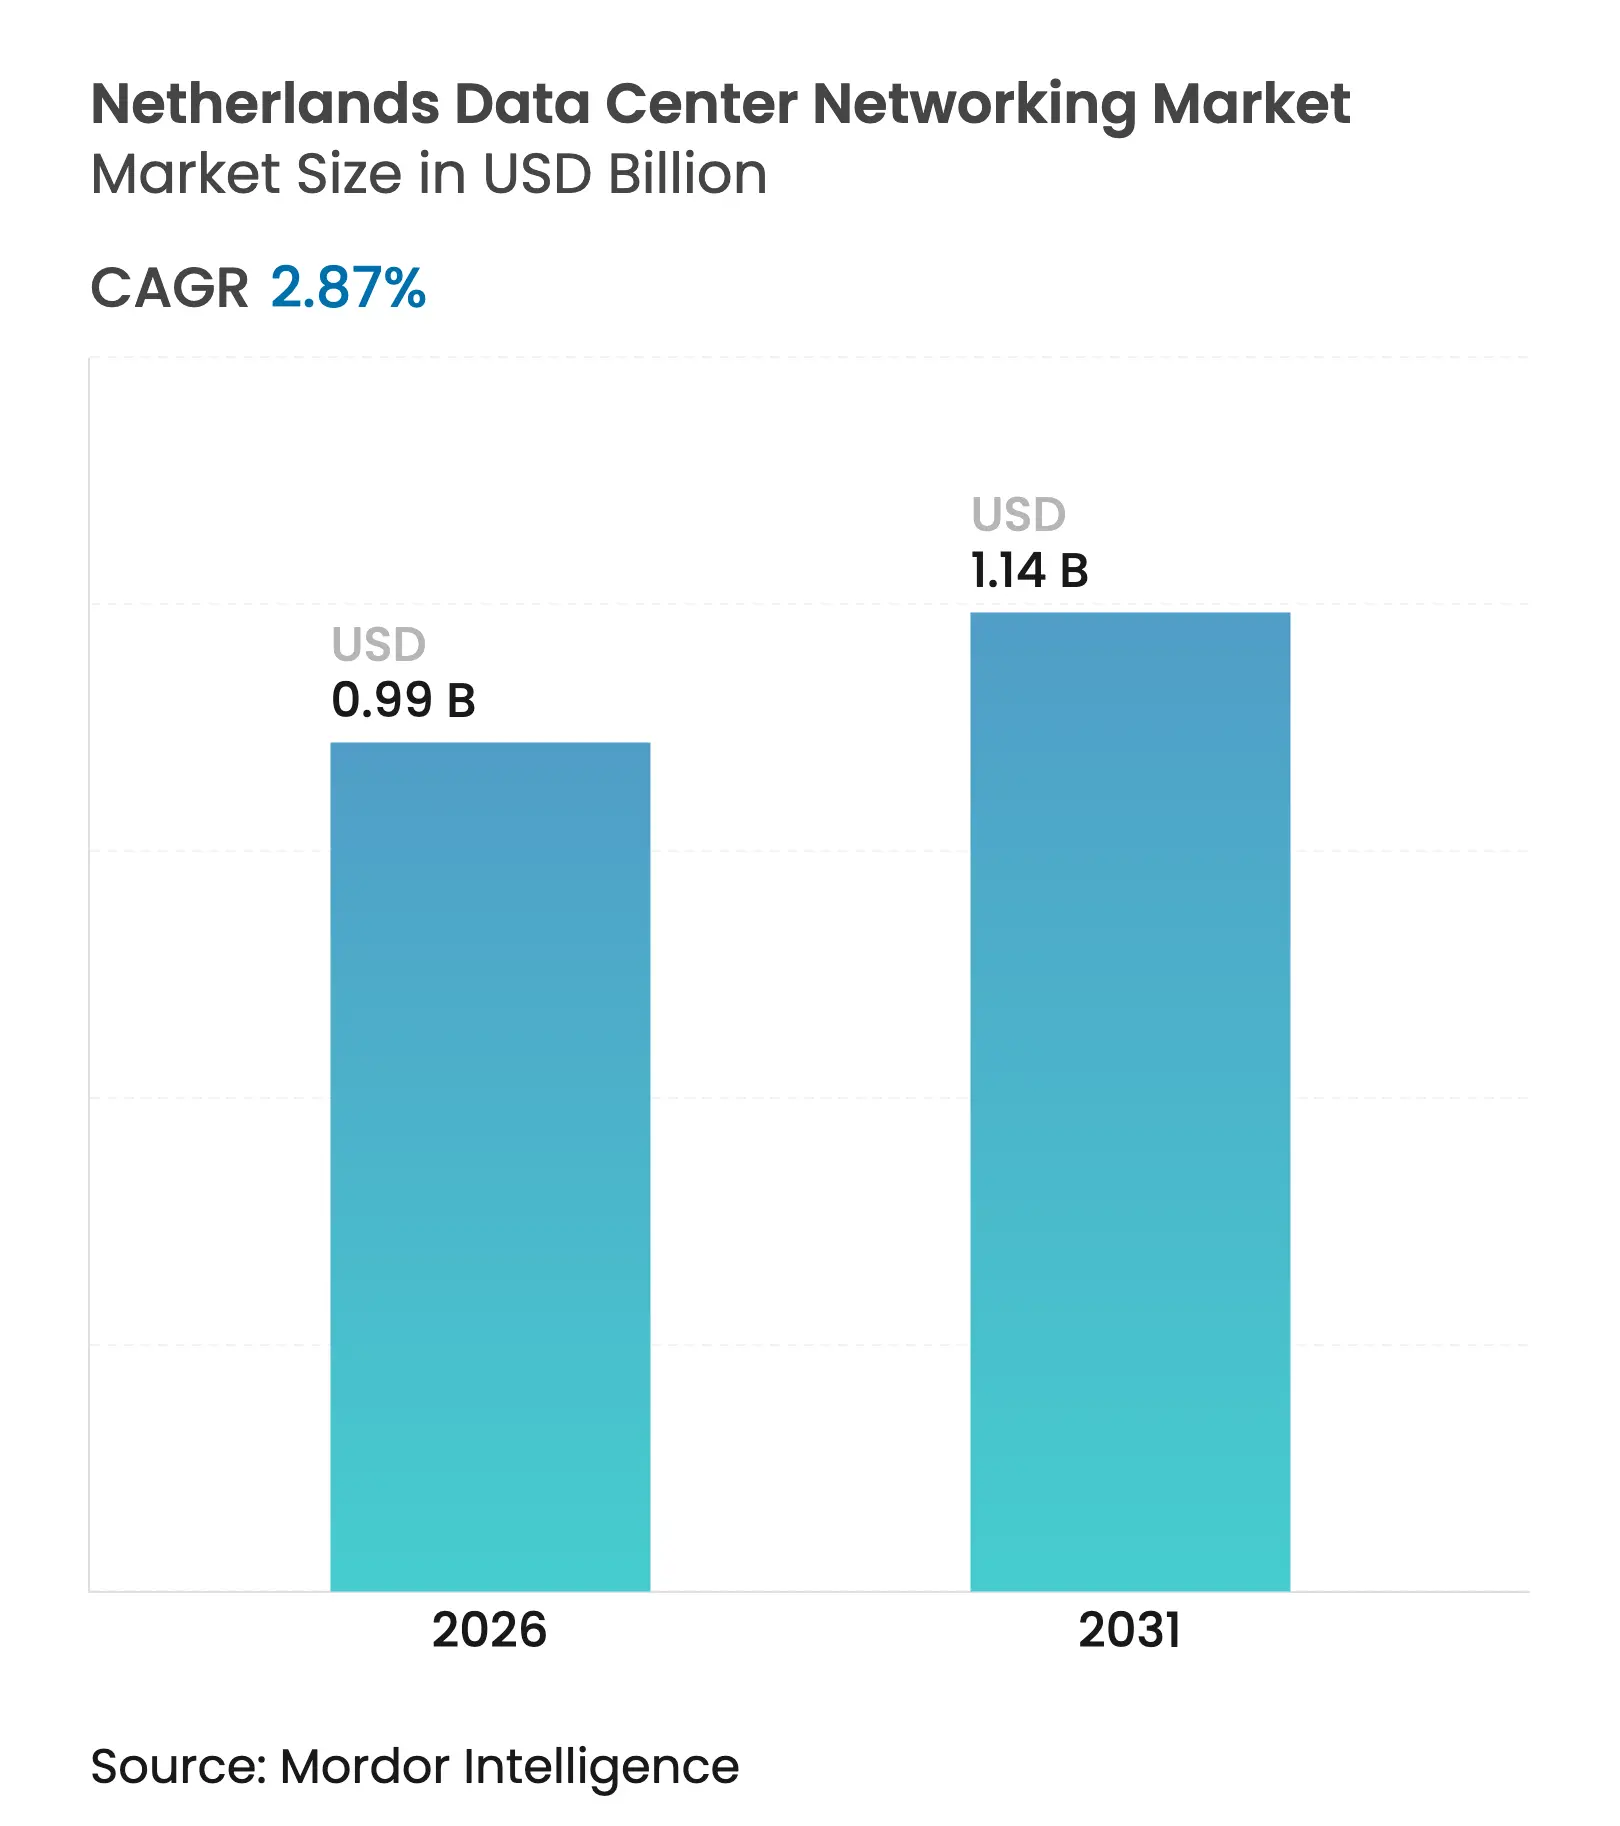
Netherlands data center networking market size in 2026 is estimated at USD 0.99 billion, growing from 2025 value of USD 0.96 billion with 2031 projections showing USD 1.14 billion, growing at 2.87% CAGR over 2026-2031. This steady trajectory reflects a maturing landscape shaped by grid-congestion rules, nitrogen-emission caps and limited land availability. Even so, shifts toward 400G and 800G optical interconnects, edge-computing roll-outs and sustainability mandates are reshaping capital-spending priorities across Amsterdam’s dense cluster of more than 200 facilities. Product sales continue to dominate but managed and professional services grow faster as operators confront skills shortages and regulatory complexity. High-speed upgrades, AI workload traffic patterns and free-air cooling advantages keep the Netherlands data center networking market on a measured yet resilient growth path.
Key Report Takeaways
Note: Market size and forecast figures in this report are generated using Mordor Intelligence's proprietary estimation framework, updated with the latest available data and insights as of 2026.
Drivers Impact Analysis
| Driver | (~) % Impact on CAGR Forecast | Geographic Relevance | Impact Timeline | |||
|---|---|---|---|---|---|---|
Increasing utilization of cloud
storage
Increasing utilization of cloud
storage
| +0.8% | National, spillover across EU | Medium term (2-4 years) |
(~) % Impact on CAGR Forecast
:
+0.8%
|
Geographic Relevance
:
National, spillover across EU
|
Impact Timeline
:
Medium term (2-4 years)
|
Rising need for backup and storage
Rising need for backup and storage
| +0.6% | Amsterdam metro | Short term (≤ 2 years) | |||
Expansion of hyperscale facilities
Expansion of hyperscale facilities
| +0.5% | Amsterdam region | Long term (≥ 4 years) | |||
Growing adoption of edge computing
Growing adoption of edge computing
| +0.7% | National cities | Medium term (2-4 years) | |||
Government “Digital Gateway”
incentives
Government “Digital Gateway”
incentives
| +0.4% | Nationwide | Long term (≥ 4 years) | |||
Cold climate enabling free-air cooling
Cold climate enabling free-air cooling
| +0.3% | Northern provinces | Long term (≥ 4 years) | |||
| Source: Mordor Intelligence | ||||||
Increasing Utilization of Cloud Storage
Enterprise migration to hybrid and multi-cloud platforms is redirecting traffic flows from north-south to east-west, forcing operators to upgrade switching fabrics and optical backbones. Google’s continued capital spending in the province underscores sustained hyperscale confidence despite a construction moratorium. New cloud nodes require automation, multitenant segmentation and zero-trust overlays that elevate demand for software-defined networking appliances capable of line-rate encryption at 400G. These requirements keep the Netherlands data center networking market firmly oriented toward high-bandwidth, low-latency designs that can interconnect regional zones and cross-border exchanges.
Rising Need for Backup and Storage
The Digital Operational Resilience Act (DORA) entered force in January 2025, imposing stricter recovery-time objectives on 22,000 financial entities across the bloc. Dutch banks now invest in redundant 100 GbE replication links between production and disaster-recovery sites inside the country to satisfy local-data-sovereignty clauses. Simultaneously, healthcare providers adopt continuous-data-protection architectures that stream datasets to secondary clouds, lifting aggregate bandwidth and pushing switch port densities toward 800 GbE. These compliance-driven transfers accelerate services revenue because in-house teams cannot scale quickly enough to engineer multi-cloud failover meshes.
Expansion of Hyperscale Facilities
A cap on projects above 70 MW forces hyperscalers to squeeze more compute per rack and retrofit legacy halls with liquid-cooled AI clusters. Doing so requires shorter optical runs at 400G and 800G, higher-density leaf-spine fabrics, and advanced congestion-management telemetry. Iron Mountain’s newest 10 MW Amsterdam hall proves that compact, renewable-powered expansions remain feasible when networking gear delivers up to 4 Tb/s per RU, mitigating real-estate limitations.[1]Iron Mountain, “Iron Mountain Expands Amsterdam Data Center Capacity,” ironmountain.comThe Netherlands data center networking market, therefore, benefits from hyperscaler purchasing power even in a constrained build cycle.
Growing Adoption of Edge Computing
Mobile operators extend 5G standalone cores and multi-access edge compute nodes into Rotterdam, Utrecht and Eindhoven. KPN demonstrated sub-5 ms round-trip latency once workloads executed locally, a metric unattainable without hardened, sub-rack switches that survive temperature swings and accept 48 VDC feeds. Enterprises follow suit, deploying micro-data-centers inside factories to enable real-time analytics for autonomous robots. Each site still peers with Amsterdam’s internet exchanges, so network operators integrate centralized orchestration to manage distributed fabrics, fuelling demand for managed services.
Restraints Impact Analysis
| Restraint | (~) % Impact on CAGR Forecast | Geographic Relevance | Impact Timeline | |||
|---|---|---|---|---|---|---|
Lack of skilled networking
professionals
Lack of skilled networking
professionals
| -0.7% | Nationwide, acute in Amsterdam | Medium term (2-4 years) |
(~) % Impact on CAGR Forecast
:
-0.7%
|
Geographic Relevance
:
Nationwide, acute in Amsterdam
|
Impact Timeline
:
Medium term (2-4 years)
|
Escalating Dutch energy tariffs
Escalating Dutch energy tariffs
| -0.5% | Nationwide | Short term (≤ 2 years) | |||
Nitrogen-emission permit delays
Nitrogen-emission permit delays
| -0.4% | Nationwide | Long term (≥ 4 years) | |||
Optical-transceiver supply geopolitics
Optical-transceiver supply geopolitics
| -0.3% | Global with EU focus | Medium term (2-4 years) | |||
| Source: Mordor Intelligence | ||||||
Lack of Skilled Networking Professionals
The country faces the EU’s highest ratio of shortage occupations, including software-defined-networking engineers and optical-layer specialists. Operators compensate by outsourcing configuration tasks and by adopting intent-based automation tools that translate application policies into switch configurations, fueling the Services boom. The scarcity raises labor costs, lengthens migration projects and tempers the Netherlands data center networking industry’s ability to accelerate refresh cycles.
Escalating Dutch Energy Tariffs
Residential and commercial electricity prices spiked to 401 EUR/MWh in 2024, and although wholesale rates moderated in 2025, volatility remains significant. Data-center operators, therefore, scrutinize power draw at the transceiver and ASIC level, preferring linear pluggable optics that consume less than half the wattage of DSP-based parts. High tariffs curb immediate adoption of the most power-hungry 1.6 Tb/s switch silicon, delaying the upper end of the bandwidth migration curve.
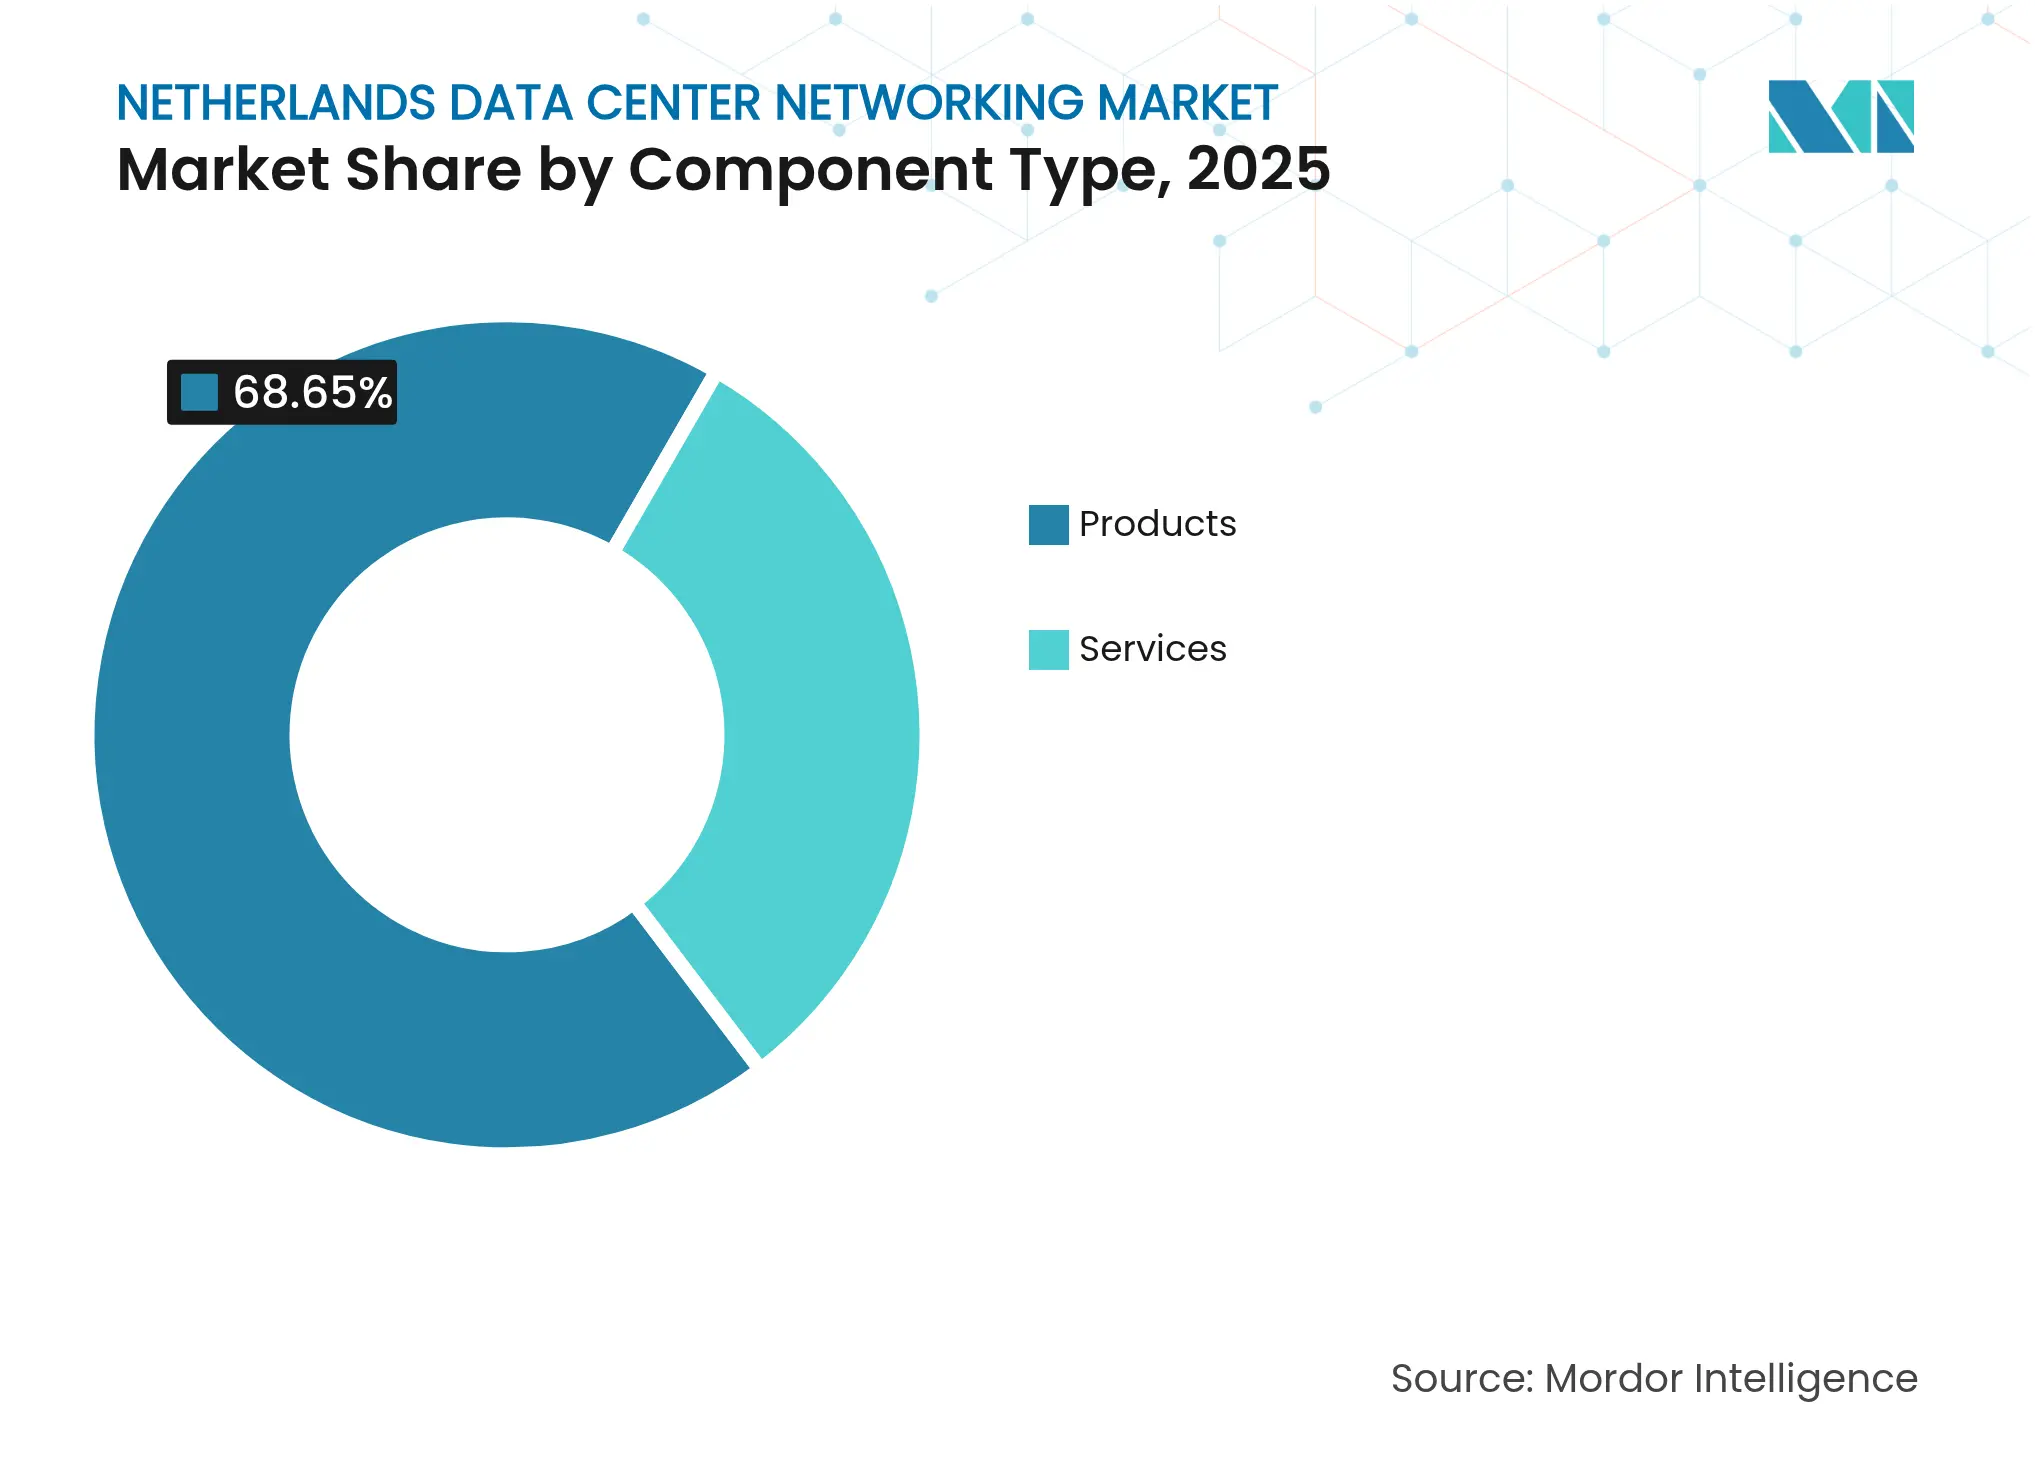
By Component: Services Accelerate Amid Infrastructure Complexity
The Services segment generates a 6.18% CAGR through 2031 as operators compensate for talent shortages and compliance burdens. Managed network services now bundle proactive monitoring, firmware lifecycle management and zero-trust segmentation. Consulting practices advise hyperscalers on how to retrofit cold-plate cooling and integrate 400G fabrics without triggering new-build permits. Installation teams deploy spine-leaf architectures pre-cabled with eight-lane parallel fiber to enable seamless 800G roll-outs later in the decade. Meanwhile, Products retain 68.65% of 2025 revenue because switches, routers and optical transceivers remain core to every refresh in the Netherlands data center networking market.
Demand for AI fabric upgrades accelerates purchases of 51-Tbit spine switches using 5-nm ASICs, while field-programmable DPU cards offload security from CPU cores. The Netherlands data center networking market size tied to hardware equals USD 0.66 billion in 2025, yet services margins climb faster, reinforcing operator preference for consumption-based models. Enterprises previously hesitant to outsource layer 2/3 operations now embrace co-managed contracts that guarantee sub-20 ms inter-AZ latency across Amsterdam and Frankfurt.
Note: Segment shares of all individual segments available upon report purchase
By End-User: Healthcare Transformation Drives Networking Demand
IT & Telecommunications held 33.10% of 2025 spending thanks to hyperscaler refresh cycles and telco 5G backhaul upgrades. Banking and insurance buyers accelerate budgets to comply with DORA, allocating funds for dual-active data centers linked via deterministic 100 GbE paths. The healthcare sector, however, records a 5.52% CAGR as hospitals implement EU-wide electronic-health-record interoperability under the European Health Data Space. Secure, low-packet-loss fabrics become mandatory to safeguard diagnostic imaging transfers exceeding 5 TB daily.
Life-sciences labs in Leiden Bio Science Park deploy micro-data-centers with GPU clusters for genomic analytics, creating edge-to-core traffic that strains legacy 10 GbE links. Upgrades to 100 GbE at aggregation layers, therefore, represent one of the fastest niche growth vectors within the Netherlands data center networking market. Government departments adopt quantum-safe VPN gateways in anticipation of post-quantum cryptography mandates coming in 2028, adding another layer of complexity that favors managed-security providers.
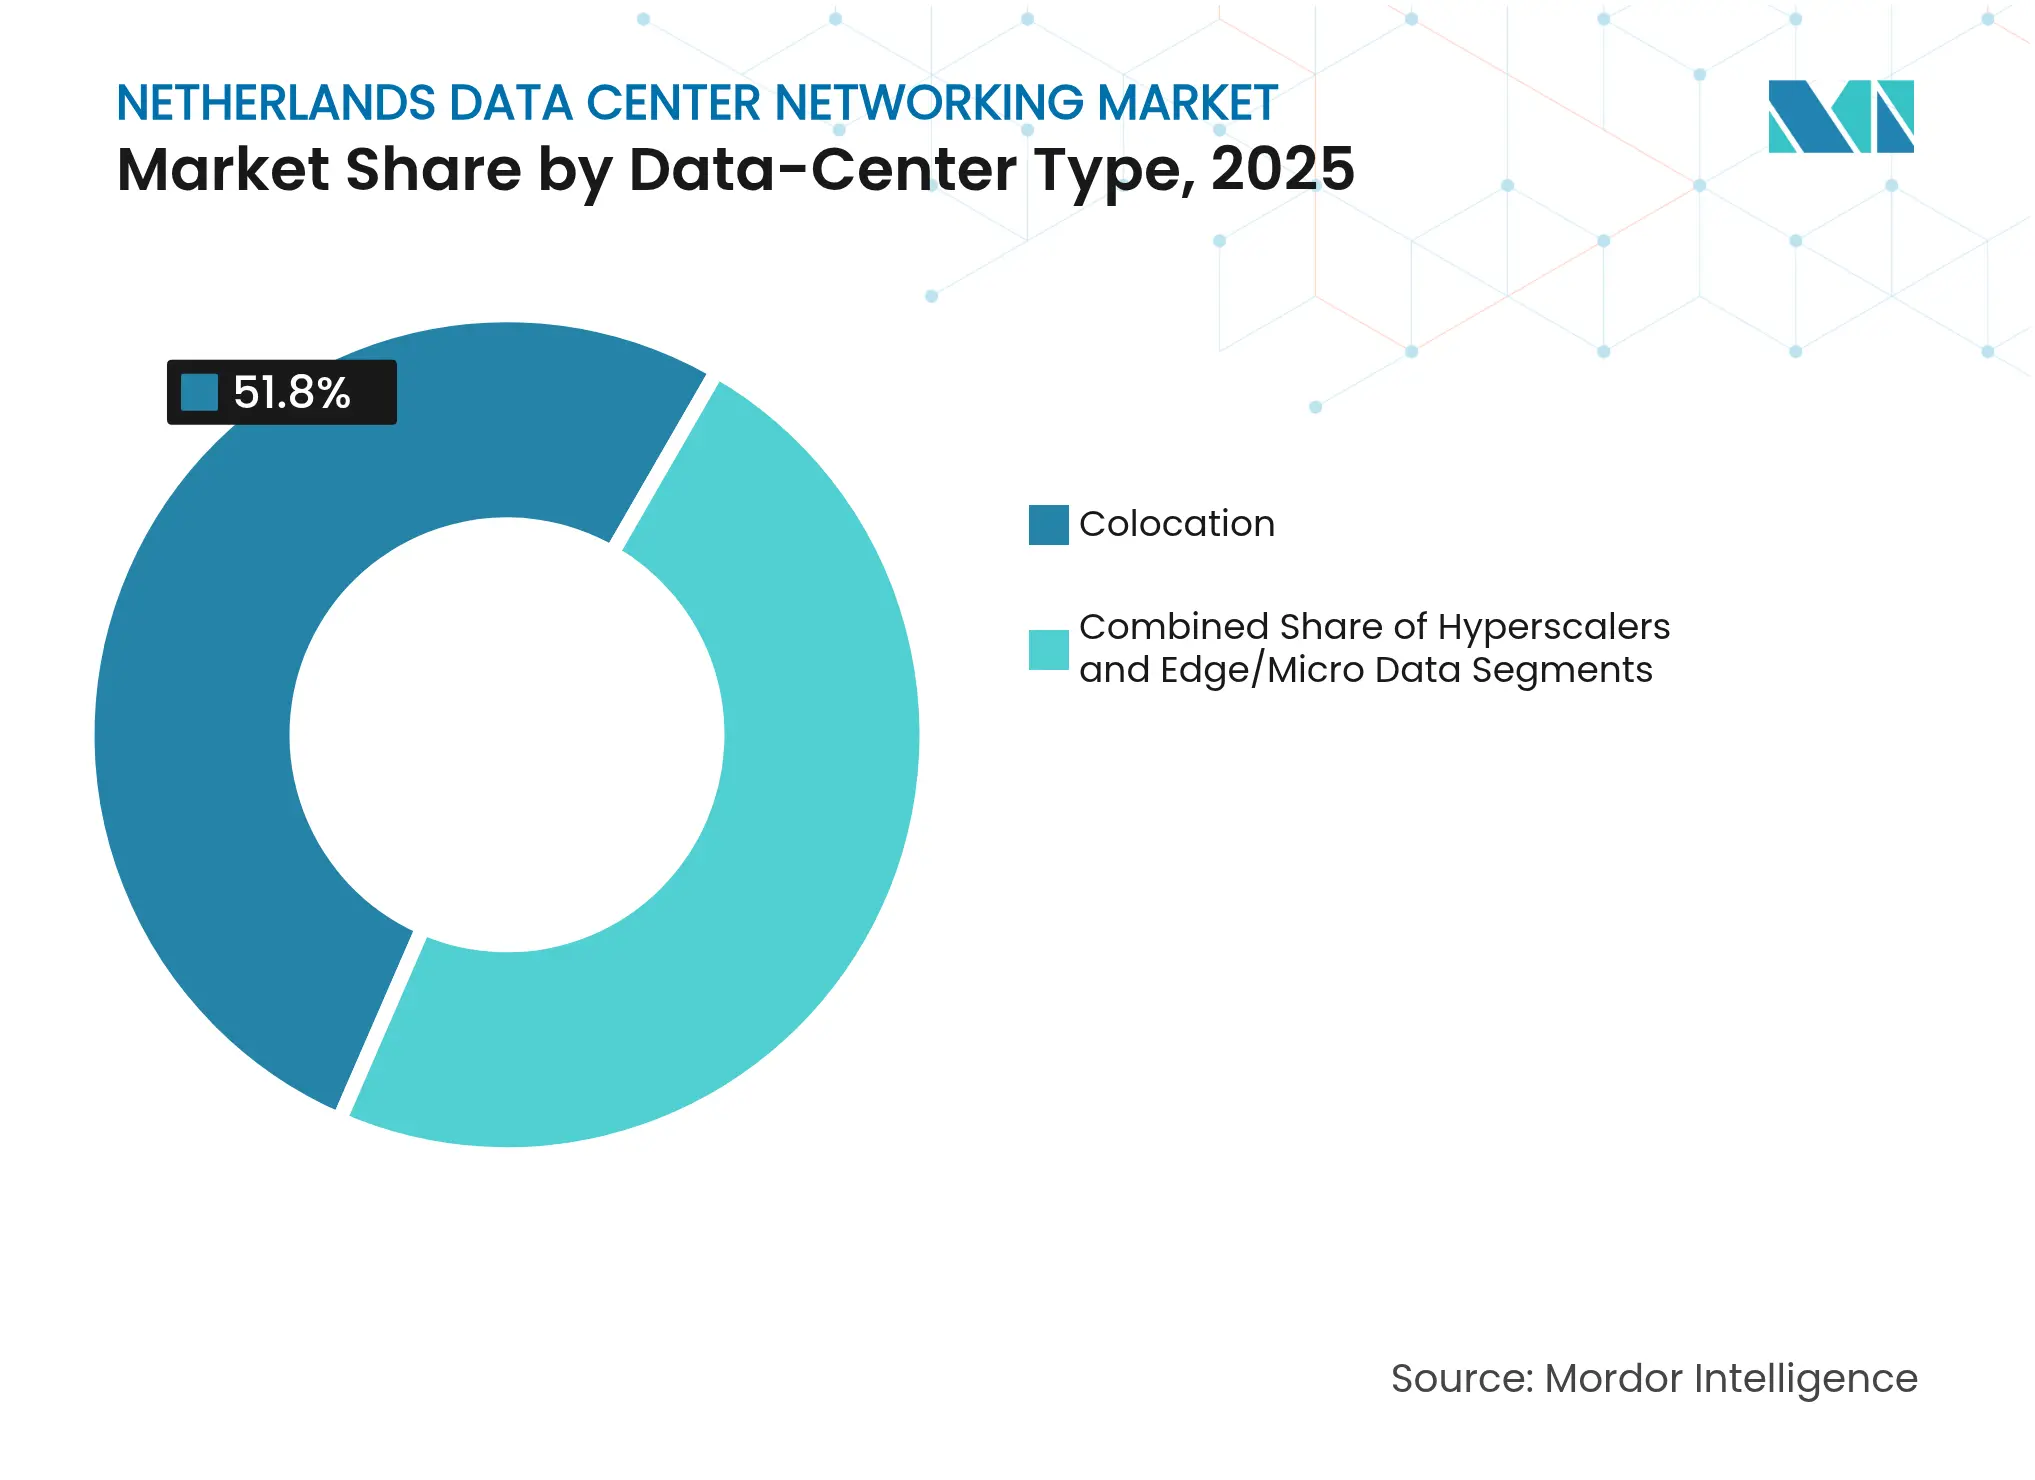
By Data-Center Type: Hyperscalers Accelerate Despite Constraints
Colocation keeps 51.80% revenue in 2025 because enterprise clients seeking sovereign hosting prefer neutral facilities along the A10 ring road. Operators add redundant 400G paths to AMS-IX, DE-CIX and LINX to serve multi-national clients. Yet hyperscalers and cloud providers register the fastest 8.07% CAGR as they retrofit existing campuses. CoreWeave’s EUR 2.2 billion European expansion earmarks Amsterdam for GPU-dense pods delivering 30 kW per rack powered by direct-to-chip cooling CoreWeave. Each pod needs ultra-low-latency 800G fabrics, lifting average port speeds well above the regional norm.
Edge and micro-data-centers proliferate under 5 kW-to-15 kW footprints near mobile-tower hubs, hosting MEC platforms from Ericsson and Nokia. They choose 25 GbE or 50 GbE top-of-rack switches with 100 GbE uplinks, illustrating how the Netherlands data center networking industry balances volume in mid-range bandwidths while preparing for AI-driven high-end needs.
Note: Segment shares of all individual segments available upon report purchase
By Bandwidth: High-Speed Transition Accelerates AI Infrastructure
Links exceeding 100 GbE grow at 7.19% CAGR because GPU clusters require lossless Ethernet within AI training fabrics. Ciena’s WaveLogic 6 Extreme, enabling 1.6 Tb/s per wavelength for data-center-interconnect, drives demand on metro fiber routes that terminate in Science Park and Schiphol-Rijk. Meanwhile, 50-100 GbE still holds the largest 35.90% slice of the Netherlands data center networking market size in 2025, predominantly inside colocation whitespace where tenants upgrade incrementally.
Sub-10 GbE persists inside serial-manufacturing plants where programmable-logic-controller latency is more critical than throughput. However, power-efficient linear pluggable optics push TCO gains into higher lanes, accelerating replacement cycles. Two clear purchase cohorts emerge: cost-optimized enterprises buying 25 GbE to 50 GbE for virtual-desktop and storage-replication traffic, and AI-heavy tenants adopting 400G or 800G with SRv6 telemetry to map microburst congestion.
Amsterdam remains Europe’s digital gateway, hosting more than 200 facilities and exceeding 1,000 MW of IT load in 2025. The regional cluster benefits from three major internet exchanges that provide sub-1 ms round-trip latency across northern Europe, a prime lure for content-delivery networks and public-cloud nodes. Grid congestion nonetheless forces new license applicants to prove nitrogen neutrality, prompting operators to co-locate battery storage and solar arrays that offset incremental hyperscaler racks.
Outside the capital, Groningen and Drenthe market themselves as sustainable build-to-suit locations leveraging abundant wind power and cooler average temperatures. Free-air cooling operates nine months per year, yielding PUE below 1.15 and creating headroom to allocate more power to switches and routers. Eindhoven’s Brainport region focuses on edge-compute labs that serve the semiconductor industry; its proximity to Belgium and Germany necessitates multi-cloud routing architectures compliant with both Dutch and EU sovereignty frameworks.
At a broader EU scale, cross-border regulatory harmonization under DORA and the European Health Data Space escalates minimum security baselines. These mandates encourage Dutch operators to push service overlays—encryption, tokenization, segmentation—into the optical layer. International investors take note: Apollo Global Management’s move into continental colocation assets underscores that despite permitting headwinds, the Netherlands data center networking market retains strategic relevance because of its connectivity density and renewable energy access.
Market Concentration
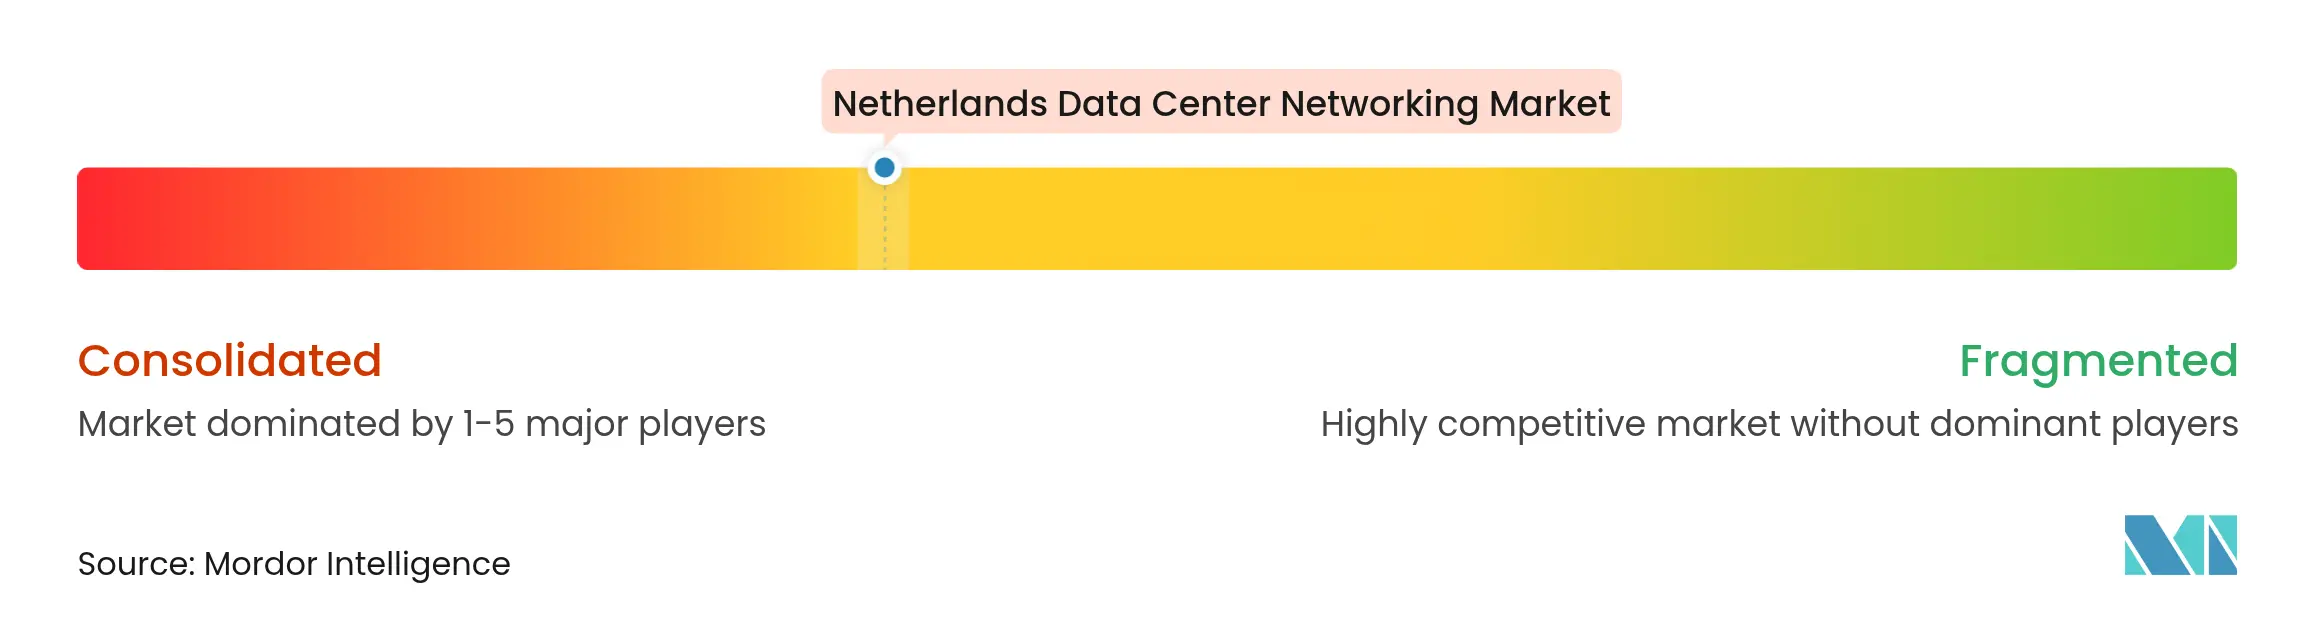
The vendor ecosystem blends established equipment manufacturers with cloud-native software specialists. Traditional switch suppliers defend share by embedding AI-telemetry engines and zero-trust features directly onto ASICs, reducing the need for add-on probes. HPE’s EUR 14 billion acquisition of Juniper Networks, cleared by the EU in 2024, instantly positions the merged entity as a one-stop platform spanning campus, data-center and cloud fabrics. Competitors respond by integrating optical I/O into switch packages, as highlighted in the IEEE Outside System Connectivity roadmap.
White-box ODMs win designs inside hyperscaler retrofits that target 51-Tbit chips and 400G DR4 pluggables. Yet service revenue shifts to global system integrators who manage multivendor fabrics and guarantee uptime SLAs amid acute talent shortages. Sustainability differentiation intensifies: vendors tout 45% energy-savings claims from linear-drive optics and deliver carbon dashboards certified by independent auditors. The combined top-five vendors control about 55% of spending, reflecting a moderately concentrated field that still leaves room for edge-focused startups to capture niche share.
Managed-service providers leverage automation platforms to mask multicloud complexity. Their offerings range from day-two network code-upgrade pipelines to compliance-ready configuration templates that satisfy DORA evidence requirements. As optical-transceiver supply chains contend with geopolitically driven export curbs, procurement strategies favor vendors capable of guaranteeing volume under long-term contracts, further shaping buying behavior inside the Netherlands data center networking market.

*Disclaimer: Major Players sorted in no particular order
1. INTRODUCTION
2. RESEARCH METHODOLOGY
3. EXECUTIVE SUMMARY
4. MARKET LANDSCAPE
5. MARKET SIZE and GROWTH FORECASTS (VALUE)
6. COMPETITIVE LANDSCAPE
7. MARKET OPPORTUNITIES and FUTURE OUTLOOK
Market Definitions and Key Coverage
Our study defines the Netherlands data center networking market as all hardware, software-defined controls, and support services that tie together servers, storage arrays, security appliances, and external carriers inside commercial, colocation, hyperscale, and edge data centers located in the country. The focus covers Ethernet switches, routers, SAN fabric, ADCs, SDN controllers, optical interconnects, network-security devices, and the associated lifecycle services, all measured in revenue terms.
Scope exclusion: campus LAN equipment deployed solely in office environments and any pure telecom core or access network spend are left outside this model.
Segmentation Overview
Detailed Research Methodology and Data Validation
Primary Research
We spoke with Dutch colocation operators, cloud architects, optical-module suppliers, and regional system integrators across Amsterdam, Groningen, and Eindhoven. Their insights on utilization rates, port-density shifts, and selling prices filled critical gaps and confirmed early desk findings.
Desk Research
Our analysts started with open datasets from CBS Statistics Netherlands, the Dutch Data Center Association, RIPE Atlas traffic probes, ACM energy filings, and Eurostat trade codes for HS-8517 switching gear. Company 10-Ks, vendor price lists, and news archives drawn from Dow Jones Factiva enriched shipment values, while Questel patent trends flagged forthcoming 400 G design ramps. D&B Hoovers revenue splits and IMTMA cost benchmarks added firm-level color. The sources named are illustrative; numerous others supported data collection, validation, and clarification.
Market-Sizing & Forecasting
A top-down construct begins with rack counts reported by the DDA, multiplies them by weighted port density and verified ASPs to generate 2025 spend. Supplier roll-ups for switches, optics, and network firewalls cross-check totals. Key variables include installed IT power (MW), 25-100 GbE port share, import value of HS-8517.62 gear, data-center electricity tariffs, and SDN adoption ratios. A multivariate regression with ARIMA overlays extends these inputs to 2030, after which scenario analysis adjusts for energy-cap policy shocks. Bottom-up gaps, such as missing edge-site data, are bridged through managed-services billing proxies gathered during interviews.
Data Validation & Update Cycle
Outputs pass variance scans against historic DDA spend, multi-analyst peer review, and callback checks with primary sources. Models refresh every twelve months, with interim updates triggered by material build or policy events.
Why Our Netherlands Data Center Networking Baseline Inspires Confidence
Benchmark comparison
Published estimates diverge because study scopes, currency bases, and component baskets differ even before calculations begin. Two additional factors, assumed ASP erosion and refresh cadence, often widen the gulf.
Key Gap Drivers
Certain publishers bundle campus LAN and virtualization software, inflating totals.
Others project European growth rates onto the Netherlands without accounting for grid-connection caps and nitrogen rules, which we model explicitly.
| Market Size | Anonymized source | Primary gap driver | ||
|---|---|---|---|---|
USD 0.96 B | Mordor Intelligence | - | Anonymized source:Mordor Intelligence | Primary gap driver:- |
USD 1.37 B (2024) | Global Consultancy A | Includes network software and global ASP averages | ||
USD 1.02 B | Regional Consultancy B | Counts training & consulting revenue, euro base unadjusted for FX |
Pricing Strategy for Semiconductor Components
3 Min Read
Accelerating Additive Manufacturing Adoption in India
3 Min Read
Wealth Management Intelligence for the Middle East
4 Min Read
When decisions matter, industry leaders turn to our analysts. Let’s talk.