
Plastic Waste Management and Recycling Market Size and Share
Market Overview
| Study Period | 2020 - 2031 |
|---|---|
| Market Size (2026) | USD 40.37 Billion |
| Market Size (2031) | USD 49.59 Billion |
| Growth Rate (2026 - 2031) | 4.20 % |
| Fastest Growing Market | Asia-Pacific |
| Largest Market | Asia-Pacific |
| Market Concentration | Low |
Major Players *Disclaimer: Major Players sorted in no particular order Image © Mordor Intelligence. Reuse requires attribution under CC BY 4.0. | |
Plastic Waste Management and Recycling Market Analysis by Mordor Intelligence
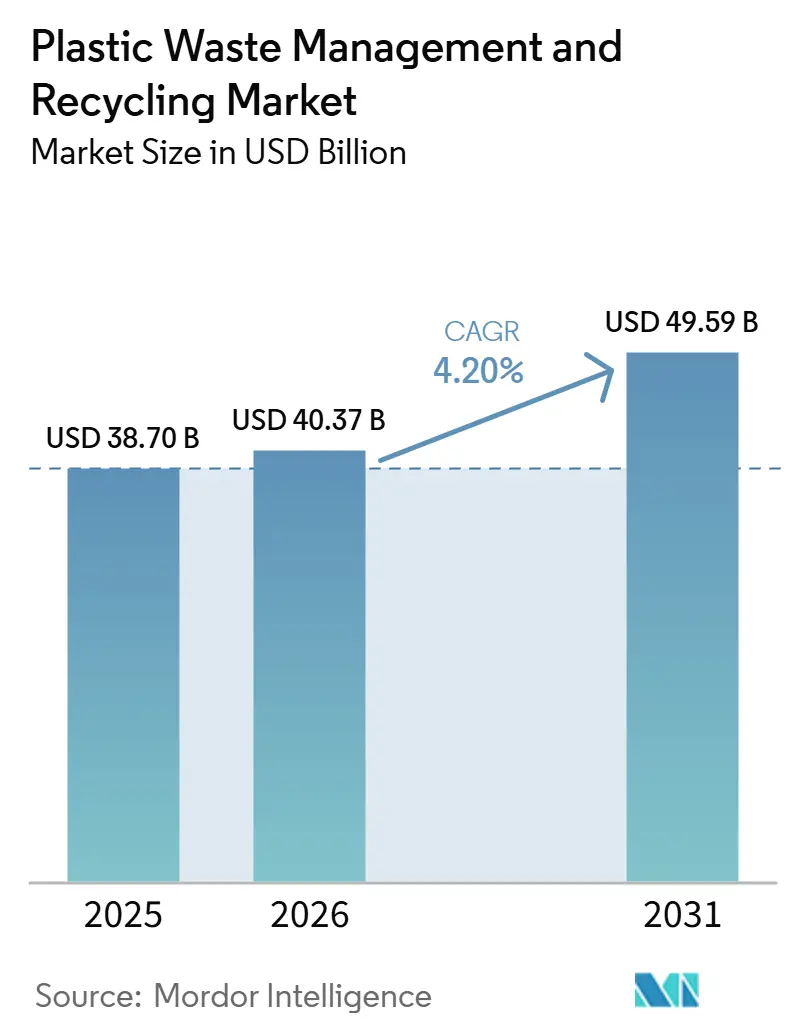
The Plastic Waste Management And Recycling Market size is projected to be USD 38.70 billion in 2025, USD 40.37 billion in 2026, and reach USD 49.59 billion by 2031, growing at a CAGR of 4.20% from 2026 to 2031.
The plastic waste management and recycling market is advancing amid rising waste volumes. The world generated an estimated 400 million tonnes of plastic waste in 2024, and the OECD expects annual plastic waste to reach 617 million tonnes by 2040 under a business-as-usual path. The economic case for intervention also supports the plastic waste management and recycling market, as UNEP stated in 2025 that a lifecycle approach to plastic pollution could deliver USD 4.5 trillion in social and environmental savings through 2040. A durable source of demand stems from extended producer responsibility rules and packaging mandates, including California’s SB 54, which took effect on May 1, 2026, and the European Union’s Packaging and Packaging Waste Regulation, which entered into force on February 11, 2025, and will apply from August 12, 2026. These policy moves are turning recycled-content targets into procurement obligations, thereby supporting investment in collection, sorting, decontamination, and feedstock recovery even when virgin polymer prices are weak. Competitive conditions remain fragmented, as integrated waste operators, specialized recyclers, petrochemical companies, and technology developers all pursue the same post-consumer feedstock base. At the same time, Asia-Pacific continues to lead regional expansion, while Europe remains the most policy-driven region in the plastic waste management and recycling market.
Key Report Takeaways
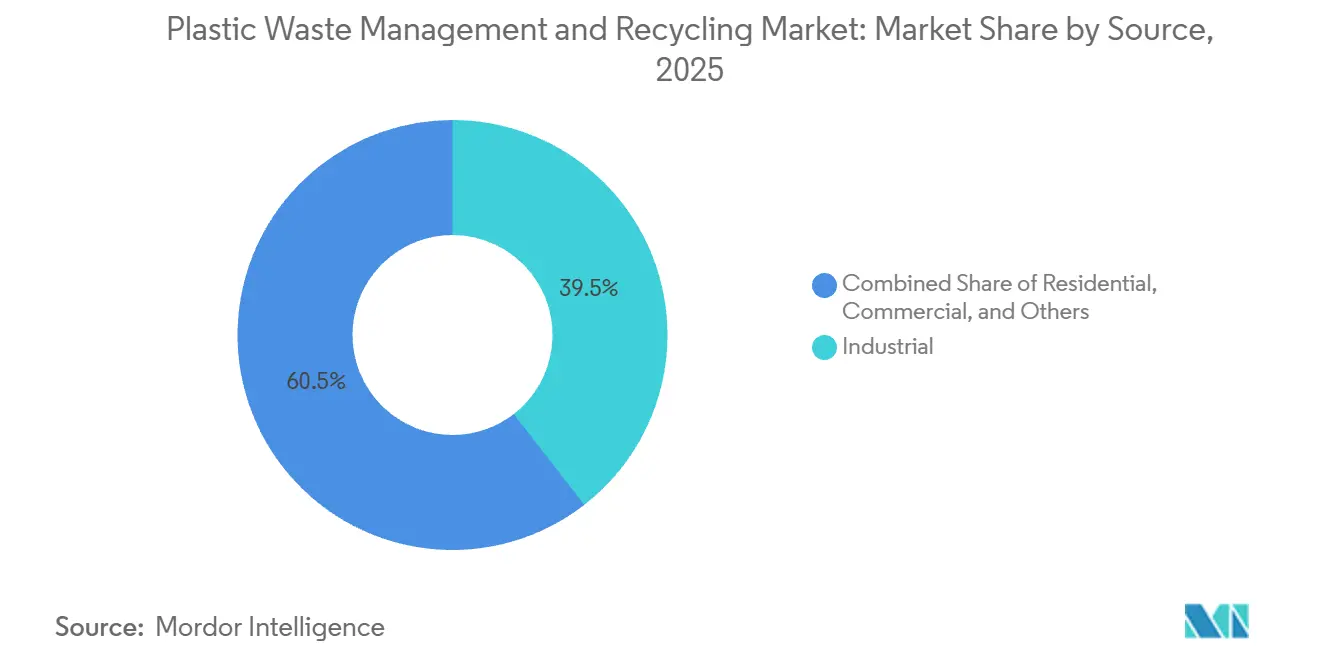
- By source, industrial waste accounted for 39.50% of the plastic waste management market share in 2025, while commercial streams are projected to be the fastest-growing, with 5.42% CAGR through 2031.
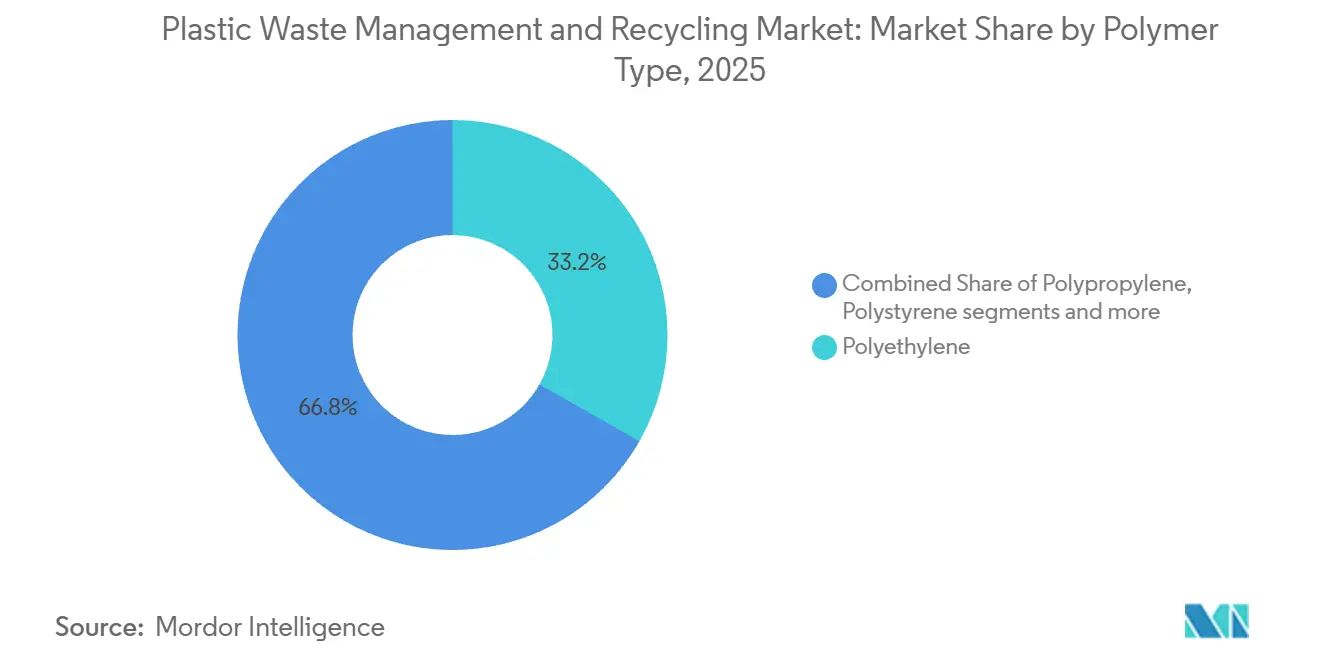
- By polymer type, polyethylene accounted for 33.23% of the plastic waste management market size in 2025, and polyethylene terephthalate is expected to register 6.10% CAGR through 2031.
- By service type, collection, transportation, sorting, and segregation accounted for 43.25% in 2025, while disposal/treatment is expected to register 6.60% CAGR over 2026-2031.
- By end-user industry, packaging accounted for 45.62% market share in 2025, while electrical & electronics is expected to register the highest forecast CAGR of 6.21% through 2031.
- By recycling method, mechanical recycling accounted for 69.72% in 2025, while chemical recycling is projected to be the fastest-growing method, with 5.78% CAGR during 2026-2031.
- By geography, the Asia-Pacific region accounted for 38.42% in 2025, and is expected to register 4.96% CAGR over 2026-2031.
Note: Market size and forecast figures in this report are generated using Mordor Intelligence’s proprietary estimation framework, updated with the latest available data and insights as of January 2026.
Market Trends and Insights
Drivers Impact Analysis of Plastic Waste Management and Recycling Market*
| Driver | (~) % Impact on CAGR Forecast | Geographic Relevance | Impact Timeline |
|---|---|---|---|
| Increasing Regulatory Pressures From EPR And Single-Use Plastic Bans | +1.0% | North America and Europe, with growing relevance in Canada and selected Asia-Pacific markets | Medium term (2-4 years) |
| Surge In Global Plastic Waste Generation | +0.9% | Global, with strongest volume pressure in Sub-Saharan Africa, South Asia, and dense urban markets | Long term (≥ 4 years) |
| Expansion Of Packaging And E-Commerce Waste | +0.7% | Global, strongest in North America, Europe, China, India, and major online retail hubs | Medium term (2-4 years) |
| Boosted Investments In Recycling Infrastructure | +0.8% | North America, Europe, Asia-Pacific, and selected Middle East and Africa markets | Medium term (2-4 years) |
| Rising Mandates For Recycled Content In Packaging | +0.6% | Europe, North America, and Asia-Pacific, especially beverage bottle value chains | Medium term (2-4 years) |
| Scale-Up Of Chemical Recycling And Advanced Sortation Technologies | +0.5% | Europe and North America first, followed by Asia-Pacific in selected industrial clusters | Long term (≥ 4 years) |
| Source: Mordor Intelligence | |||
Increasing Regulatory Pressures: EPR and Bans on Single-Use Plastics
The plastic waste management and recycling market is being pushed forward by regulations that have shifted from pilot programs to binding national and regional rules. California’s SB 54 became effective on May 1, 2026, and it requires producers to support a USD 500 million annual mitigation program from 2027, with a 25% reduction in single-use plastic by 2032 and a move toward fully recyclable or compostable packaging. The United Kingdom’s Producer Responsibility Obligations Regulations 2024 introduced material-specific recycling targets for plastic at 57% in 2026 and 59% in 2027, alongside a fee structure that penalizes packaging designs that are hard to recycle[1]. The European Union’s Packaging and Packaging Waste Regulation entered into force in 2025 and applies from August 12, 2026. It sets recycled content targets and stricter packaging design rules across categories. Canada has also started building reporting discipline through the Federal Plastics Registry, which requires producers above the reporting threshold to disclose the plastic they place on the market. As these rules take hold in a staggered manner, the plastic waste management and recycling market is benefiting from sustained spending on collection systems, packaging redesign, recycling contracts, and compliance systems rather than a single, short burst of investment.
Surge in Global Plastic Waste Generation
The plastic waste management and recycling market is also expanding because waste generation is rising faster than collection and treatment systems can keep up. UNEP noted in 2025 that 19-23 million tonnes of plastic enter aquatic ecosystems each year, which continues to put pressure on governments and producers to improve waste management systems. The OECD stated in 2024 that annual plastic waste could rise by 70% to 617 million tonnes by 2040 if policy ambition remains limited. Packaging remains the most visible part of this flow because it has short use cycles and a high share of global plastic production, so it converts quickly into post-consumer waste. The World Bank reported in 2026 that total global waste volumes are on course to rise sharply by 2050, with the steepest pressure coming from fast urbanizing regions, which means sorting, collection, and disposal systems will face growing strain. As a result, the plastic waste management and recycling market is seeing stronger support for curbside programs, material recovery upgrades, and deposit systems that can capture cleaner feedstock before it is lost to mixed waste streams.
Expansion of Packaging & E-Commerce Waste
The plastic waste management and recycling market is receiving added support from the growth of packaging-intensive distribution models. Packaging accounts for 36% of global plastic production, keeping it at the center of discussions on waste policy and recycling investment. By 2025, global parcel shipments were estimated at 200 billion units, indicating that more protective film, bubble wrap, and rigid containers are moving through homes, retail hubs, and logistics centers. This volume increase matters because e-commerce packaging often enters collection systems in dispersed, lightweight, and contaminated formats that are harder to sort than standard rigid containers. The European Union’s packaging rules are also tightening around reducing space, recyclability, and reuse, forcing logistics providers and consumer brands to redesign pack formats and recovery systems. In practice, that means the plastic waste management and recycling market is benefiting on both ends of the chain, with more packaging waste entering the system and more legal pressure pushing it toward recycling rather than disposal.
Boosted Investments in Recycling Infrastructure
The plastic waste management and recycling market is also being bolstered by increased capital spending on collection, sorting, and processing assets. Public funding has expanded in North America, and federal support in the United States continued through fiscal year 2026 for recycling infrastructure programs, thereby improving the investment case for local material recovery upgrades. Europe is also moving into a heavier infrastructure cycle because producer fee reform, recycled content targets, and packaging design rules are creating a stronger basis for long-life equipment spending. In Asia, Japan’s plan to mobilize JPY 1 trillion (USD 6.40 billion) in public and private investment by 2030 signals that resource security and recycling capacity are now part of industrial strategy rather than a narrow waste policy issue. Emerging markets are also seeing targeted projects, including IFC support for recycled PET lines in West Africa, which shows that recycling capacity is spreading beyond mature markets. The result is that the plastic waste management and recycling market is moving from scattered pilot projects toward commissioned capacity in mechanical sorting, bottle reprocessing, chemical recycling, and feedstock.
Restraints Impact Analysis of Plastic Waste Management and Recycling Market*
| Restraint | (~) % Impact on CAGR Forecast | Geographic Relevance | Impact Timeline |
|---|---|---|---|
| Challenges In Collection And Segregation Systems | -0.7% | Global, acute in low-income and rural areas | Short term (≤ 2 years) |
| Expensive Advanced Recycling Technologies | -0.6% | North America, Europe, early-stage markets | Medium term (2-4 years) |
| Contaminated Plastic Waste Streams | -0.5% | Global, especially curbside-collected residential streams | Short term (≤ 2 years) |
| Fluctuating Prices Of Recycled Plastics | -0.4% | Global commodity markets | Short term (≤ 2 years) |
| Source: Mordor Intelligence | |||
Challenges in Collection & Segregation Systems
The plastic waste management and recycling market still faces a basic supply constraint because feedstock quality depends on how waste is collected and separated before it reaches a recycler. In many markets, film collection remains limited, flexible formats clog existing systems, and local authorities still lack the infrastructure needed to produce clean bales at scale. The World Bank highlighted in 2026 that waste collection and treatment gaps remain especially severe in lower-income settings, which keeps large volumes of material outside formal recovery systems. UNEP also pointed to the scale of mismanaged plastic leakage, showing that collection weaknesses are not a marginal issue but a central limit on recycling growth. Deposit return systems offer a cleaner route for beverage containers, but they are not universal, and their rollout is uneven across major economies. Until collection expands and segregation improves, the plastic waste management and recycling market will continue to face lower yields, higher operating costs, and slower growth in high-purity recycled resin.
Contaminated Plastic Waste Streams
The plastic waste management and recycling market is also restrained by contamination from food residue, labels, mixed polymers, inks, adhesives, and multi-layer structures. This problem is most visible in post-consumer residential waste, where flexible packaging and trays often enter sorting lines with poor separation quality and inconsistent labeling. The European Union’s packaging framework aims to reduce this problem by linking future compliance to design-for-recycling standards and setting clearer recycled-content expectations across packaging types. California’s SB 54 also increases pressure on producers to shift away from formats without credible recovery pathways. Even so, legacy packaging formats will remain in circulation for years, meaning recyclers still need more capacity for washing, decontamination, and purification before larger volumes can move into food-grade or other high-value applications. This is why the plastic waste management and recycling market continues to favor clean bottles and rigid containers. In contrast, contaminated films and mixed plastics still rely on slower, more expensive processing routes.
*Our forecasts treat driver/restraint impacts as directional, not additive. The impact forecasts reflect baseline growth, mix effects, and variable interactions.
Plastic Waste Management and Recycling Market Segment Analysis
By Source:
Industrial feedstock anchors scale, commercial streams accelerate.Industrial waste accounted for 39.5% of the plastic waste management and recycling market in 2025, making it the largest source segment because it arrives in more predictable volumes and cleaner mono-material streams. Trim scrap, edge waste, and line-side packaging waste remain attractive to recyclers because they are easier to bale, sort, and reprocess than mixed household plastics. Commercial waste is forecast to expand at 5.4% CAGR through 2031, supported by e-commerce distribution, retail packaging flows, and tighter producer responsibility rules that are moving collection costs back to businesses. This pattern provides recyclers with a stable feedstock base.
Residential waste remains important for long-term scale, but it is harder to monetize because quality losses from co-mingled collection and food contamination reduce usable output. Deposit return systems improve this picture for beverage packaging, and they help recyclers secure cleaner PET and HDPE streams than standard curbside programs usually deliver. Other source streams, including institutional, agricultural, and medical packaging waste, remain smaller but can create useful niche opportunities where collection is controlled, and the polymer mix is narrow. Over time, the plastic waste management and recycling market is likely to see commercial waste narrow the gap with industrial waste as logistics networks, retail chains, and producer-funded systems become more organized around the recovery of recyclable packaging.

By Polymer Type:
Polyethylene leads current volumes, PET gains faster under bottle rules.Polyethylene held a 33.2% share in 2025, maintaining its lead, as it is widely used across flexible packaging, rigid containers, agriculture, and industrial applications. Its scale supports the plastic waste management and recycling market because large volumes exist in both post-industrial and post-consumer channels, even though much of the flexible material remains hard to collect at high purity. Polyethylene terephthalate is projected to grow at 6.1% CAGR through 2031, reflecting stronger policy support for beverage bottles and food-contact recycling. The European Union requires higher recycled content in beverage packaging, and India’s 2024 approval of recycled PET for food packaging also widened the commercial pathway for certified rPET use.[2]
PET has a stronger route into higher-value applications because bottle collection systems, food-grade decontamination, and brand procurement targets are more mature than they are for several other polymers. Polypropylene remains meaningful in the plastic waste management and recycling market, but it still faces more challenges in food-grade recovery and in maintaining consistent quality after use. PVC, polystyrene, and engineering resins occupy smaller positions because their recovery economics are often weaker, their end uses are more specialized, or their chemistry complicates standard recycling routes. As compliance deadlines tighten, the plastic waste management and recycling market will continue to favor PET for premium closed-loop packaging uses, even though polyethylene will remain the largest polymer stream by processing volume.
By Service Type:
Collection and sorting hold value, recycling and recovery grow fasterCollection, transportation, sorting, and segregation accounted for 43.3% of the plastic waste management and recycling market in 2025, underscoring the value of moving and separating waste before any polymer is sold back into use. This part of the plastic waste management and recycling market remains labor-intensive and infrastructure-heavy because it depends on bins, trucks, transfer points, material recovery facilities, reverse vending systems, and digital tracking. Disposal/Treatment is the fastest-growing service category, with a 6.6% CAGR through 2031, supported by new mechanical lines, purification investments, and advanced plastic waste management projects. Disposal and treatment still handle residual plastics that do not meet recycling standards. Still, policy direction is increasingly against routine landfilling and incineration for packaging that can be redesigned or recovered.
This shift does not mean collection becomes less important. Instead, it means the plastic waste management and recycling market is becoming more balanced between upstream gathering and downstream conversion, because extra tonnage has limited value if reprocessing capacity is not available to absorb it. As producer responsibility systems mature, service providers that can combine collection contracts with sorting, traceability, and resin output will have a stronger position than firms operating in only one link of the chain. The broader effect is that the plastic waste management and recycling market is moving from simple waste handling toward a more integrated resource recovery model.
Geography Analysis
APAC Plastic Waste Management and Recycling Market
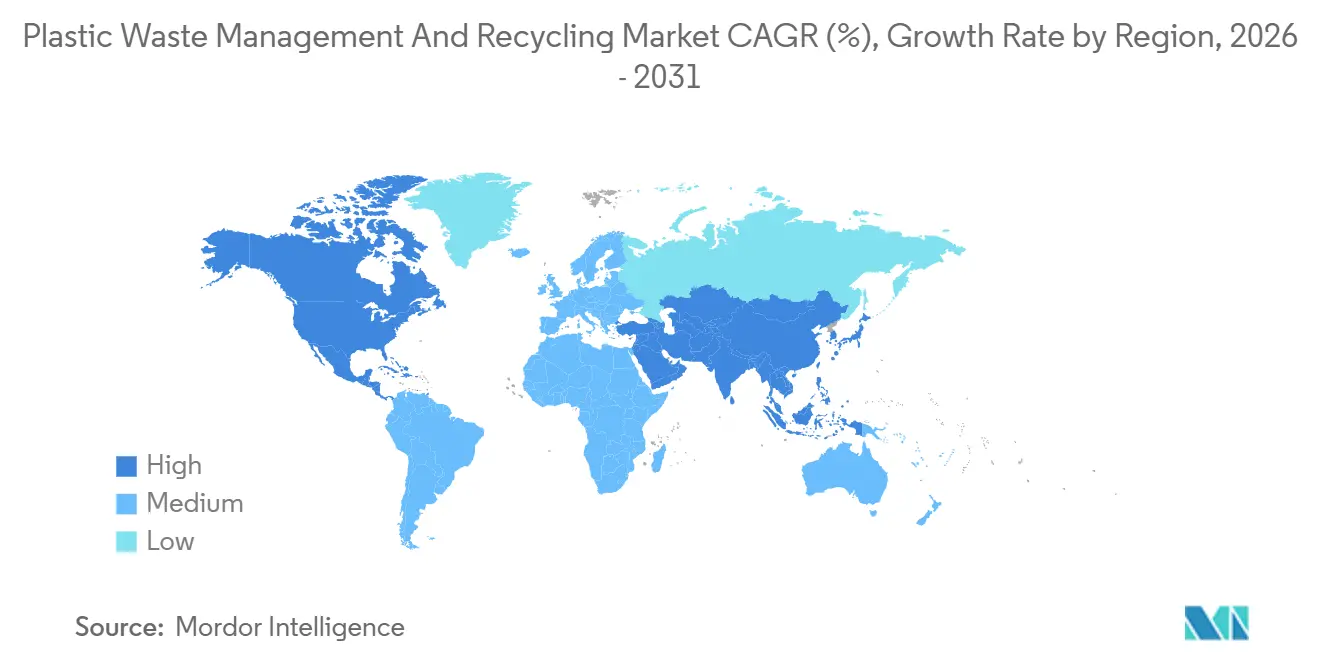
Asia-Pacific accounted for 38.4% of the plastic waste management and recycling market share in 2025 and is forecast to grow at 4.9% CAGR through 2031, keeping it both the largest and fastest-growing regional segment. The region benefits from rapid urbanization, high packaging volumes, stronger domestic processing needs after waste-import controls, and wider government focus on circular material use. China’s circular economy push and tighter controls on packaging waste continue to support local recycling investment, and India’s acceptance of recycled PET for food packaging has improved the outlook for higher-value domestic applications. Japan’s commitment to mobilize JPY 1 trillion (USD 6.40 billion) by 2030 for recycled resource security also shows that recycling capacity is becoming part of long-term industrial planning rather than a narrow environmental issue. These factors give the plastic waste management and recycling market a stronger growth base in Asia-Pacific than in any other geography.
Europe and North America Plastic Waste Management and Recycling Market
Europe remains the most regulation-led regional market. The European Union’s Packaging and Packaging Waste Regulation, recycled content rules, and collection targets are forcing investment in better sorting, bottle recovery, and advanced processing infrastructure. North America continues to build momentum through state-led policies such as California SB 54. However, the absence of a single federal framework means compliance standards and investment signals are still fragmented across the region[3]. That leaves the North American plastic waste management and recycling market with solid project activity but less regulatory consistency than in Europe.
LATAM and MEA Plastic Waste Management and Recycling Market
Latin America, the Middle East, and Africa remain smaller in current value, but they are becoming more important as early-stage growth corridors. Targeted investments in recycled PET capacity and the gradual spread of producer responsibility rules are helping establish local processing bases ahead of wider enforcement. The regional story is therefore uneven, but directionally positive, because new capacity is being built before demand is fully mature. Across the plastic waste management and recycling market, Asia-Pacific is expanding on scale, Europe is advancing through regulatory depth, North America is progressing through state-led programs, and emerging regions are building beachhead capacity that could support stronger growth later in the forecast period.
Competitive Landscape
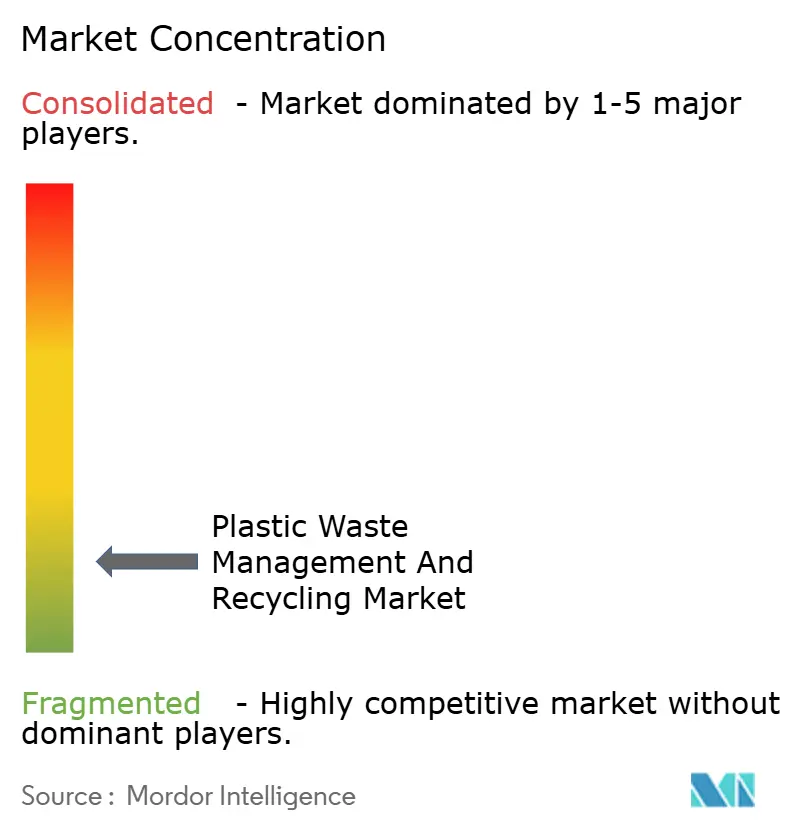
The plastic waste management and recycling market remains fragmented because no single model dominates the full chain from waste collection to high-purity resin output. Large waste operators compete on municipal access, logistics, and sorting assets, while specialized recyclers focus on quality, polymer expertise, and closed-loop relationships with consumer brands. At the same time, petrochemical companies are expanding into recycling feedstock and output certification to secure circular raw materials for packaging and other end uses. This means the plastic waste management and recycling market is no longer defined only by traditional recyclers. It is now shaped by a broader set of players, including waste companies, resin producers, technology licensors, and brand-linked recycling platforms.
Strategic moves show how companies are positioning around feedstock control and higher-value output. Dow took a strategic stake in Xycle to support a Rotterdam pyrolysis plant scheduled for Q4 2026, which strengthens its access to hard-to-recycle plastic streams and circular feedstock for packaging and industrial uses. Neste commissioned its large liquefied-waste-plastic upgrading facility at Porvoo in March 2026, which signals stronger confidence in chemical recycling for contaminated and multi-layer plastics. Waste Management also expanded into recycled film resin through its Natura PCR plant in Texas, which shows that large waste firms are moving deeper into resin production rather than stopping at collection and sorting.
Competition is therefore forming along two tracks. One track centers on mechanical recycling for bottles and cleaner mono-material streams, where scale, bale quality, and brand contracts matter most. The second track centers on chemical recycling for contaminated and mixed plastics, where technology performance, regulatory acceptance, and long-term off-take support are more important. Because these tracks require different assets and economics, the plastic waste management and recycling market is likely to remain fragmented, with firms building strength in specific polymers, service lines, and regional feedstock pools rather than across the entire value chain.
Plastic Waste Management and Recycling Industry Leaders
-
Veolia Environnement S.A.
-
SUEZ
-
Waste Management Inc.
-
Republic Services
-
Remondis SE & Co. KG
- *Disclaimer: Major Players sorted in no particular order
Plastic Waste Management and Recycling Market Companies Covered in this Report
- Veolia Environnement S.A.
- SUEZ
- Waste Management Inc.
- Republic Services
- Remondis SE & Co. KG
- Waste Connections
- Clean Harbors
- Biffa
- Reworld (Covanta Holding Corporation)
- FCC Environment
- Eastman
- Urbaser
- KW Plastics
- TerraCycle
- Loop Industries
- Carbios
- GFL Environmental
- Hawkvale Limited
- Hahn Plastics Limited
- Recology Inc.
Recent Industry Developments in Plastic Waste Management and Recycling Market
- March 2026: Neste commissioned the world's largest facility for upgrading liquefied waste plastic at its Porvoo refinery in Finland, with an EUR 111 million (USD 130.57 million) investment and 150,000-tonne annual capacity, targeting multi-layer and contaminated plastics unsuitable for mechanical recycling. The facility enables an over 70 percent reduction in virgin fossil resource consumption and over 35 percent in greenhouse gas emissions when chemically recycled plastic displaces fossil feedstock in new manufacturing.
- June 2025: Versalis, Eni's chemical company, started its Hoop demonstration plant in Mantua, Italy, with an annual capacity of 6,000 tonnes to convert mixed plastic waste into feedstock for food and pharmaceutical packaging, validating the proprietary technology at an industrial scale ahead of a planned 40,000-tonne facility in Priolo, Sicily.
- March 2025: Republic Services and Blue Polymers celebrated the opening of North America's first Polymer Center and Blue Polymers plastics recycling complex in Indianapolis, designed to produce over 175 million pounds of recycled plastics annually for food-grade packaging. The 300,000-square-foot facility processes PET, HDPE, and polypropylene from Indiana and nearby states, creating approximately 125 permanent skilled jobs.
Global Plastic Waste Management and Recycling Market Report Scope
Segmentation Overview
| Residential |
| Commercial (retail, office, etc.) |
| Industrial |
| Others (institutional, agricultural, etc) |
| Polyethylene (PE) |
| Polypropylene (PP) |
| Polyethylene Terephthalate (PET) |
| Polyvinyl Chloride (PVC) |
| Polystyrene (PS) |
| Others |
| Collection, Transportation, Sorting & Segregation | |
| Disposal / Treatment | Landfill |
| Recycling & Resource Recovery | |
| Incineration & Waste-to-Energy | |
| Others (Chemical Treatment, Composting, etc.) | |
| Others (Consulting, Audit & Training, etc.) |
| Packaging |
| Construction & Demolition |
| Automotive & Transportation |
| Consumer Goods |
| Medical & Healthcare |
| Electrical & Electronics |
| Others |
| Mechanical Recycling |
| Chemical Recycling |
| Thermal Recycling |
| Others |
| North America | United States |
| Canada | |
| Mexico | |
| South America | Brazil |
| Argentina | |
| Chile | |
| Rest of South America | |
| Europe | Germany |
| United Kingdom | |
| France | |
| Italy | |
| Spain | |
| Russia | |
| BENELUX (Belgium, Netherlands, and Luxembourg) | |
| NORDICS (Denmark, Finland, Iceland, Norway, and Sweden | |
| Rest of Europe | |
| Asia-Pacific | China |
| India | |
| Japan | |
| South Korea | |
| Australia | |
| Southeast Asia (Indonesia, Vietnam, Thailand, Malaysia, Philippines) | |
| Rest of Asia-Pacific | |
| Middle East & Africa | United Arab Emirates |
| Saudi Arabia | |
| Turkey | |
| Qatar | |
| South Africa | |
| Egypt | |
| Nigeria | |
| Rest of Middle East & Africa |
| By Source | Residential | |
| Commercial (retail, office, etc.) | ||
| Industrial | ||
| Others (institutional, agricultural, etc) | ||
| By Polymer Type | Polyethylene (PE) | |
| Polypropylene (PP) | ||
| Polyethylene Terephthalate (PET) | ||
| Polyvinyl Chloride (PVC) | ||
| Polystyrene (PS) | ||
| Others | ||
| By Service Type | Collection, Transportation, Sorting & Segregation | |
| Disposal / Treatment | Landfill | |
| Recycling & Resource Recovery | ||
| Incineration & Waste-to-Energy | ||
| Others (Chemical Treatment, Composting, etc.) | ||
| Others (Consulting, Audit & Training, etc.) | ||
| By End-User Industry | Packaging | |
| Construction & Demolition | ||
| Automotive & Transportation | ||
| Consumer Goods | ||
| Medical & Healthcare | ||
| Electrical & Electronics | ||
| Others | ||
| By Recycling Methods | Mechanical Recycling | |
| Chemical Recycling | ||
| Thermal Recycling | ||
| Others | ||
| By Geography | North America | United States |
| Canada | ||
| Mexico | ||
| South America | Brazil | |
| Argentina | ||
| Chile | ||
| Rest of South America | ||
| Europe | Germany | |
| United Kingdom | ||
| France | ||
| Italy | ||
| Spain | ||
| Russia | ||
| BENELUX (Belgium, Netherlands, and Luxembourg) | ||
| NORDICS (Denmark, Finland, Iceland, Norway, and Sweden | ||
| Rest of Europe | ||
| Asia-Pacific | China | |
| India | ||
| Japan | ||
| South Korea | ||
| Australia | ||
| Southeast Asia (Indonesia, Vietnam, Thailand, Malaysia, Philippines) | ||
| Rest of Asia-Pacific | ||
| Middle East & Africa | United Arab Emirates | |
| Saudi Arabia | ||
| Turkey | ||
| Qatar | ||
| South Africa | ||
| Egypt | ||
| Nigeria | ||
| Rest of Middle East & Africa | ||
Key Questions Answered in the Report
What is the current market size and outlook for plastic waste management and recycling market?
The plastic waste management and recycling market is projected to grow from USD 40.4 billion in 2026 to USD 49.6 billion by 2031 at 4.2% CAGR, supported by recycled-content mandates, producer responsibility rules, and increased investment in collection and processing capacity.
Which region will lead growth through 2031?
Asia-Pacific leads both scale and growth, with a 38.4% regional share in 2025 and a forecast 4.9% CAGR through 2031, supported by domestic processing expansion, waste import controls, and policy support for recycled materials.
Which source segment contributes the most feedstock today?
Industrial waste leads with a 39.5% share in 2025 because it reaches recyclers through cleaner, more predictable streams than mixed residential material.
Which polymer is seeing the strongest expansion?
PET is growing fastest at 6.1% CAGR through 2031, driven by beverage bottle rules, food-contact approvals, and higher collection purity, which make it more attractive for closed-loop recycling.
Why does packaging remain the largest end-use area?
Packaging held a 45.6% share in 2025 because it is the main focus of deposit systems, recycled-content laws, and brand procurement programs, which create direct, steady demand for recycled resin.
What is the biggest challenge for recyclers over the next few years?
Collection gaps and contamination remain the main obstacles, because poor segregation and mixed materials reduce yields, raise processing costs, and slow the supply of food-grade and high-purity recycled plastics.