Plastic Pallets Market Size and Share
Market Overview
| Study Period | 2020 - 2031 |
|---|---|
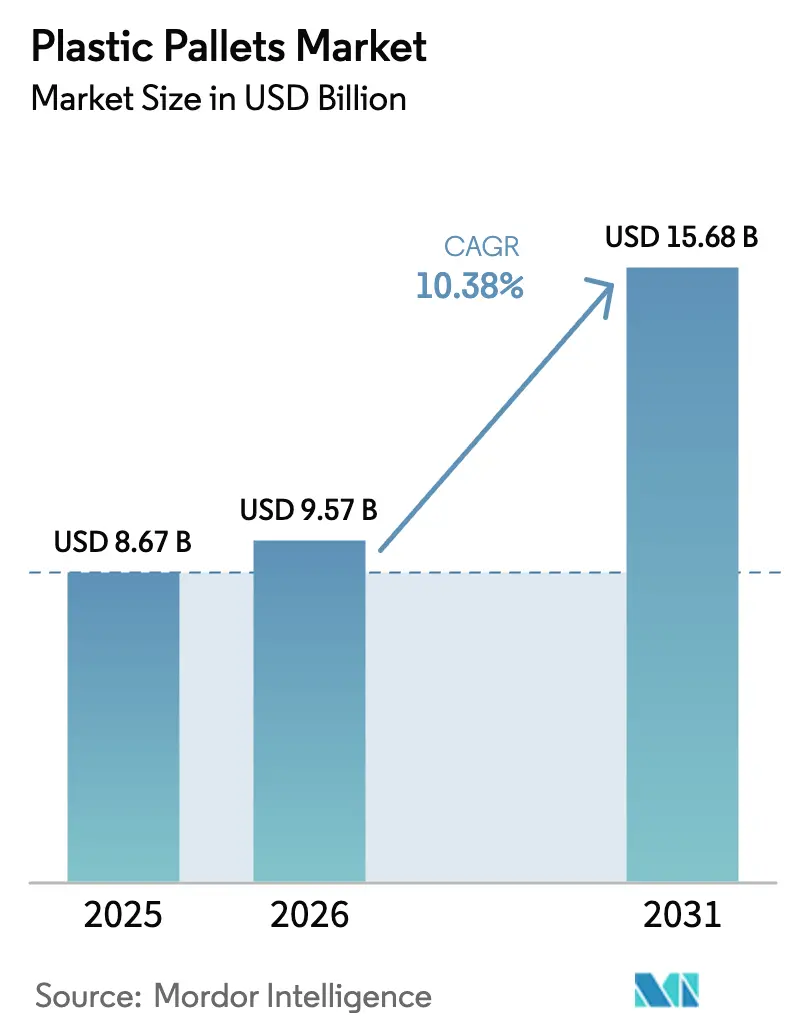
| Market Size (2026) | USD 9.57 Billion |
| Market Size (2031) | USD 15.68 Billion |
| Growth Rate (2026 - 2031) | 10.38% CAGR |
| Fastest Growing Market | Middle East |
| Largest Market | Asia Pacific |
| Market Concentration | Medium |
Major Players *Disclaimer: Major Players sorted in no particular order Image © Mordor Intelligence. Reuse requires attribution under CC BY 4.0. | |
Plastic Pallets Market Analysis by Mordor Intelligence
The plastic pallets market size is projected to expand from USD 8.67 billion in 2025 and USD 9.57 billion in 2026 to USD 15.68 billion by 2031, registering a CAGR of 10.38% between 2026 to 2031. Intensifying regulatory pressure to eliminate untreated wood from international trade, rising automation investments that demand dimensionally stable platforms, and circular-economy policies that reward reusable assets are converging to accelerate adoption. High-density polyethylene remained the dominant resin in 2025, yet brand owners are pivoting toward recycled content as the European Union sets minimum thresholds, tightening competition for food-contact-grade recyclate. Pooling economics are strengthening because third-party operators convert fixed pallet costs into variable service fees, slashing the total cost of ownership for shippers. At the same time, retailers are integrating merchandising with inbound logistics, boosting demand for display pallets that move seamlessly from warehouse to sales floor.
Key Report Takeaways
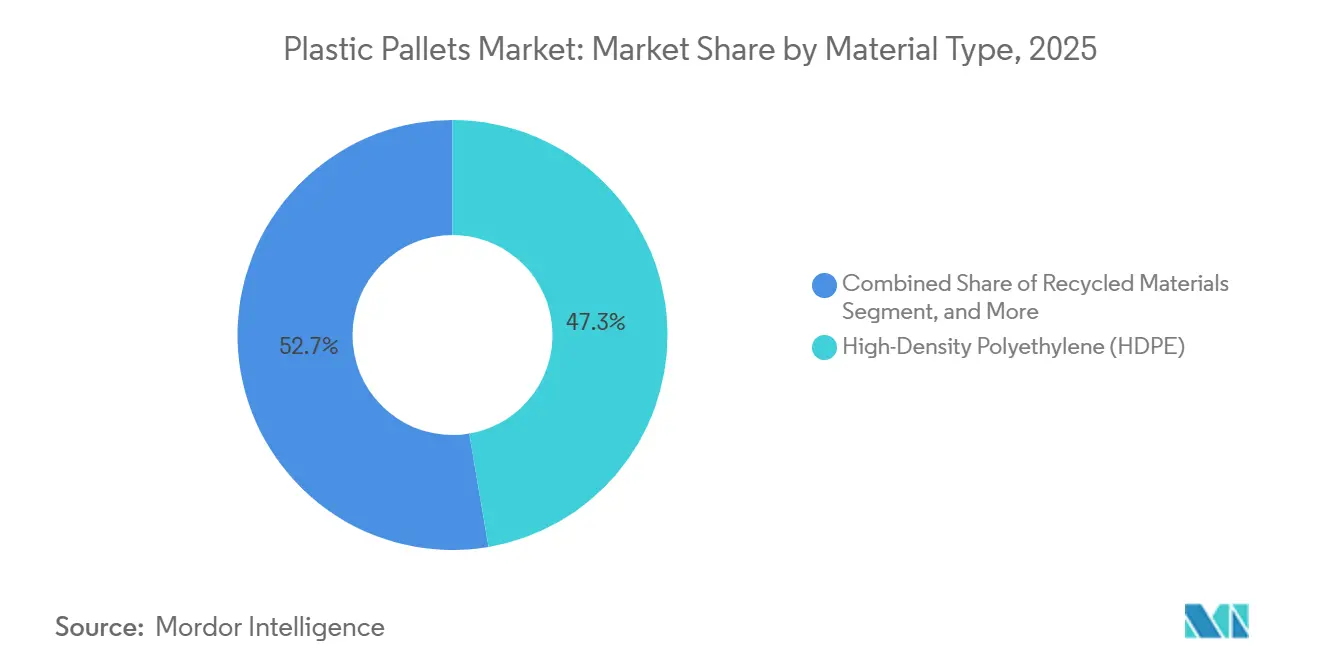
- By material type, high-density polyethylene led with 47.33% revenue share in 2025, while recycled materials are on track for a 10.96% CAGR through 2031.
- By pallet type, rackable designs commanded 39.53% of the plastic pallets market share in 2025, whereas display and custom variants are slated to expand at a 11.23% CAGR through 2031.
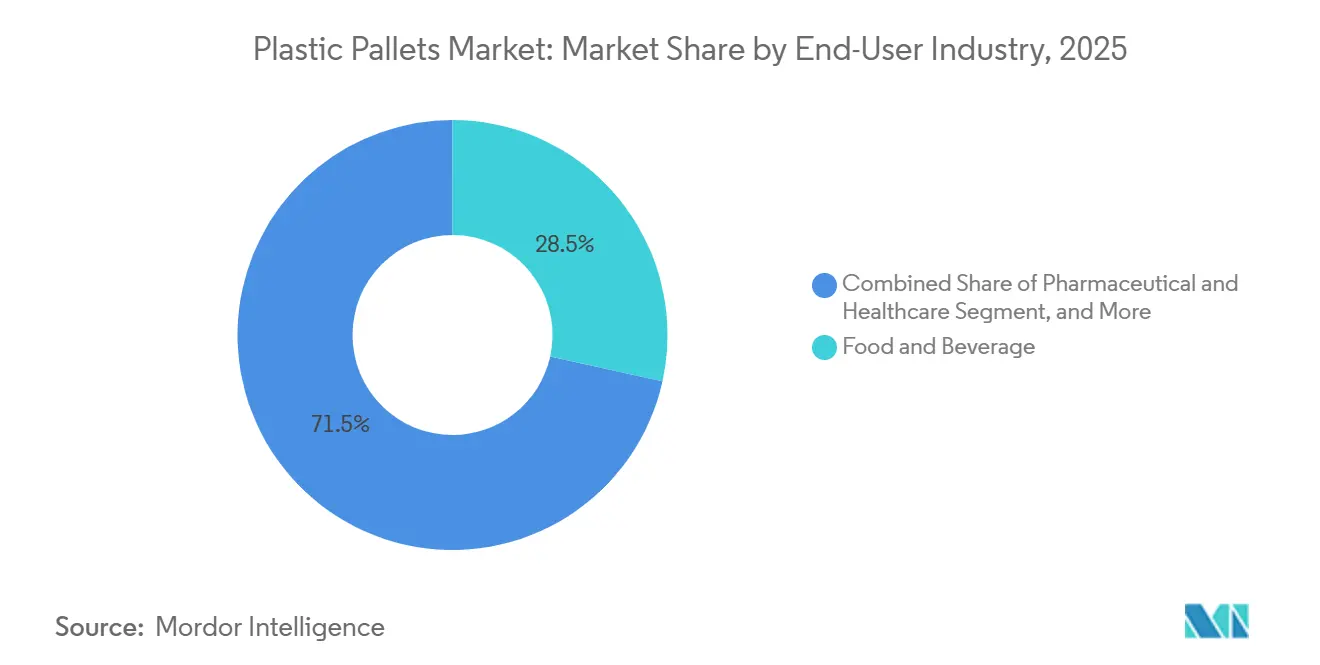
- By end-user industry, food and beverage accounted for 28.46% of revenue in 2025, and pharmaceutical and healthcare are projected to post an 11.79% CAGR during 2026-2031.
- By load capacity, medium-duty pallets captured 43.71% of the plastic pallets market in 2025, and light-duty units are forecast to grow at a 10.92% CAGR over the same period.
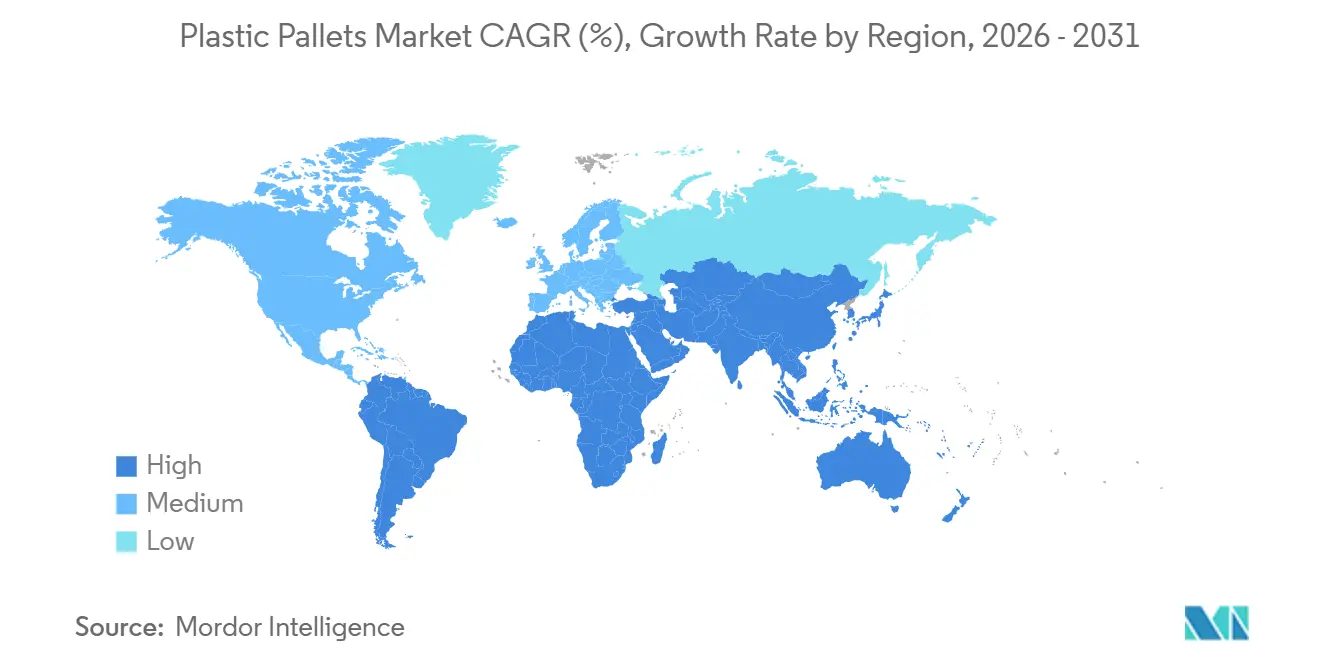
- By geography, Asia-Pacific accounted for 38.91% of global value in 2025, while the Middle East is expected to register a 11.41% CAGR through 2031.
Note: Market size and forecast figures in this report are generated using Mordor Intelligence’s proprietary estimation framework, updated with the latest available data and insights as of 2026.
Global Plastic Pallets Market Trends and Insights
Drivers Impact Analysis*
| Driver | (~) % Impact on CAGR Forecast | Geographic Relevance | Impact Timeline |
|---|---|---|---|
| Adoption of hygienic plastic pallets in pharmaceutical cold chains across North America and Europe | +2.1% | North America and Europe, spillover to Asia-Pacific pharmaceutical hubs | Medium term (2-4 years) |
| Mandates for ISPM-15 compliance driving shift from wood to plastic in Asia export hubs | +2.4% | Asia-Pacific core (China, India, ASEAN), spillover to South America export corridors | Short term (≤ 2 years) |
| Pooling models reducing total cost of ownership for 3PLs in Europe | +1.8% | Europe and North America, early adoption in Australia and New Zealand | Medium term (2-4 years) |
| Retail automation, AS/RS, and conveyor systems requiring dimensionally stable pallets in the United States | +1.9% | United States and Canada, expanding to Europe and Asia-Pacific automation clusters | Long term (≥ 4 years) |
| Circular economy targets pushing demand for recyclate-based HDPE pallets in the European Union | +1.6% | European Union, with regulatory influence extending to United Kingdom and EFTA states | Long term (≥ 4 years) |
| Battery and chemical lithium supply chains preferring anti-static plastic pallets in China | +1.3% | China and South Korea, with emerging relevance in United States and European battery gigafactories | Medium term (2-4 years) |
| Source: Mordor Intelligence | |||
Adoption of Hygienic Plastic Pallets in Pharmaceutical Cold Chains
Pharmaceutical distributors now view pallets as qualified equipment rather than disposable dunnage. Health Canada’s GUI-0069 and USP Chapter 1079 formalize cleanability and traceability requirements, driving buyers to non-porous, reusable platforms.[1]Health Canada, “Good Distribution Practice Guideline GUI-0069,” canada.ca Cold-chain pools that document wash-cycle microbiology are therefore displacing spot-market wood. As more biologics move through strict temperature lanes, suppliers that can validate pallet performance under shock, vibration, and cleaning chemicals are securing multi-year contracts. This shift tilts procurement criteria from unit price to total cost of quality and strengthens barriers to entry for unverified wooden alternatives.
Mandates for ISPM-15 Compliance in Asia Export Hubs
International Standards for Phytosanitary Measures 15 requires exporters to heat-treat or fumigate wood packaging, while plastic pallets are exempt from the rule entirely. Enforcement at U.S. and EU ports creates costly delays for non-compliant loads.[2]USDA APHIS, “ISPM-15 Compliance Requirements,” aphis.usda.gov Export-oriented manufacturers in China, Vietnam, and India are therefore moving to plastic despite a higher ticket price because it shortens customs clearance and mitigates re-export risks. The practical effect is a trade-velocity premium that positions plastic as a logistics insurance policy for just-in-time supply chains.
Pooling Models Reducing Total Cost of Ownership for 3PLs in Europe
Brambles, Tosca, and regional peers operate asset-light networks that transform pallet CAPEX into pay-per-trip OPEX, cutting user costs by 30-40% and boosting retention to 95%.[3]Brambles Limited, “Annual Report 2024,” brambles.com Because network density and asset return velocity underpin profitability, first movers in high-traffic corridors possess scale advantages that are hard to replicate. Rising ESG scrutiny amplifies the value proposition, as pooling providers publish verifiable carbon-avoidance data that shippers can embed in scope-3 reporting.
Retail Automation Requiring Dimensionally Stable Pallets in the United States
Automated storage and retrieval systems work only with pallets that have a tolerance range of 2 mm; wood expands and contracts with moisture, which can trigger jams. A 2025 industry survey found that 89% of operators demanded standardization for automation compatibility. Early adopters like Amazon are locking in injection-molded pallets, creating path dependency for thousands of upstream suppliers. The ripple effect is a nationwide design standard that prioritizes precision-molded plastic over wood, which is prone to variability.
Restraints Impact Analysis*
| Restraint | (~) % Impact on CAGR Forecast | Geographic Relevance | Impact Timeline |
|---|---|---|---|
| High upfront capital cost barrier for small and medium enterprises in emerging Southeast Asia | -1.4% | Southeast Asia (Vietnam, Indonesia, Philippines, Thailand), spillover to South Asia and Africa | Short term (≤ 2 years) |
| Limited reverse logistics infrastructure for bulk return of pallets in Africa and South America | -1.2% | Africa (excluding South Africa) and South America (excluding Brazil and Argentina core corridors) | Long term (≥ 4 years) |
| Price volatility of virgin polyolefin resins linked to crude oil swings | -0.9% | Global, with acute sensitivity in import-dependent markets lacking domestic petrochemical capacity | Medium term (2-4 years) |
| Perception of lower load capacity versus hardwood pallets among heavy-duty users in construction | -0.6% | North America and Europe construction sectors, with legacy preferences in Australia and New Zealand | Medium term (2-4 years) |
| Source: Mordor Intelligence | |||
High Upfront Capital Cost Barrier for SMEs in Emerging Southeast Asia
Plastic pallets cost three to five times as much as comparable wood units, a burden for small exporters operating on slim margins. Because pooling coverage is patchy in the region, many firms must self-purchase, tying up scarce working capital. Without the backing of pooling consortia or subsidies from development banks for reusable packaging, wood will continue to dominate, even with its higher lifecycle costs, hindering its adoption among numerous micro-exporters.
Limited Reverse Logistics Infrastructure in Africa and South America
Reusable systems rely on predictable returns, yet fragmented road networks, customs bottlenecks, and low warehouse density inflate retrieval costs well above savings. Pallets often end their life stranded far from the original pool, neutralizing environmental and financial benefits. Pooling economics will only become viable at scale once cross-border trade agreements streamline paperwork, reduce regulatory complexities, and 3PLs set up efficient hub-and-spoke corridors to optimize logistics operations.
*Our forecasts treat driver/restraint impacts as directional, not additive. The impact forecasts reflect baseline growth, mix effects, and variable interactions.
Segment Analysis
By Material Type: Recycled Content Reshapes Supply Strategies
High-density polyethylene accounted for 47.33% of the plastic pallets market share in 2025, while recycled-content variants are forecast to expand at a 10.96% CAGR through 2031. Virgin HDPE remains the first choice for food and pharmaceutical shippers that must meet FDA and EU migration limits, yet tightening circular-economy rules in Europe are making recycled feedstock a competitive necessity. Vertically integrated molders have started locking in post-consumer resin streams to protect margins from crude-linked swings in virgin resin prices, and those contracts are already oversubscribed. A Korean longevity study showed virgin HDPE pallets lasting 9.6 years in high-rotation pools, three times longer than polypropylene, which reinforces HDPE’s value proposition despite its higher input cost.
Recycled blends now dominate automotive and general retail lanes, where hygiene barriers are lower, and sustainability scorecards govern sourcing. Demand spikes ahead of the EU’s 10% recycled-content deadline for 2030, creating a seller’s market for food-grade recyclate. Processors that can certify decontamination to FDA 21 CFR Part 177 standards command premium pricing and priority in contract renewals. As recycled supply tightens, the plastic pallets market for virgin HDPE is expected to hold steady rather than contract, as brand owners fund parallel supply chains to ring-fence risk.


By Pallet Type: Display Formats Capitalize On In-Store Merchandising
Rackable platforms secured 39.53% of the plastic pallets market share in 2025 by maximizing vertical storage density in automated warehouses. Nestable and stackable designs retained strong positions in export corridors that prize container cube and backhaul efficiency, yet their share is plateauing as retailers prioritize automation compatibility. Display and custom formats are on track for an 11.23% CAGR through 2031, because discounters and big-box stores now roll fully merchandised pallets straight to the sales floor, eliminating manual shelf stocking.
Second-generation display units incorporate in-mold graphics, color coding, and embedded RFID, letting stores cut labor while improving shrink control. Custom anti-static versions are proliferating in lithium-battery supply chains, where a single spark can trigger thermal runaway. As fulfillment centers retrofit with high-speed conveyors, procurement managers are specifying rackable or stackable SKUs built to ±2 mm tolerances, sidelining wood and low-precision compression molds. This specification shift cements an architectural divide between automation-ready pallets and commodity export skids.
By End-User Industry: Pharma Overtakes As Cold Chain Expands
Food and beverage accounted for 28.46% of segment revenue in 2025, yet pharmaceutical and healthcare applications are projected to grow at a 11.79% CAGR, lifting the plastic pallets market size sharply by 2031. Cold-chain GDP rules treat pallets as validated equipment that must endure cleaning chemicals, vibration, and temperature swings without harboring microbes. That framework pushes distributors toward pooled plastic systems that provide wash logs and traceability audits.
Chemical producers, meanwhile, request corrosion-resistant and static-dissipative grades, while e-commerce merchants seek lightweight units that reduce parcel surcharges. Automotive demand for heavy static loads is plateauing as electric-vehicle battery modules require anti-static surfaces rather than brute strength. Across all verticals, the common thread is a pivot from one-time dunnage to data-rich assets that meet HACCP, BRC, and GDP audit requirements, with wood steadily losing relevance, except on low-regulation construction sites.
By Load Capacity: Light-Duty Units Benefit From E-Commerce Velocity
Medium-duty pallets accounted for 43.71% of 2025 revenue, as grocery and general merchandise loads typically fall between 500 kg and 1,200 kg. Light-duty formats are expected to grow at a 10.92% CAGR, fueled by parcel hubs and micro-fulfillment centers where worker ergonomics and speed outweigh static strength. High-duty plastic varieties match hardwood in ISO 8611 racking tests but still face skepticism among construction buyers accustomed to cheap lumber.
E-commerce operators running 24-hour sortation lines prize lighter platforms that workers can reposition quickly, shaving seconds off each pick. Medium-duty units remain the workhorse for food chains that rack multi-SKU pallets up to 8 meters high without deformation. High-duty variants gain when hazardous-materials shippers need corrosion resistance and static control, but volume is niche. The evolving mix suggests that growth will concentrate at the lower end of the weight spectrum even as engineering proofs chip away at perceptions of plastic fragility.
Geography Analysis
Asia-Pacific accounted for 38.91% of the global value in 2025, making it the largest plastic pallets market. Export manufacturers in China, India, and ASEAN favor plastic units that bypass ISPM-15 treatment, cutting customs delays and re-export risks. India’s plastics sector is targeting USD 44.59 billion by 2030, and domestic demand is driving higher pallet purchases for both export and inland moves. China remains the single biggest producer and exporter of plastic packaging, and the resulting logistics flows sustain high pallet rotation that rewards durable HDPE designs. Together, these dynamics push the regional plastic pallets market size steadily upward through 2031.
North America and Europe form a mature second tier. U.S. retailers are equipping new fulfillment centers with AS/RS equipment that accepts only precision-molded units, ensuring steady replacement cycles and vibrant pooling activity. The EU Packaging and Packaging Waste Regulation locks in reuse targets that guarantee multi-trip demand and accelerate take-back programs. Pooling operators maintain dense retrieval networks across both regions, reducing empty miles and supporting 30-40% cost savings for shippers. Stable reverse-logistics infrastructure keeps pallet loss rates low and underpins predictable asset lifetimes.
The Middle East is forecast to log the fastest regional CAGR at 11.41% through 2031 as Saudi Vision 2030 builds megaproject warehouses and UAE pharmaceutical imports swell cold-chain lanes. South America shows mixed progress because Brazil and Argentina support limited pooling corridors, while Andean markets lack the warehouse density needed for economical retrieval. Most of Africa remains constrained by fragmented road systems that strand pallets at endpoints, blocking reuse economics. Until cross-border trade agreements streamline paperwork and road conditions improve, wooden platforms will dominate in those territories. Regional growth prospects, therefore, bifurcate along lines of infrastructure maturity.

Competitive Landscape
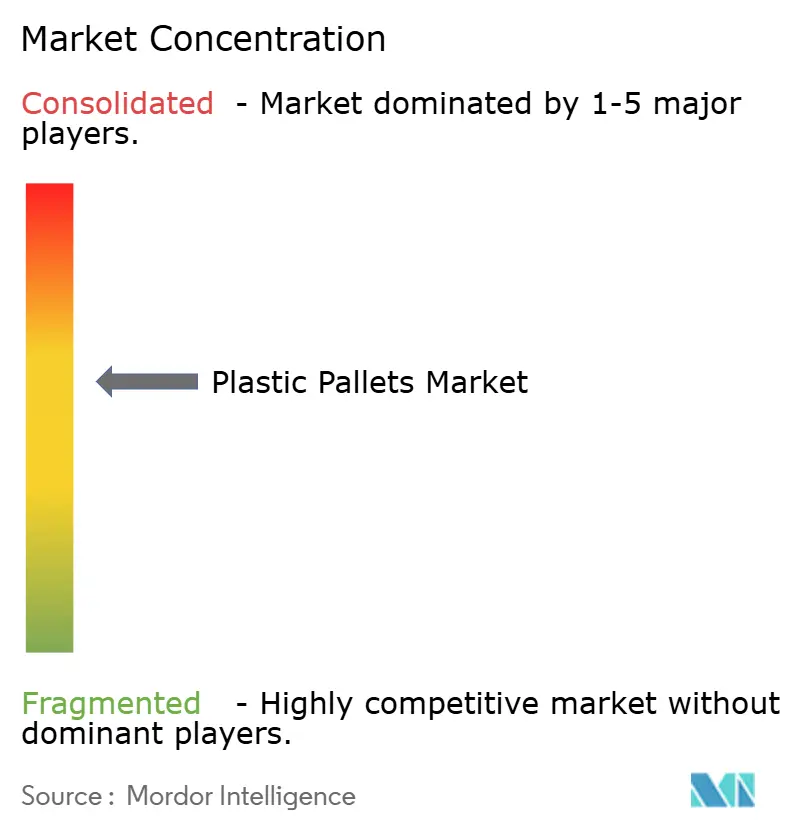
The industry is moderately concentrated, with the top five suppliers accounting for roughly 45% of revenue, placing the market concentration score at 6. Brambles leads with 376 million pallets in circulation and recurring service fees that cut shipper costs by up to 40%. Tosca reports a 99% asset recovery rate and emphasizes closed-loop container washing that aligns with retailer hygiene audits. Loscam dominates pooling in Asia-Pacific, while CABKA and Schoeller Allibert leverage vertical integration into recycling to hedge virgin-resin volatility. These leaders rely on network density and proprietary data analytics to optimize return velocity and asset maintenance.
Regional molders in India and China compete mainly on upfront price, offering custom dimensions and color-coded units for niche sectors. Their limited retrieval footprints, however, confine them to one-way sales rather than full pooling. Battery and chemical shippers are gravitating to anti-static and corrosion-resistant grades, a niche served by specialty firms that embed carbon powder or glass fibers into HDPE blends. Canadian and Mexican converters benefit from proximity to U.S. distribution hubs, enabling them to supply precision-molded pallets that meet AS/RS tolerance windows. European players increasingly bundle RFID tags and IoT sensors to create traceable assets that pass GFSI and GDP audits.
Competitive advantage is shifting from molding capacity to service sophistication. Providers that can guarantee asset location, wash history, and carbon-avoidance data win long-term contracts with multinational retailers and pharmaceutical giants. Blockchain pilots now link each pallet’s trip history to certificates of analysis and sanitary records, unlocking premium pricing. Automation-ready designs with ±2 mm tolerances further widen the gap between top-tier pools and commodity sellers. As circular-economy rules tighten recycled-content mandates, integrated recyclers hold a sourcing edge that late entrants will find costly to replicate.
Plastic Pallets Industry Leaders
Brambles Limited
CABKA Group GmbH
Rehrig Pacific Company
Tosca Services, LLC
Loscam International Holdings
- *Disclaimer: Major Players sorted in no particular order

Recent Industry Developments
- February 2026: Brambles began field trials of bio-based pallet resins, aiming to cut scope-3 emissions and diversify beyond petroleum inputs.
- January 2026: Brambles posted USD 3.1 billion first-half revenue, up 5%, and launched a plant-based pallet pilot.
- May 2025: Supply Chain 24/7 released its 2025 Pallet Industry Survey, confirming 28% plastic-pallet adoption and 89% shipper demand for automation-compatible specifications.
- April 2025: World Bank’s Commodity Markets Outlook projected Brent crude at USD 64 per barrel for 2025, guiding virgin polyolefin resin cost expectations across pallet manufacturing.


Global Plastic Pallets Market Report Scope
The Plastic Pallets Market Report is Segmented by Material Type (High-Density Polyethylene, Polypropylene, Recycled Materials), Pallet Type (Nestable, Rackable, Stackable, Display / Custom), End-User Industry (Food and Beverage, Chemical, Pharmaceutical and Healthcare, Retail and E-Commerce, Logistics and Warehousing, Automotive, Other End-User Industries), Load Capacity (Light-Duty Pallets, Medium-Duty Pallets, High-Duty Pallets), and Geography (North America, South America, Europe, Asia-Pacific, Middle East and Africa). The Market Forecasts are Provided in Terms of Value (USD).
| High-Density Polyethylene |
| Polypropylene |
| Recycled Materials |
| Nestable |
| Rackable |
| Stackable |
| Display / Custom |
| Food and Beverage |
| Chemical |
| Pharmaceutical and Healthcare |
| Retail and E-Commerce |
| Logistics and Warehousing |
| Automotive |
| Other End-User Industries |
| Light-Duty Pallets |
| Medium-Duty Pallets |
| High-Duty Pallets |
| North America | United States | |
| Canada | ||
| Mexico | ||
| South America | Brazil | |
| Argentina | ||
| Rest of South America | ||
| Europe | United Kingdom | |
| Germany | ||
| France | ||
| Italy | ||
| Rest of Europe | ||
| Asia Pacific | China | |
| Japan | ||
| India | ||
| South Korea | ||
| Rest of Asia Pacific | ||
| Middle East and Africa | Middle East | United Arab Emirates |
| Saudi Arabia | ||
| Rest of Middle East | ||
| Africa | South Africa | |
| Egypt | ||
| Rest of Africa | ||
| By Material Type | High-Density Polyethylene | ||
| Polypropylene | |||
| Recycled Materials | |||
| By Pallet Type | Nestable | ||
| Rackable | |||
| Stackable | |||
| Display / Custom | |||
| By End-User Industry | Food and Beverage | ||
| Chemical | |||
| Pharmaceutical and Healthcare | |||
| Retail and E-Commerce | |||
| Logistics and Warehousing | |||
| Automotive | |||
| Other End-User Industries | |||
| By Load Capacity | Light-Duty Pallets | ||
| Medium-Duty Pallets | |||
| High-Duty Pallets | |||
| By Geography | North America | United States | |
| Canada | |||
| Mexico | |||
| South America | Brazil | ||
| Argentina | |||
| Rest of South America | |||
| Europe | United Kingdom | ||
| Germany | |||
| France | |||
| Italy | |||
| Rest of Europe | |||
| Asia Pacific | China | ||
| Japan | |||
| India | |||
| South Korea | |||
| Rest of Asia Pacific | |||
| Middle East and Africa | Middle East | United Arab Emirates | |
| Saudi Arabia | |||
| Rest of Middle East | |||
| Africa | South Africa | ||
| Egypt | |||
| Rest of Africa | |||


Key Questions Answered in the Report
How large will the plastic pallets market become by 2031?
It is forecast to reach USD 15.68 billion, growing at a 10.38% CAGR from 2026 to 2031.
Which pallet type is expanding fastest?
Display and custom configurations are projected to post an 11.23% CAGR as retailers merge merchandising with logistics.
Why are pharmaceutical shippers switching to plastic?
Cold-chain GDP guidelines require cleanable, traceable platforms, and plastic meets those hygiene and validation needs better than wood.
What limits adoption in Africa and South America?
Sparse reverse-logistics infrastructure makes it costly to retrieve pallets, undermining the pooling value proposition.
How do pooling services lower costs?
Providers spread pallet capital over many trips and customers, converting fixed purchase costs into variable fees that cut total ownership costs by 30-40%.
Which region will grow fastest through 2031?
The Middle East is set to expand at an 11.41% CAGR, supported by large-scale logistics investments under Saudi Vision 2030.
Page last updated on:


