Pipeline Integrity Management Market Size and Share
Market Overview
| Study Period | 2021 - 2031 |
|---|---|
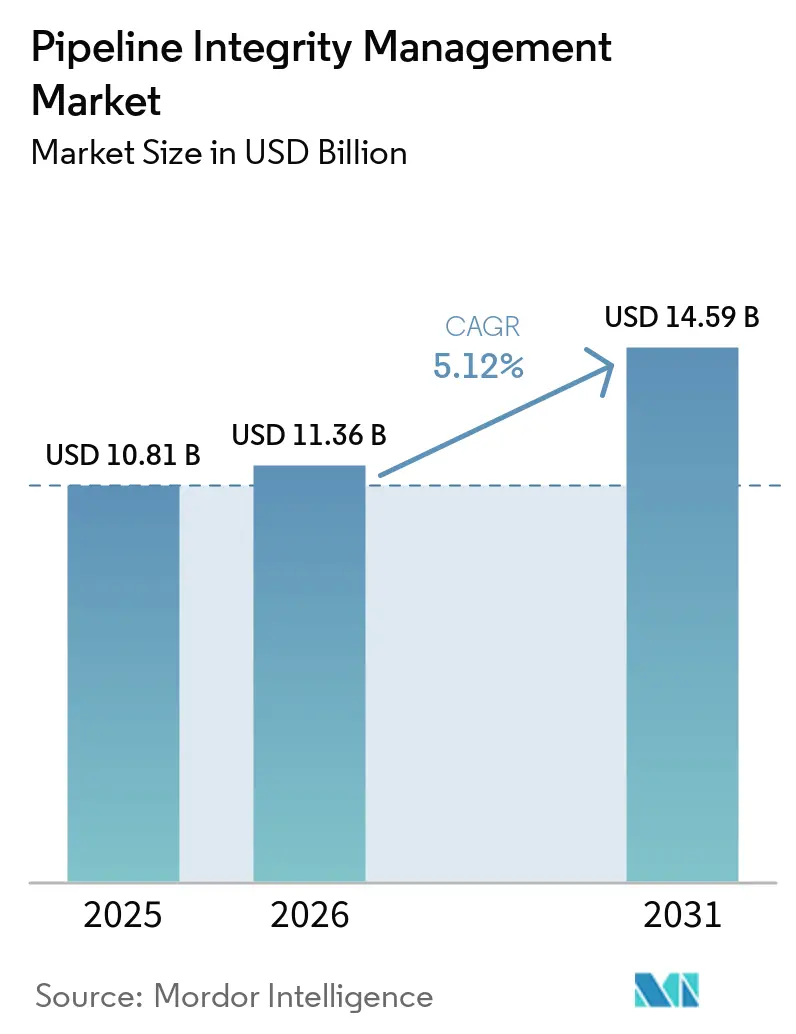
| Market Size (2026) | USD 11.36 Billion |
| Market Size (2031) | USD 14.59 Billion |
| Growth Rate (2026 - 2031) | 5.12% CAGR |
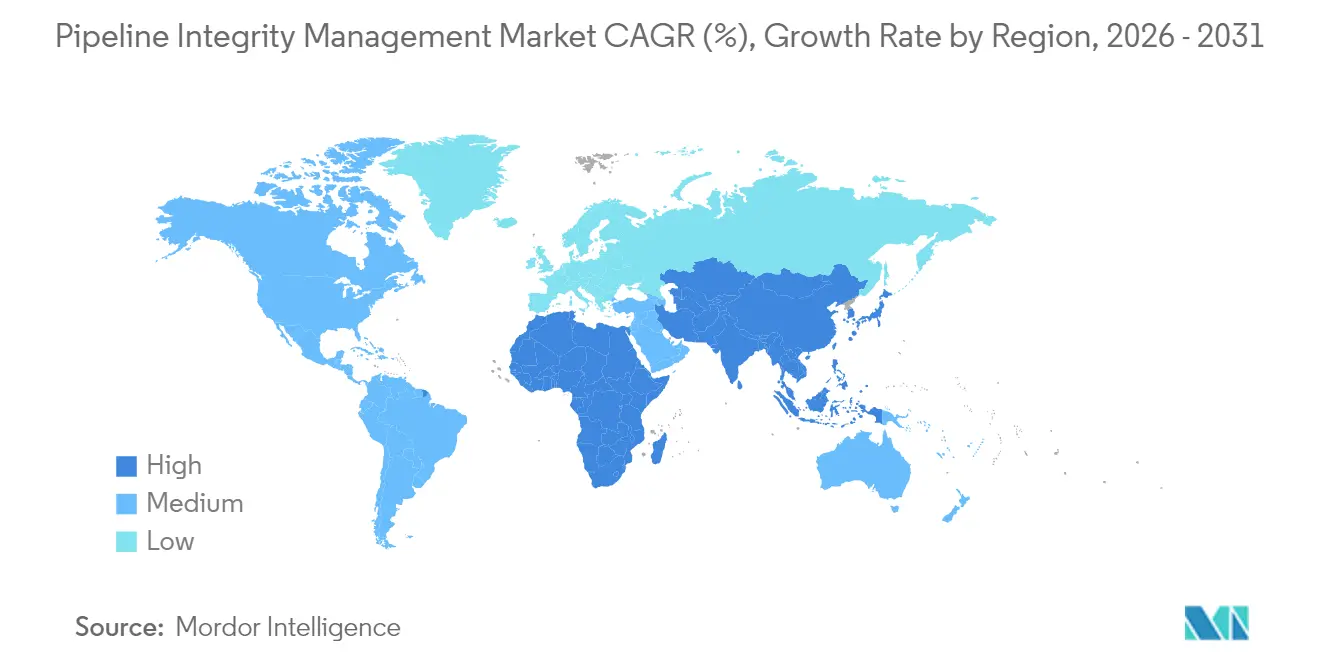
| Fastest Growing Market | Asia Pacific |
| Largest Market | North America |
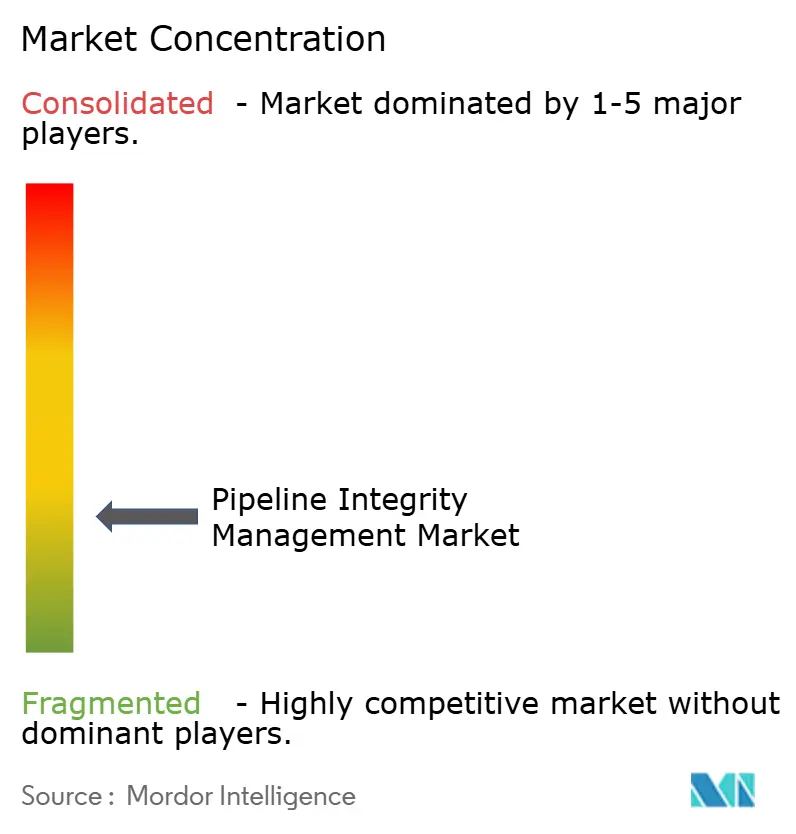
| Market Concentration | Low |
Major Players *Disclaimer: Major Players sorted in no particular order Image © Mordor Intelligence. Reuse requires attribution under CC BY 4.0. | |
Pipeline Integrity Management Market Analysis by Mordor Intelligence
The Pipeline Integrity Management market size is expected to grow from USD 10.81 billion in 2025 to USD 11.36 billion in 2026 and is forecast to reach USD 14.59 billion by 2031 at 5.12% CAGR over 2026-2031.
Growth rests on three pillars: the retrofit wave sweeping aging OECD pipeline systems, the rapid construction of new long-haul lines in emerging regions, and the industrywide shift toward digital monitoring that trims inspection downtime by 30% and sharpens predictive maintenance accuracy. Natural gas assets remain the primary revenue source; however, LNG, hydrogen, and CO₂ corridors introduce more stringent material and monitoring requirements, creating premium service niches.[1]Pipeline Safety Trust, “Hydrogen Pipelines: Unique Risks Prove Dangerous for Pipeline Transportation,” pstrust.org Onshore routes still dominate, but ultra-deepwater projects beyond 1,500 m spur faster offshore spending as operators deploy advanced subsea inspection tools. Services hold the largest revenue share, although software platforms enjoy the quickest rise as operators recognize the value of unified data environments and AI-driven decision support.
Key Report Takeaways
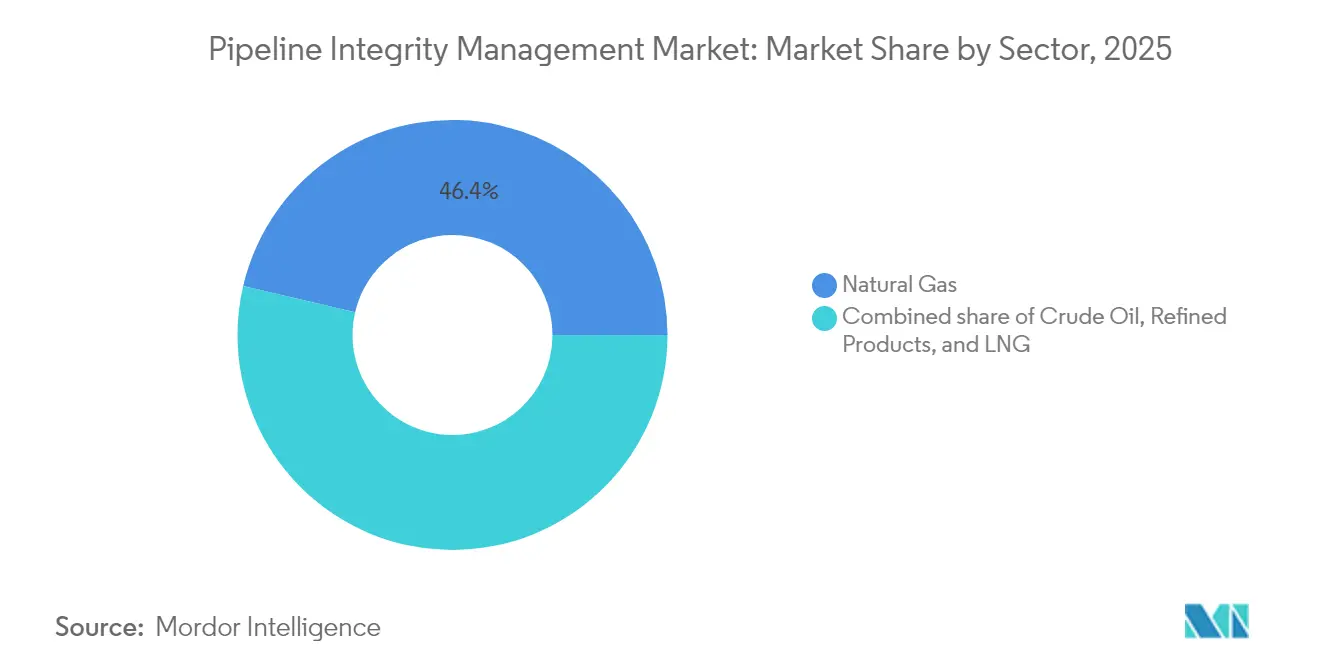
- By product type, natural-gas pipelines led with a 46.35% market share in pipeline integrity management in 2025, while LNG infrastructure posted the highest 6.29% CAGR through 2031.
- By service type, inspection services accounted for 39.05% of the pipeline integrity management market size in 2025, while digital monitoring and analytics expanded at an 8.07% CAGR through 2031.
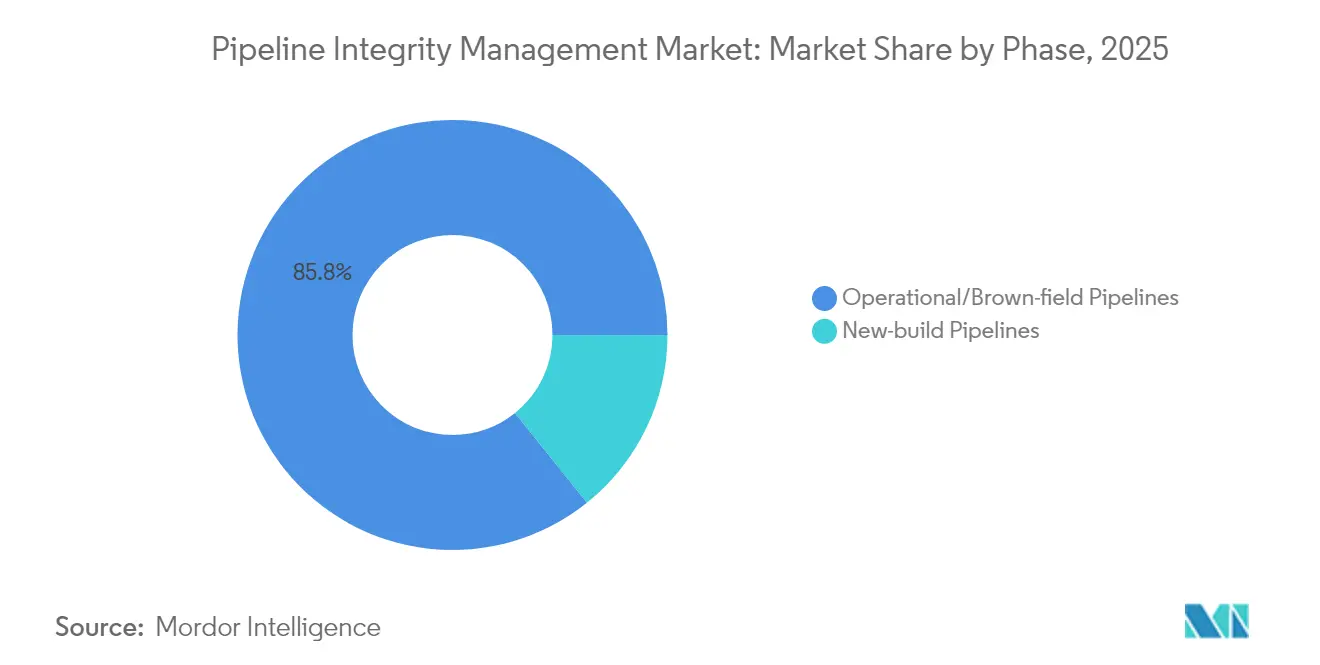
- By phase, operational or brownfield lines captured an 85.75% share in 2025; new-build pipelines are projected to run at a 5.78% CAGR over the forecast period.
- By solution type, services commanded 65.05% of 2025 revenue, while software platforms climbed at a 9.31% CAGR toward 2031.
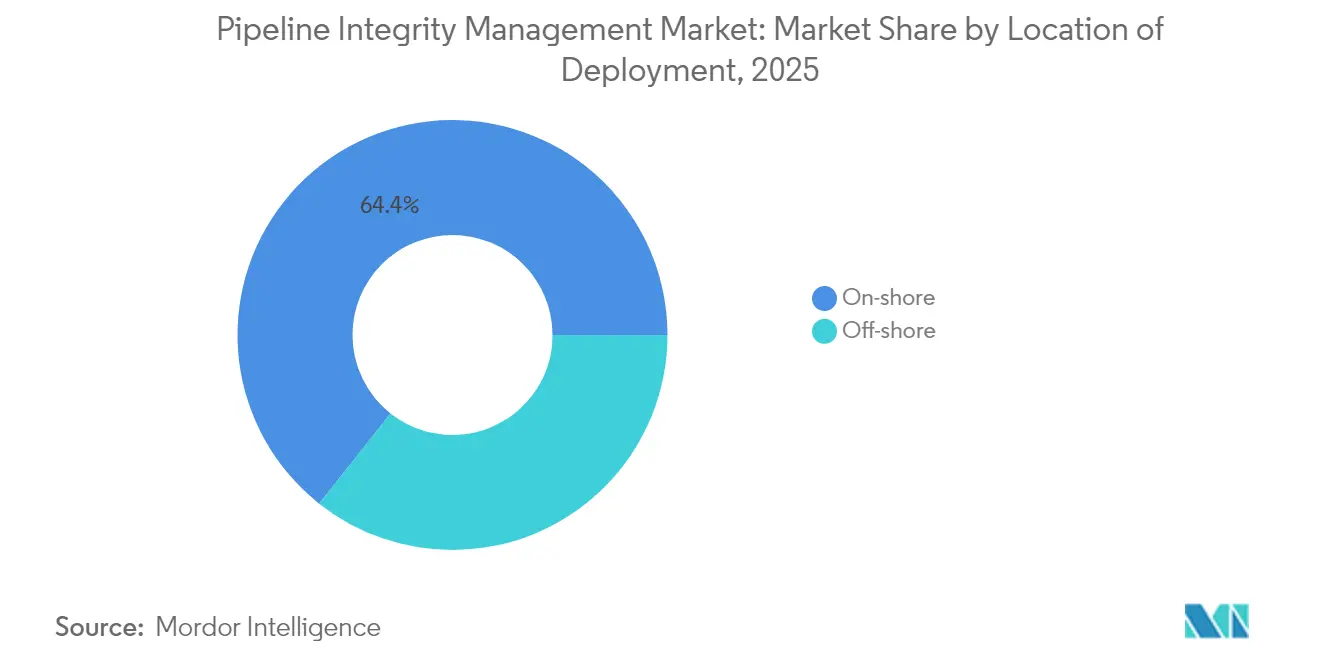
- By location of deployment, onshore assets held a 64.35% share in 2025, yet offshore expenditure advances at a 6.68% CAGR as more ultra-deepwater fields come onstream.
- By geography, North America retained a 38.85% share in 2025, while the Asia Pacific region records the swiftest 7.56% CAGR through 2031.
Note: Market size and forecast figures in this report are generated using Mordor Intelligence’s proprietary estimation framework, updated with the latest available data and insights as of 2026.
Global Pipeline Integrity Management Market Trends and Insights
Drivers Impact Analysis*
| Driver | (~) % Impact on CAGR Forecast | Geographic Relevance | Impact Timeline |
|---|---|---|---|
| Aging pipeline networks in OECD create a retrofit wave | +1.5% | North America & Europe | Long term (≥ 4 years) |
| Stringent integrity-related regulations (PHMSA, CSA Z662) | +0.8% | Global with focus on North America | Medium term (2-4 years) |
| On-going build-out of long-haul gas lines in APAC & MEA | +0.7% | APAC & MEA | Long term (≥ 4 years) |
| Off-shore ultra-deepwater projects > 1,500 m surge | +0.5% | Global offshore regions | Medium term (2-4 years) |
| AI-enabled digital twins slash inspection downtime | +0.4% | Global, early uptake in North America | Short term (≤ 2 years) |
| New hydrogen/CO₂ pipelines need higher integrity specs | +0.3% | Europe & North America | Long term (≥ 4 years) |
| Source: Mordor Intelligence | |||
Aging Pipeline Networks in OECD Create a Retrofit Wave
More than half of the 2.5 million mi of U.S. pipe installed in the 1950s-1960s now exceeds design life, driving continuous demand for smart pigging, cathodic-protection upgrades, and real-time corrosion monitoring. Similar retrofit needs span Canada and Europe, where harsh climates and legacy steel grades heighten risk. Operators find that proactive integrity programs cost significantly less than replacement and are approved by regulators more quickly. Heightened public scrutiny after incidents strengthens the business case for predictive maintenance. The retrofit cycle sustains a decades-long revenue stream for service providers across the pipeline integrity management market.
Stringent Integrity-Related Regulations Drive Compliance Investment
PHMSA’s 2024-2025 rules mandate expanded methane detection, stricter repair criteria, and increased inspection frequency, prompting operators to adopt advanced assessment methods.[2]ASME, “Direct Assessment (DA) White Paper,” asmedigitalcollection.asme.org Canada’s CSA Z662 mirrors the trend, requiring documented integrity programs and third-party verification. Compliance spending now forms a solid foundation under the pipeline integrity management market, insulating service demand from fluctuations in commodity prices. Vendors that can demonstrate measurable leak reduction and risk mitigation gains enjoy a clear competitive advantage.
On-going Build-out of Long-haul Gas Lines in APAC & MEA
Trans-ASEAN corridors, China’s 10,000 km per year expansions, and India’s city gas targets showcase the scale of new lines requiring integrity planning from day one.[3]Nature, “Effect of Microstructure on Hydrogen Permeation and Trapping in Natural Gas Pipeline Steels,” nature.com Developers embed fiber-optic sensing, high-resolution pigs, and digital twins during construction to lower lifetime cost. Service contracts begin with design advisory and continue through commissioning and operation, strengthening vendor ties and lifting pipeline integrity management market revenue in high-growth regions.
Off-shore Ultra-deepwater Projects Surge Beyond 1,500 Meters
Extreme pressures and temperatures accelerate corrosion and fatigue, necessitating ultrasonic and electromagnetic tools specifically designed for subsea deployment. Operators rely on autonomous underwater vehicles and real-time condition analytics to protect billion-dollar oil and gas flowlines. Service intensity per route mile is higher than onshore work, so offshore spending outpaces volume growth, bolstering the pipeline integrity management market.
Restraints Impact Analysis*
| Restraint | (~) % Impact on CAGR Forecast | Geographic Relevance | Impact Timeline |
|---|---|---|---|
| CAPEX cyclicality of upstream & midstream spending | –0.6% | Global, especially North America | Short term (≤ 2 years) |
| High initial cost of advanced ILI tools | –0.5% | Global | Medium term (2-4 years) |
| Cyber-security risk slowing IoT sensor rollout | –0.3% | Global developed markets | Short term (≤ 2 years) |
| Shortage of certified NDE technicians | –0.3% | Global | Medium term (2-4 years) |
| Source: Mordor Intelligence | |||
CAPEX Cyclicality of Upstream & Midstream Spending
Investment falls when prices soften, delaying discretionary inspections and digital upgrades.[4]Pipeline Journal, “Challenges in Pipeline Industry and Possible Solutions,” pipeline-journal.net Operators focus on bare-minimum compliance, trimming near-term revenue in the pipeline integrity management market. Vendors with subscription software and multi-sector exposure ride out downturns more smoothly.
High Initial Cost of Advanced ILI Tools
Smart pigs priced above USD 5 million plus training and data-analysis costs deter small operators. Leasing models spread the expense, but uptake remains slow, tempering the diffusion of technology across the pipeline integrity management market.
*Our forecasts treat driver/restraint impacts as directional, not additive. The impact forecasts reflect baseline growth, mix effects, and variable interactions.
Segment Analysis
By Product Type: Natural Gas Leadership Amid LNG Acceleration
Natural-gas pipelines captured 46.35% revenue in 2025, anchoring the pipeline integrity management market. Established codes, vast installed mileage, and routine pigging sustain recurring demand. LNG-related lines grow at the fastest rate, with a 6.29% CAGR, as global liquefaction and regasification capacity expands. Cryogenic temperatures necessitate special steel and insulation requirements, thereby increasing inspection complexity. Crude oil and refined products pipelines follow in value, facing strict scrutiny for spill prevention and specialized corrosion threats. Providers able to cross-train crews and reuse data analytics across product categories enhance efficiency.
The LNG boom attracts vendors with expertise in cryogenic technology, leak-before-break modeling, and rapid vapor cloud dispersion analysis. Integrators embed permanent sensors during build-out to support lifetime digital twins. As LNG becomes integral to energy transition portfolios, its share of the pipeline integrity management market size is poised to widen steadily, rewarding early capability builders.


By Service Type: Inspection Dominance Amid Digital Analytics Surge
Inspection services generated 39.05% of the revenue in 2025 and remain compulsory under global codes. Magnetic flux leakage, ultrasonics, and EMAT tools detect corrosion and cracks before failure, anchoring the services lineup. Yet, digital monitoring and analytics grow at an 8.07% CAGR as cloud dashboards transform raw signals into actionable risk scores. Operators adopt continuous monitoring to defer costly full-bore inspections, lifting demand for sensor integration and AI model training.
Cleaning, repair, and cathodic-protection programs round out the service mix, each scaling with mileage and age. Providers bundling mechanical services with software analytics secure stickier contracts. The shift toward outcome-based pricing accelerates, tying fees to leak-rate reduction or uptime gains inside the pipeline integrity management market.
By Phase: Brownfield Dominance Reflects Infrastructure Maturity
Operational assets held an 85.75% share in 2025, underscoring the significant installed base that requires ongoing care. Legacy drawings and material uncertainties complicate risk assessment, driving the use of high-resolution ILI tools and conservative re-inspection cycles. Brownfield programs also integrate ground-penetrating radar and drone photogrammetry to locate coating holidays and encroachments.
New-build lines advance at a 5.78% CAGR, led by APAC and hydrogen pilot corridors in Europe. Owners specify higher steel grades, pre-install fiber optics, and commission baseline smart-pig runs to feed digital twins. Embedding integrity considerations at the design stage reduces lifetime cost and expands software revenue pools within the pipeline integrity management market.
By Solution Type: Services Leadership Amid Software Acceleration
Services accounted for 65.05% of 2025 spending. Field crews, engineering analyses, and regulatory documentation remain labor-intensive. Hardware, from smart pigs to remote sensors, represents foundational capex but faces margin pressure as competitors proliferate. Software posts a 9.31% CAGR, reflecting operator appetite for consolidated platforms that blend visualization, predictive analytics, and work-order management.
Interoperability becomes a key tender criterion. Vendors integrate OPC UA gateways and API layers, allowing sensor streams to feed central dashboards seamlessly. Those delivering turnkey hardware-software-service packages strengthen customer lock-in and boost recurring revenue, fueling sustained growth in the pipeline integrity management market.
By Location of Deployment: Onshore Scale Versus Offshore Complexity
Onshore systems held a 64.35% share in 2025, supported by millions of miles of buried steel. Accessibility keeps inspection costs moderate, yet aging weld seams and third-party damage intensify the need for monitoring. Satellite imagery, aerial lidar, and right-of-way drones enrich risk models.
Offshore work grows at a 6.68% CAGR. Water depth, pressure, and temperature extremes mandate custom tool design. Autonomous underwater vehicles perform external scans, while fiber-optic cables trace strain and temperature along flowlines. Revenue per mile is higher offshore, so vendors with subsea robotics and deepwater metallurgical know-how secure strong margins inside the pipeline integrity management market.
Geography Analysis
North America retained 38.85% revenue share in 2025, backed by the world’s largest roster of aging lines and rigorous PHMSA oversight. Retrofit spending focuses on high-resolution cracking tools, methane-focused leak-detection, and AI-driven dig programs. Canada faces similar aging challenges in Arctic climates, while Mexico’s new trunk lines incorporate baseline smart-pig runs and fiber optics from the outset.
The Asia Pacific region records the fastest 7.56% CAGR as China, India, and Southeast Asian nations expand their gas and LNG grids. Project owners contract integrity design services during FEED to embed monitoring systems. Domestic vendors partner with global specialists to meet local content targets while accessing cutting-edge tools. Hydrogen demonstration corridors in Japan and South Korea further widen the opportunity.
Europe’s mature network encounters rising hydrogen-blend mandates, prompting material verification and retesting. Norway’s offshore arteries demand hyperbaric repair readiness. The Middle East invests in ultra-deepwater integrity and CO₂ pipelines linked to blue hydrogen hubs, whereas Africa’s greenfield networks favor turnkey integrity packages from the outset. South America concentrates on Brazil’s pre-salt flowlines and Argentina’s shale export corridors. These regional dynamics collectively support the durable expansion of the pipeline integrity management market.

Competitive Landscape
The pipeline integrity management market remains fragmented. Baker Hughes, DNV, SGS, and the ROSEN Group leverage broad portfolios and global labs to secure multi-year master service agreements. They continue to invest in AI engines, high-temperature ultrasound, and composite repair sleeves to protect the share. Digital-native challengers offer cloud-first platforms and usage-based pricing that undercut traditional day-rate models.
Consolidation persists - TD Williamson's merger with Petro-Line expands its crack-detection fleet, while Irth Solutions' acquisition of OneBridge adds depth in cloud analytics. Penspen joins Senslytics to co-develop anomaly-classification AI, cutting interpretation time by half.[5]Penspen, “Penspen and Senslytics Collaboration to Elevate Pipeline Integrity Analysis With Artificial Intelligence,” penspen.com Strategic alliances blend field heritage with digital agility, reshaping value propositions across the pipeline integrity management market.
Vendor differentiation hinges on proven inspection accuracy, downtime reduction metrics, and cyber-secure cloud environments bearing ISO 27001 credentials. Regional specialists, such as Eddyfi Technologies and Mistras Group, deepen niche tool penetration, while EPC firms pivot toward long-term integrity and operations and maintenance (O&M) contracts. Competitive intensity, therefore, centers on technology innovation, speed, and the ability to deliver full-lifecycle solutions.
Pipeline Integrity Management Industry Leaders
Baker Hughes Company
SGS SA
Bureau Veritas SA
DNV AS
ROSEN Group
- *Disclaimer: Major Players sorted in no particular order

Recent Industry Developments
- July 2025: Sinopec confirmed a USD 20 billion investment in a 400 km hydrogen pipeline linking Ulanqab to Beijing, creating one of the world’s largest dedicated hydrogen corridors.
- October 2024: Enbridge partnered with Microsoft to deploy an AI-powered Right-of-Way Threat Identification System, which increased threat detection accuracy by 30%.
- September 2024: Penspen and Senslytics launched an AI-driven integrity analysis platform targeting anomaly classification and corrective prioritization.
- September 2024: NDT Global introduced a 56-inch ultrasonic tool in collaboration with Saudi Aramco, enhancing its large-diameter inspection capability.


Global Pipeline Integrity Management Market Report Scope
The pipeline integrity management market report includes:
| Crude Oil |
| Natural Gas |
| Refined Products |
| LNG |
| Inspection Services |
| Cleaning Services |
| Repair and Refurbishment Services |
| Digital Monitoring and Analytics |
| Cathodic-protection Services |
| New-build Pipelines |
| Operational/Brown-field Pipelines |
| Hardware (ILI tools, sensors) |
| Software (Integrity platforms) |
| Services (EPC and O&M) |
| On-shore |
| Off-shore |
| North America | United States |
| Canada | |
| Mexico | |
| Europe | Norway |
| United Kingdom | |
| Russia | |
| Netherlands | |
| Germany | |
| Rest of Europe | |
| Asia Pacific | China |
| India | |
| Japan | |
| South Korea | |
| ASEAN Countries | |
| Australia | |
| Rest of Asia-Pacific | |
| South America | Brazil |
| Argentina | |
| Colombia | |
| Rest of South America | |
| Middle East and Africa | Saudi Arabia |
| United Arab Emirates | |
| Qatar | |
| Nigeria | |
| South Africa | |
| Rest of Middle East and Africa |
| By Product Type | Crude Oil | |
| Natural Gas | ||
| Refined Products | ||
| LNG | ||
| By Service Type | Inspection Services | |
| Cleaning Services | ||
| Repair and Refurbishment Services | ||
| Digital Monitoring and Analytics | ||
| Cathodic-protection Services | ||
| By Phase | New-build Pipelines | |
| Operational/Brown-field Pipelines | ||
| By Solution Type | Hardware (ILI tools, sensors) | |
| Software (Integrity platforms) | ||
| Services (EPC and O&M) | ||
| By Location of Deployment | On-shore | |
| Off-shore | ||
| By Geography | North America | United States |
| Canada | ||
| Mexico | ||
| Europe | Norway | |
| United Kingdom | ||
| Russia | ||
| Netherlands | ||
| Germany | ||
| Rest of Europe | ||
| Asia Pacific | China | |
| India | ||
| Japan | ||
| South Korea | ||
| ASEAN Countries | ||
| Australia | ||
| Rest of Asia-Pacific | ||
| South America | Brazil | |
| Argentina | ||
| Colombia | ||
| Rest of South America | ||
| Middle East and Africa | Saudi Arabia | |
| United Arab Emirates | ||
| Qatar | ||
| Nigeria | ||
| South Africa | ||
| Rest of Middle East and Africa | ||


Key Questions Answered in the Report
What is the projected value of the pipeline integrity management market by 2031?
The market is forecast to reach USD 14.59 billion by 2031.
Which service category is growing the fastest within pipeline integrity programs?
Digital monitoring and analytics is expanding at an 8.07% CAGR through 2031 as operators adopt predictive maintenance.
Why is LNG infrastructure attracting more integrity spending?
LNG pipelines face cryogenic temperatures and rapid vaporization risks, driving a 6.29% CAGR in integrity outlays.
Which region records the highest growth rate for integrity services?
Asia Pacific leads with a 7.56% CAGR, underpinned by massive new construction in China, India, and Southeast Asia.
How do hydrogen pipelines differ in integrity requirements from natural-gas lines?
Hydrogen induces steel embrittlement and permeates seals, requiring higher-grade materials, specialized inspection tools, and tighter re-inspection intervals.
What main factor stabilizes demand despite commodity price swings?
Stringent global regulations, including expanded PHMSA rules, create a baseline of mandatory spending on pipeline integrity programs.
Page last updated on:


