Grow Lights Market Size and Share
Market Overview
| Study Period | 2020 - 2031 |
|---|---|
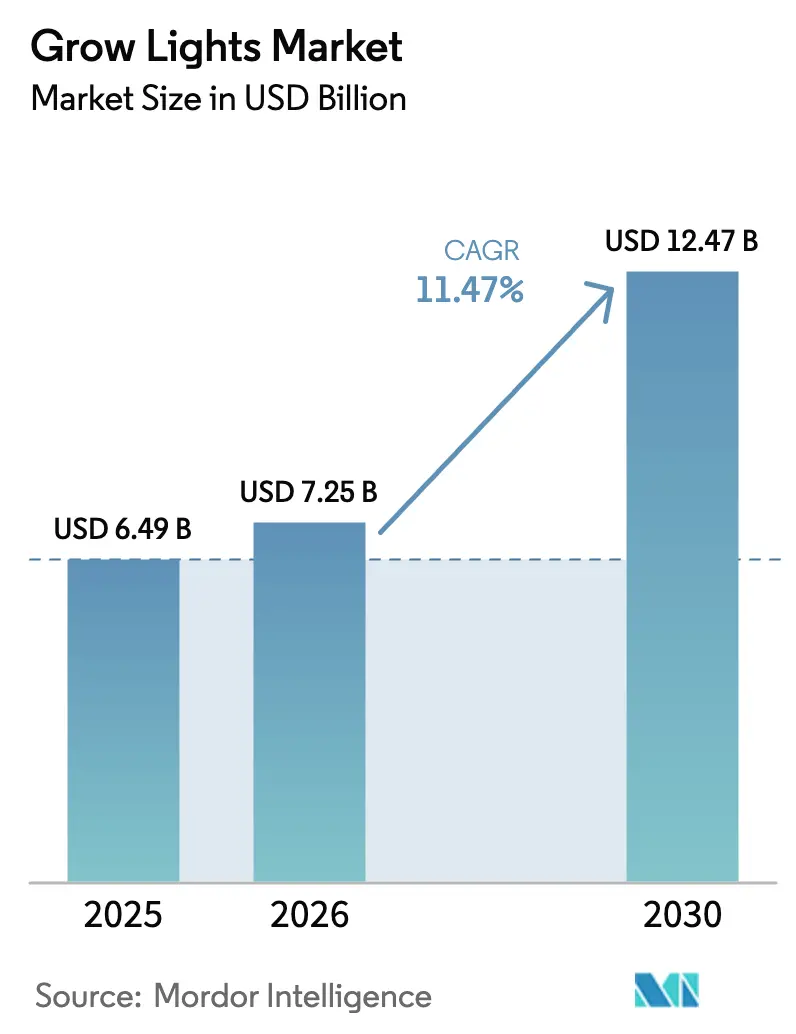
| Market Size (2026) | USD 7.25 Billion |
| Market Size (2030) | USD 12.47 Billion |
| Growth Rate (2026 - 2031) | 11.47% CAGR |
| Fastest Growing Market | Asia-Pacific |
| Largest Market | Europe |
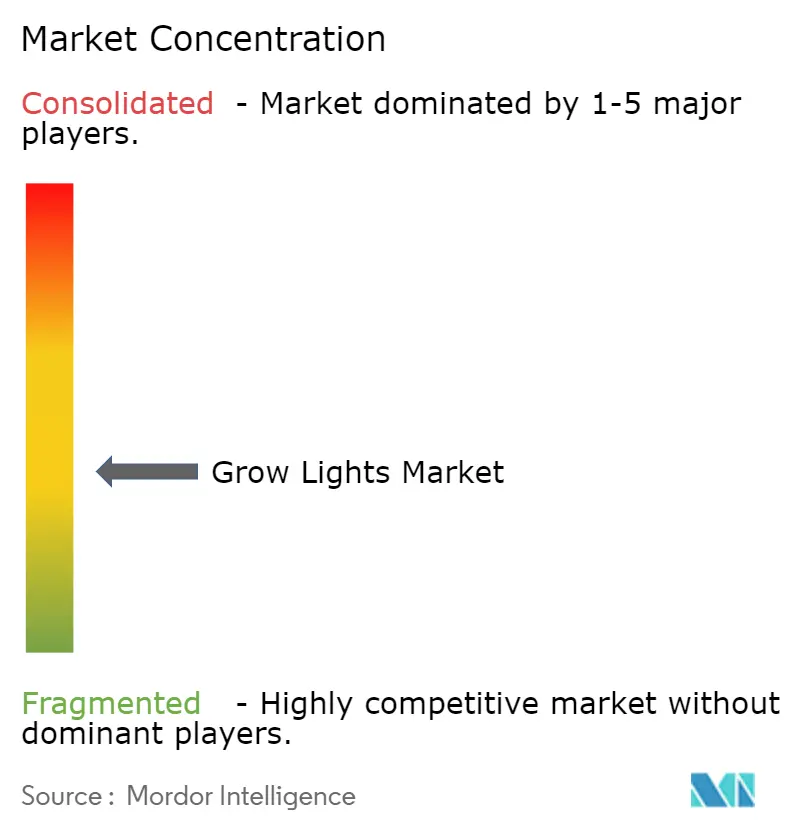
| Market Concentration | Medium |
Major Players*Disclaimer: Major Players sorted in no particular order Image © Mordor Intelligence. Reuse requires attribution under CC BY 4.0. | |
Grow Lights Market Analysis by Mordor Intelligence
The Grow Lights Market size is projected to be USD 6.49 billion in 2025, USD 7.25 billion in 2026, and reach USD 12.47 billion by 2030, growing at a CAGR of 11.47% from 2026 to 2030. Rising urban populations, limited arable land, and climate instability are steering fresh-produce and cannabis growers toward controlled-environment agriculture, where reliable, spectrum-tuned lighting is indispensable. Capital is being funneled into warehouse conversions across Asia-Pacific mega-cities, GCC-backed urban-agriculture programs, and newly legalized cannabis operations in Germany and several U.S. states, all of which rely on high-efficacy LED fixtures. Meanwhile, services built around light-as-a-service contracts are lowering entry barriers for smaller operators by shifting cap-ex to opex, and IoT-enabled spectrum controls promise double-digit energy savings that can restore healthy payback periods even in volatile power markets. Competition is moderate; a handful of global brands lead on spectrum science and software integration, while cost-focused Chinese suppliers dominate commodity fixtures.
Key Report Takeaways
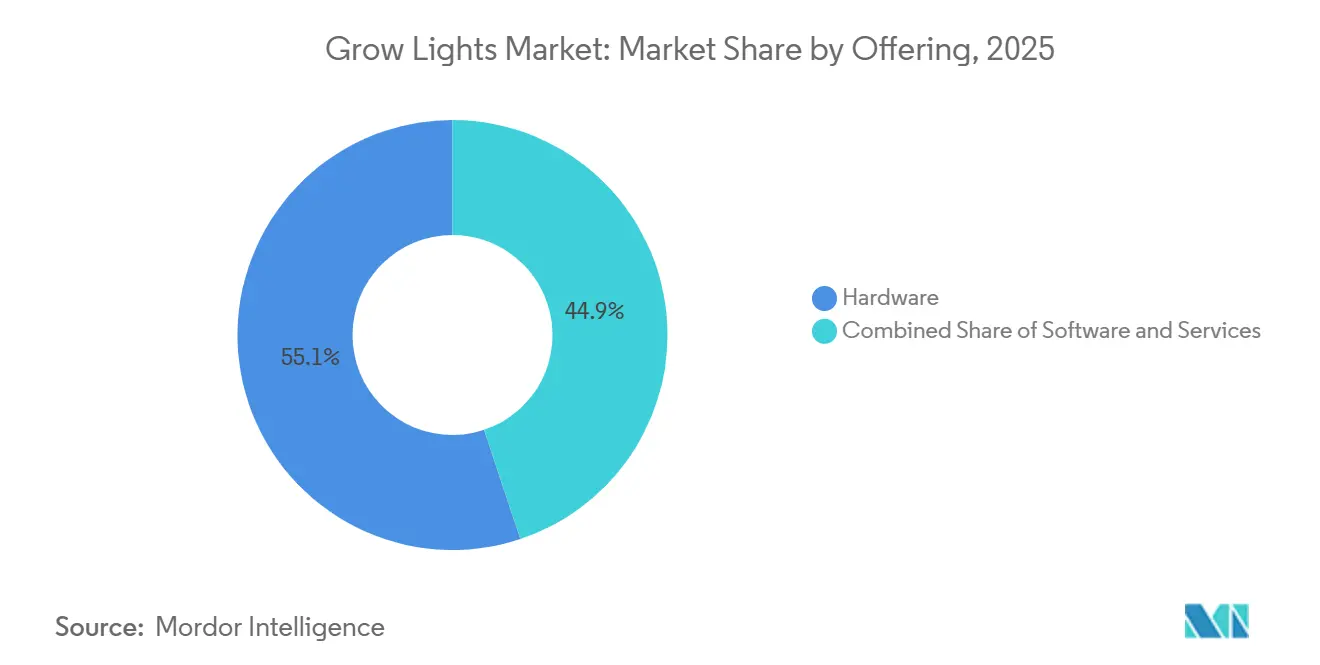
- By offering, hardware led with 55.12% revenue share in 2025, whereas services are projected to expand at a 22.40% CAGR through 2031.
- By light-source technology, LEDs captured 68.53% of the grow lights market share in 2025, and the segment is forecast to grow at 20.18% to 2031.
- By spectrum, narrow-spectrum fixtures held 60.01% of 2025 sales, while full-spectrum solutions are advancing at 20.23% CAGR.
- By application, commercial greenhouses accounted for 41.53% of 2025 revenue, yet vertical farming is the fastest-growing segment at 21.60% CAGR to 2031.
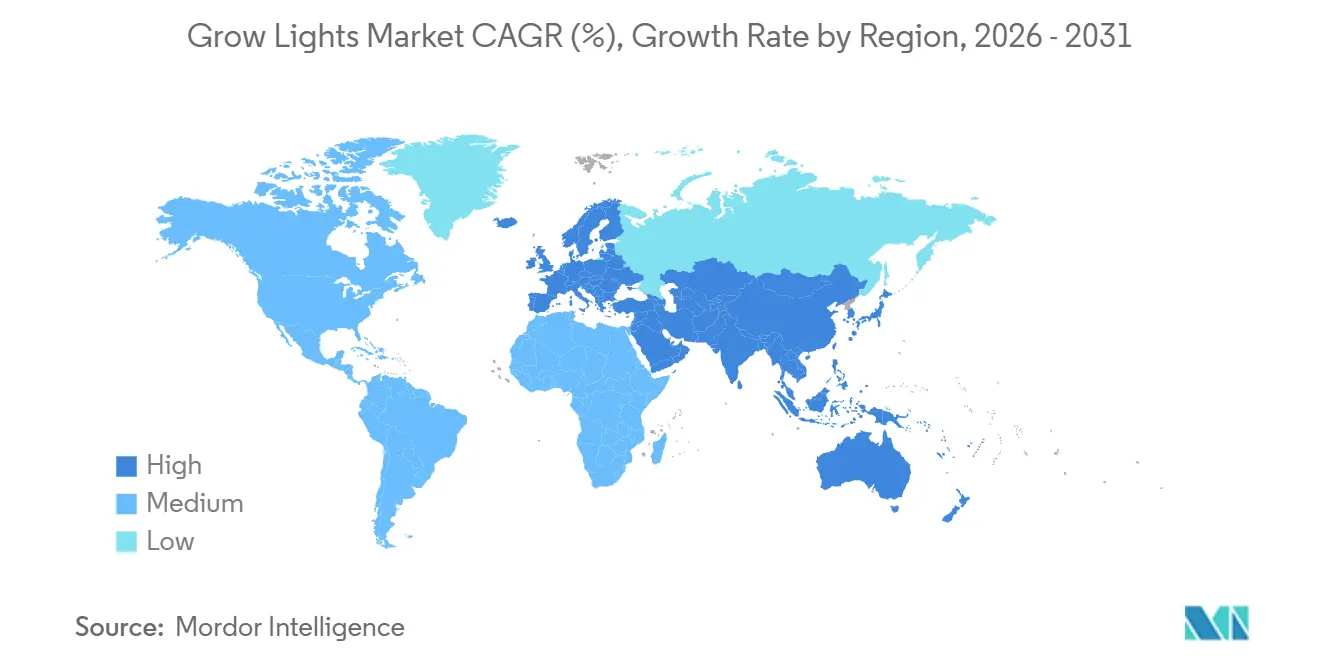
- By geography, Europe retained 30.43% market share in 2025, but Asia-Pacific is expected to expand at 23.90% CAGR, the highest among regions.
Note: Market size and forecast figures in this report are generated using Mordor Intelligence’s proprietary estimation framework, updated with the latest available data and insights as of January 2026.
Global Grow Lights Market Trends and Insights
Drivers Impact Analysis*
| Driver | (~) % Impact on CAGR Forecast | Geographic Relevance | Impact Timeline |
|---|---|---|---|
| Off-season high-value crop production surge in Nordic vertical farms | +3.2% | Northern Europe, Canada, northern U.S. | Medium term (2-4 years) |
| Adult-use cannabis legalization accelerating controlled-environment capacity in Germany and U.S. | +4.1% | Germany, U.S., Canada | Short term (≤ 2 years) |
| GCC urban-agriculture grants and subsidized electricity | +2.8% | Saudi Arabia, UAE, Qatar, Kuwait | Medium term (2-4 years) |
| Mega-city warehouse conversions in Asia-Pacific | +3.9% | China, Japan, Singapore, South Korea, India | Medium term (2-4 years) |
| Adoption of IoT-enabled dynamic-spectrum controls | +2.7% | Global; early uptake in Netherlands, U.S., Japan | Long term (≥ 4 years) |
| Expansion of livestock photobiology programs | +1.9% | U.S., Netherlands, Norway | Long term (≥ 4 years) |
| Source: Mordor Intelligence | |||
Off-Season High-Value Crop Production Surge in Nordic Vertical Farms
Nordic vertical-farm operators leverage cool ambient temperatures and abundant hydropower to run LED arrays year-round with minimal HVAC overhead.[1]Nordic Harvest, “Company Factsheet,” Nordicharvest.dk Denmark’s 7,000 m² Nordic Harvest facility delivers 1,000 t of leafy greens annually, achieving yields 15 times higher per square meter than field agriculture while eliminating pesticide use. Finland’s 2025 viability study confirmed break-even in six years at electricity prices below EUR 0.08 kWh, a threshold common to hydro-rich grids. Asian investors have replicated the model in Taiwan, where typhoons disrupt open-field production and premium pricing offsets higher electricity tariffs. Fixture orders in this cluster specify ≥3.5 µmol J-¹ efficacy, favoring red-and-blue spectra that maximize photons per kilowatt-hour.
Adult-Use Cannabis Legalization Accelerating Controlled-Environment Capacity in Germany and U.S.
Germany’s April 2024 legalization triggered a construction pipeline targeting 200 t of annual flower by 2025, absorbing roughly 50,000 m² of canopy lit at 800-1,200 µmol m-² s-¹.[2]German Cannabis Association, “Cultivation Capacity Report 2025,” Cannabis-verband.de Parallel U.S. legalizations in Ohio and Minnesota added 1.2 million ft² of canopy demanding USD 150-250 ft-² in environmental controls, with LEDs a major cost line. Cultivators chase terpene richness, so full-spectrum fixtures are preferred despite a modest efficacy penalty. Fluence’s November 2025 “Red Sandwich” design blends white and red chips to deliver a 400-750 nm band at >3.2 µmol J-¹, purpose-built for cannabis. High compliance costs push smaller growers toward leasing, reinforcing services growth.
Gulf Cooperation Council Countries Urban-Agriculture Grants and Subsidized Electricity for Indoor Farms
The UAE’s AgTech Innovation Fund allocated AED 100 million (USD 27.2 million) in 2024 to vertical-farm pilots that cut food-import dependence above 80%.[3]UAE Ministry of Climate Change and Environment, “AgTech Innovation Fund Overview,” MoccAE.gov.ae Saudi Arabia’s Vision 2030 channels low-cost power at USD 0.03 kWh to new plant-factory hubs near Riyadh and Jeddah . Dubai aims for 30% local food production by 2030, and Qatar’s parallel program sustains greenhouse investment post-World-Cup. Investors see subsidized tariffs and grants flipping ROI from eight years to under five. Vendors demonstrating not only photon efficacy but also water-use efficiency gain bidding-edge in tenders.
Mega-City Warehouse Conversions in Asia-Pacific Addressing Arable-Land Scarcity
Urbanization is erasing farmland in China, Japan, and Singapore, spurring conversions of idle logistics hubs into vertical farms. Shanghai and Shenzhen facilities modeled after Plenty’s USD 300 million Compton farm are achieving 100-fold yield per m² while bypassing greenfield permitting delays. Japan’s Spread Co. produces 30,000 lettuce heads daily in a 4,800 m² plant that once stored auto parts. Singapore’s “30 by 30” initiative funds rack-based farms that compress time-to-revenue from 24 months to 12 by exploiting existing warehouse power and sprinkling infrastructure. LED makers offering plug-and-play, modular fixtures compatible with standard warehouse circuits win disproportionate orders.
Restraints Impact Analysis*
| Restraint | (~) % Impact on CAGR Forecast | Geographic Relevance | Impact Timeline |
|---|---|---|---|
| Tariffs on China-origin LED chips elevating fixture costs | -2.4% | U.S., Canada, Mexico | Short term (≤ 2 years) |
| Energy-price volatility undermining payback periods in European greenhouses | -3.1% | Netherlands, Germany, Belgium, U.K. | Medium term (2-4 years) |
| Inconsistent horticultural-lighting standards across ASEAN | -1.3% | Thailand, Vietnam, Malaysia, Indonesia, Philippines | Medium term (2-4 years) |
| High retrofitting cost for small-scale legacy HID greenhouses | -1.8% | Southern Europe, Mexico, China | Long term (≥ 4 years) |
| Source: Mordor Intelligence | |||
Tariffs on China-Origin LED Chips Elevating Fixture Costs in North America
Section 301 tariffs keep 25% duties on Chinese diodes, inflating landed fixture costs by 15-30% despite vendor re-sourcing to Vietnam and Malaysia. U.S. manufacturers such as California LightWorks report longer lead times and higher defect rates from alternative fabs, eroding margin or forcing price hikes that growers resist. Fluence leverages OSRAM’s Malaysian fab to mitigate impact, but even vertically integrated players pass some cost downstream. Deferred upgrades in North American greenhouses lessen fixture volumes, especially where cannabis revenues cannot cross-subsidize produce operations. Elevated interest rates above 7% on farm loans exacerbate cap-ex hesitancy.
Energy-Price Volatility Undermining Payback Periods in European Greenhouses
Post-2022 wholesale electricity remains 40-60% above pre-crisis norms in the Netherlands, Germany, and Belgium. Payback on LED retrofits stretched from 3-5 to 5-8 years, pushing some Westland tomato growers to idle capacity. Germany’s Bavaria and NRW regions postponed HPS-to-LED conversions, waiting for subsidy clarity. Spain partially offsets volatility with on-site solar, but smallholders lack up-front capital for PV-plus-LED stacks. Resulting demand contraction squeezes European fixture suppliers.
*Our forecasts treat driver/restraint impacts as directional, not additive. The impact forecasts reflect baseline growth, mix effects, and variable interactions.
Segment Analysis
By Offering: Services Pivot Gains Momentum
Services accounted for only 14.88% of the grow lights market in 2025, yet the segment is projected to grow at 22.40% CAGR as vendors bundle hardware, software, and agronomic support under light-as-a-service contracts. Hardware, still 55.12% of revenue, sees margin pressure from low-cost Asian imports even as volumes rise. The grow lights market size for services is estimated to reach USD 5.4 billion by 2031, driven by subscription models that shift cap-ex off grower balance sheets. Vendors monetize IoT data, remote diagnostics, and performance guarantees, creating sticky revenue and higher customer-lifetime value.
Software layers, though a small slice, act as pull-through; helioCORE and smartPAR optimize daily-light-integral targets and issue spectrum recipes crop-by-crop. Emerging markets in the Middle East and Southeast Asia, where horticultural expertise is scarce, lean heavily on turnkey services. As utilities roll out performance-based rebate schemes, third-party service providers assume measurement and verification duties, further accelerating adoption. Hardware declines as a percentage of grow lights market share yet remains indispensable, particularly for greenfield vertical-farm builds in Asia-Pacific.


By Light Source Technology: LED Dominance Deepens
LEDs represented 68.53% of the grow lights market share in 2025 and are forecast to expand at 20.18% CAGR through 2031 on the back of 3.9-4.0 µmol J-¹ efficacy benchmarks that dwarf legacy HID outputs. In value terms, the grow lights market size for LEDs is set to hit USD 12.8 billion by 2031. HID’s installed base still commands maintenance revenue but new purchases collapse as horticulture utilities withdraw rebates for 1.7 µmol J-¹ fixtures.
Fluorescent and induction lamps persist mainly in budget-constrained research institutes; however, grant conditions are increasingly mandating energy-efficient upgrades. Induction and plasma serve high-bay ornamental propagation but lack tunability, a must-have for cannabis and high-value produce. With wall-plug efficiencies surpassing 83%, incremental gains are now more plausible via thermal management and spectrum algorithms than diode physics. Machine learning that modulates spectra by growth stage or pathogen alerts forms the next innovation wave.
By Spectrum: Full-Spectrum Fixtures Surge in High-Value Crops
Narrow red-blue fixtures retained 60.01% revenue in 2025, yet full-spectrum systems are projected to grow at 20.23% CAGR as cannabis and ornamental growers chase terpene profiles and color vibrancy that command retail premiums. The grow lights market size for full-spectrum units is expected to triple by 2031 as multi-crop vertical farms standardize on one fixture type to reduce SKU complexity.
The efficiency penalty of phosphor-converted white LEDs shrinks as diode efficacy rises, making broad spectra less energy-expensive. Hybrid solutions that add far-red to narrow red-blue blends spread in Dutch tomato greenhouses, shortening crop cycles 7-10%. Fluence’s Red Sandwich proves spectrum design can recapture lost efficacy, signaling a shift from binary narrow-versus-broad debates to crop-specific photobiology.
By Power Rating: Mid-Power Sweet Spot
In 2025, fixtures rated between 300 and 1,000 W accounted for 37.26% of the revenue, and they are projected to lead the grow lights market with the fastest CAGR of 23.03% through 203. These fixtures strike a balance among photon density, installation labor, and HVAC load, all of which are crucial metrics influencing the total cost of ownership. This combination of factors makes them a preferred choice for many commercial growers seeking efficiency and cost-effectiveness. While devices rated below 300 W dominate the hobbyist segment due to their affordability and ease of use, they are nearing saturation as the market matures. On the other hand, fixtures exceeding 1,000 W remain a niche market, primarily due to their stringent cooling requirements, which can increase operational complexity and costs.
Geographical nuances play a pivotal role in shaping demand patterns across regions. For instance, 230-V circuits in Europe seamlessly power 600 W bars, making them a popular choice for growers in the region. In contrast, North American greenhouses operating on 120-V circuits might need rewiring to accommodate higher wattage units, which can add to installation costs and complexity. Vendors are increasingly leaning towards modular designs to address these challenges. By utilizing common LED engines to scale wattage, they can customize their offerings to meet diverse customer needs without significantly expanding their inventory. This approach not only enhances operational efficiency but also allows vendors to remain competitive in a rapidly evolving market.
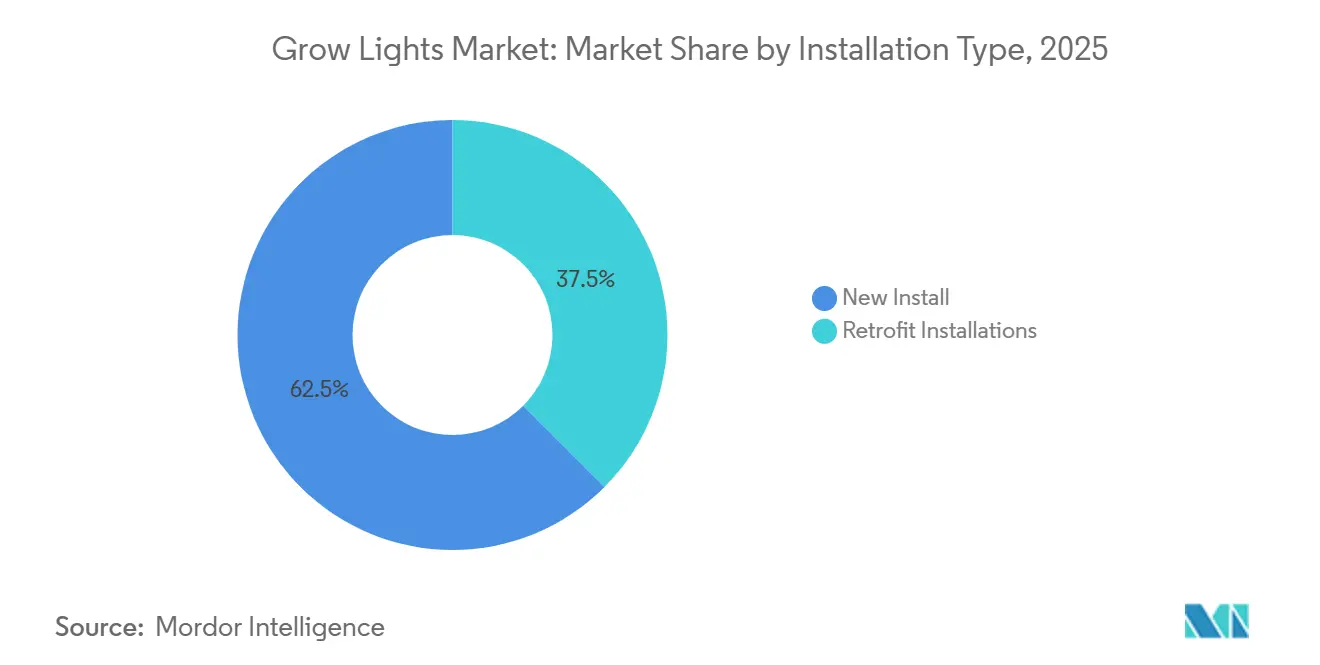
By Installation Type: New Builds Lead, Retrofits Accelerate Where Power is Costly
New installations absorbed 62.49% of 2025 spend as vertical-farm greenfields and cannabis sites spec LEDs from day one. Retrofits, however, are a latent giant; the grow lights market size tied to converting HID acreage could surpass USD 20 billion post-2031 if power prices remain elevated. Where electricity tops USD 0.12 kWh, LED retrofits pay back in 3-4 years, a threshold met in California and Germany.
Challenges include structural upgrades in 1990s greenhouses and downtime risk, but bundled financing with utility rebates is closing the gap. Suppliers such as LumiGrow and California LightWorks seize share by offering turnkey packages that guarantee energy savings, transferring technical risk away from growers.
By Application: Vertical Farming Keeps the Fastest Lane
Commercial greenhouses generated 41.53% of 2025 revenue, yet vertical farming is projected to rise at 21.60% CAGR as urban consumers demand year-round, pesticide-free produce. The grow lights market size attached to vertical farms could reach USD 8.3 billion by 2031. Livestock photobiology remains nascent but could eclipse leafy-green applications if even 30% of global poultry barns convert by 2035.
Indoor single-tier farms and research institutes offer steady, if modest, demand. Container farms are proliferating where restaurant chains value same-day harvest, notably in Seoul and Singapore. Fixture makers that supply broad-spectrum, dimmable units suitable for mixed-crop production capture recurring orders as operators iterate menus.
Geography Analysis
Europe led with 30.43% of 2025 revenue, but growth is capped at 14-16% annually because energy-price volatility extends retrofit payback windows. The Netherlands’ 10,000 ha greenhouse complex still anchors innovation; however, several Westland sites idled rows in 2024 as gas and power stayed 50% above 2019 levels. Germany’s legalization of recreational cannabis injected counter-cyclical demand, adding 50,000 m² of canopy by end-2025 and offsetting greenhouse softness. Spain leverages abundant solar to pair PV with LEDs, securing near-zero marginal electricity during daylight. France and U.K. trail due to higher tariffs and fewer subsidies, though London container farms serving Michelin-star kitchens signal early adoption. Italy’s Ligurian ornamentals sector retrofits LEDs for color control, fueled by regional grants.
Asia-Pacific is forecast to grow the grow lights market at 23.90% CAGR through 2031, the fastest worldwide, as urban warehouses in Shanghai, Tokyo, and Singapore transform into vertical farms that circumvent farmland scarcity. China funneled USD 500 million into CEA in 2024-2025, targeting food-security and urban jobs. Japan’s Spread Co. and Mirai collectively operate facilities producing 100-plus t/day of lettuce and strawberries, while South Korea’s N.Thing scales container farms to supply convenience stores. Singapore’s “30 by 30” grants fast-track new builds in repurposed factories, ensuring fixture demand stays robust. India and Australia represent emerging growth corridors where rooftop farms and desert hydroponics, respectively, are nascent but promising.
North America’s trajectory is mixed. Section 301 tariffs inflate fixture costs, softening greenhouse retrofits, yet cannabis remains a powerful pull, especially in newly legal U.S. states . Canada’s Ontario and B.C. greenhouses draw 30-40% rebates, nudging LEDs into cucumber and pepper operations. Mexico exports to the U.S. but wrestles with financing; without subsidized loans, retrofits lag. The GCC’s subsidy-rich environment propels Saudi and Emirati vertical farms; electricity at USD 0.03 kWh makes LEDs economically irresistible. Africa and South America remain nascent, yet pilot projects in Kenya, South Africa, Brazil, and Chile build localized proof-points despite import-cost hurdles.

Regulatory Landscape
Safety, energy-efficiency, and market-access requirements are tightening for horticultural luminaires, which is increasing the importance of standard-based qualification for LED fixtures and controls. In North America, ANSI/CAN/UL 8800:2025 (published March 2025) is a key safety benchmark for horticultural lighting equipment and systems, while California Energy Code (Title 24, Part 6, 2025) sets a minimum Photosynthetic Photon Efficacy (PPE) of 2.3 µmol/J for controlled-environment horticulture lighting systems in facilities with lighting loads exceeding 40 kW. This links code compliance directly to fixture efficacy and continues to push legacy low-efficacy technologies toward the margin.
Performance baselines used for rebates and qualification are also converging with national and regional standards. The DesignLights Consortium (DLC) released Horticultural Technical Requirements V4.0 in October 2025, raising the bar for qualifying products in energy-savings programs. In Europe, CE marking remains central for access in the European Economic Area, with safety and photobiological risk considerations increasingly referenced through horticultural-luminaire-specific standards such as CENELEC EN IEC 63545:2026 (published April 2026). Separately, California stakeholders proposed in March 2026 to increase mandatory PPE for the 2028 code cycle from 2.3 to 2.5 µmol/J, indicating a higher compliance threshold for new CEH projects and reinforcing demand for high-efficacy LED architectures plus validated measurement practices.
Competitive Landscape
Signify, ams-OSRAM (Fluence), and Heliospectra together account for roughly 35-40% of revenue, giving the grow lights market a moderate-concentration profile. Signify capitalizes on its Philips heritage, launching the GrowWise Smart Spectrum platform in June 2025 and coupling fixtures with AI to optimize spectra in real time. Fluence integrates OSRAM diodes such as the May 2024 OSCONIQ P 3737, enabling its 2,400 µmol s-¹ RAPTR 2.0 bar to reduce fixture count per canopy by 15-20%. Heliospectra’s helioCORE hooks into Priva and Hoogendoorn climate loops, appealing to multi-site operators seeking central control.
Chinese suppliers, Everlight, NationStar, and dozens of Shenzhen assemblers, own the low-price tier with sub-USD 200 bars meeting baseline DLC efficacy, though lacking IoT or tunability. Mid-tier Western brands such as Gavita and California LightWorks differentiate via horticultural consultancies bundled with fixtures. White-space resides in livestock photobiology, where Once Inc. raised USD 2.5 million in February 2025 to develop salmon-optimized spectra, and in service models that shift financing risk from grower to vendor.
M&A potential is rising. Large conglomerates may snap up AI-lighting start-ups to lock in software IP, while regional fixture makers with strong channel reach but limited R&D look attractive to multinational acquirers seeking distribution. Intellectual-property litigation risk remains low as most diode patents near expiration, putting brand, agronomy services, and data analytics at the center of future competition.
Grow Lights Industry Leaders
OSRAM Licht AG
Heliospectra AB
Savant Systems Inc.
Signify
Lemnis Oreon BV
- *Disclaimer: Major Players sorted in no particular order

Market Opportunities and Future Outlook
The clearest whitespace is shifting from commodity fixtures toward standards-aligned, controllable systems that help growers qualify for efficiency programs and handle energy volatility. DLC Horticultural Technical Requirements V4.0 (effective October 2025) and the tightening efficacy language discussed for California Title 24 provide a more defined route for vendors that can document PPE, spectral performance, and controls capability across product lines, supporting bundled hardware-software-services offerings in commercial greenhouses and vertical farms. Within this report scope, services are expanding faster than hardware, and light-as-a-service and performance-guarantee models broaden adoption among operators that prioritize payback stability and measurement and verification.
China is also a distinct opportunity pocket as technical requirements for horticultural LEDs become more formalized. The China National Standardization Administration published GB/Z 44064-2024 (effective December 2024) for LED artificial lighting environments for plant growth, and GB/T 44473-2024 (effective June 1, 2025) for performance specifications covering horticultural LED lamps and modules. Together, these standards clarify targets for manufacturers planning compliant, scalable SKUs for greenhouse and plant-factory deployments. On the technology side, peer-reviewed 2026 results around tailored spectra (including RBW and far-red blends) and measured energy reductions in specific crops support further differentiation via multi-channel spectral tuning, recipe libraries, and integration with greenhouse climate platforms, reinforcing the move from single-metric PPFD selling toward crop-outcome and kWh-per-kg optimization.
Recent Industry Developments
- May 2026: ams OSRAM reported strong momentum in horticulture lighting and noted design-win traction across the US and Europe during Q1 2026 communications. The update reinforces the importance of application-specific LED components and vertically integrated supply options for fixture makers serving cannabis, greenhouse, and vertical-farm customers.
- November 2025: Fluence unveiled its "Red Sandwich" architecture delivering 400-750 nm output at greater than 3.2 µmol/J for cannabis and ornamental cultivation. The launch raised the competitive bar for full-spectrum solutions by pairing crop-quality spectra with efficacy levels that help protect payback periods under volatile electricity pricing.
- May 2024: ams OSRAM introduced the OSCONIQ P 3737 horticulture LED, expanding the component toolkit used in high-output grow-light bars. New diode options at the component level support higher photon flux per fixture and enable OEMs to reduce fixture counts per canopy in commercial installations.


Research Methodology Framework and Report Scope
Market Definition and Coverage
The grow lights market is counted as revenue earned from electric lighting products designed to support plant growth by providing usable light for photosynthesis in controlled growing environments.
Scope exclusions: We exclude household hobby bulbs and general-purpose architectural lighting that is not sold for crop production use.
Segmentation Overview
- By Offering
- Hardware
- Software
- Services
- By Light Source Technology
- High-Intensity Discharge (HID) Lights
- Light Emitting Diodes (LED)
- Fluorescent Lights
- Induction and Plasma Lights
- By Spectrum
- Full / Broad Spectrum
- Partial / Narrow Spectrum (Blue, Red, Far-Red, UV)
- By Power Rating
- Below 300 W
- 300 – 1000 W
- Above 1000 W
- By Installation Type
- New Installations
- Retrofit Installations
- By Application
- Indoor Farming
- Vertical Farming
- Commercial Greenhouse
- Livestock Farming
- Research and Educational Institutes
- By Geography
- North America
- United States
- Canada
- Mexico
- South America
- Brazil
- Argentina
- Rest of South America
- Europe
- Germany
- United Kingdom
- France
- Italy
- Spain
- Rest of Europe
- Asia Pacific
- China
- Japan
- South Korea
- India
- Australia
- New Zealand
- Rest of Asia-Pacific
- Middle East and Africa
- Middle East
- United Arab Emirates
- Saudi Arabia
- Turkey
- Rest of Middle East
- Africa
- South Africa
- Nigeria
- Kenya
- Rest of Africa
- Middle East
- North America
Data Sources, Market Sizing, and Validation
Desk Research
Desk research starts by building a fact base around controlled environment agriculture and lighting demand, then narrowing it to crop-focused lighting revenues. We leaned on public sources such as USDA and National Agricultural Statistics Service releases, the UN Comtrade database for trade signals, International Energy Agency publications for power and efficiency context, and UL and IEC standard references that help interpret product categories.
We also reviewed company annual reports, investor presentations, import-export summaries, and association websites tied to horticulture and greenhouse production, plus trusted business press to map product mixes and pricing direction. Where useful, we checked paid subscriptions for company financials and intelligence, news and financials, patent databases, and shipment-level import-export views so assumptions could be cross-checked against observable signals. The sources listed here are illustrative only, and many other references were used to collect data, validate inputs, and clarify gaps.
Primary Interviews and Surveys
Primary work was used to confirm what portion of lighting shipments truly lands in commercial greenhouses, vertical farms, and indoor plant factories, and to sense-check pricing and replacement timing. We spoke with a mix of manufacturers, distributors, installers, and cultivation operators across major regions, so secondary indicators could be translated into real purchasing behavior and practical adoption limits.
Distribution of primary research fieldwork respondents
| Company type | Respondent position | Region |
|---|---|---|
| Top tier: 28% | CXOs: 13% | APAC: 45% |
| Mid tier: 55% | Functional/Unit leaders: 43% | EMEA: 29% |
| Smaller Players: 17% | Managers: 44% | Americas: 26% |
Market-Sizing & Forecasting
Sizing uses a top-down and bottom-up blend, where controlled environment agriculture build-outs and lighting intensity needs are reconstructed first, then checked against supplier-side sales patterns. The top-down side starts from greenhouse and indoor farming area additions, typical lighting density (watts per square meter), and the share of facilities using supplemental or fully artificial lighting, then converts those into unit demand and value using average selling prices by technology.
To keep the totals realistic, we corroborate with selective bottom-up approximations, such as sampled channel checks on fixture volumes, distributor throughput, and typical project bill-of-material splits (fixtures, drivers, optics, and controls). Inputs that commonly matter include LED penetration versus HID and fluorescent, retrofit versus new installation mix, replacement cycles, electricity price sensitivity, and spectrum preferences that change ASPs for commercial buyers. Forecasts are built with scenario analysis, where macro indicators (protected cultivation additions and crop price signals) are combined with adoption drivers like efficiency regulations and payback expectations shared by interviewees. When bottom-up signals are thin in a country, we fill the gap using proxy ratios from comparable markets, then re-check the outcome with expert feedback before locking the number.
Data Validation & Update Cycle
Outputs are validated through triangulation across demand signals (facility build-outs and retrofit activity), supply signals (production and trade cues), and pricing checks from the channel. Large variances trigger deeper review, such as reconciling sudden share shifts between LED and legacy technologies or investigating one-off project spikes that should not be annualized.
Before sign-off, the model goes through multi-step analyst reviews that include logic checks, unit-to-value consistency, and region totals matching the sum of key country markets. Reports are refreshed annually, and interim updates are made when material events occur, such as regulation changes, major capacity additions, or sharp pricing moves. Right before delivery, we run a fresh pass on key inputs so clients receive the latest updated view.
Mordor Intelligence's Grow Lights Market Size Versus Other Published Estimates
Published market sizes for grow lights often differ because each publisher draws the line differently on what counts as a grow light sale, and because timing and price assumptions are not always aligned. Differences also come from how retrofit demand is treated, what technology mix is assumed, and whether numbers are built from demand indicators or from broader equipment spending.
The main gap comes from whether hobby and general-purpose lighting is blended into the total, where Mordor Intelligence counts only factory-built systems sold for crop production in commercial greenhouses, vertical farms, indoor plant factories, and research sites, and it leaves out household hobby bulbs and architectural fixtures. Another driver is the way ASPs move over time, since some estimates assume a faster premium shift to LED and controls, while others keep price curves flatter or use different currency timing for conversions.
Benchmark comparison
| Source | Market Size | Gaps in Research Methodology |
|---|---|---|
| Mordor Intelligence | USD 6.38 B (2026) | |
| Global Consultancy A | USD 6.11 B (2024) | Uses an earlier base year and may include a wider set of indoor cultivation lighting channels, which can understate later-year value uplift from retrofits and control-ready LED systems. |
| Industry Publisher B | USD 7.16 B (2025) | Reports a higher mid-decade value that likely reflects broader inclusion across sales channels and a more aggressive LED-led ASP progression, which can lift the total even if installed area grows more slowly. |
The spread in the table is largely explained by scope choices, base year alignment, and how price and technology mix are carried forward. By tying the value build-up to observable demand drivers like controlled cultivation additions, retrofit cycles, and realistic price bands by technology, the estimate stays traceable to repeatable steps that are easy to audit.


Key Questions Answered in the Report
How large is the grow lights market in 2026?
The grow lights market size is valued at USD 6.38 billion in 2026.
What is the expected CAGR for grow-lights sales between 2026 and 2031?
Revenue is projected to expand at a 20.16% CAGR over 2026-2031.
Which segment is growing fastest within lighting offerings?
Services are rising the quickest, forecast at 22.40% CAGR as light-as-a-service contracts gain traction.
Why are LEDs overtaking legacy HID lamps?
LEDs deliver up to 4.0 µmol J-¹ efficacy, twice that of HID, and support spectrum tunability for energy savings and crop-specific quality gains.
Page last updated on:


