Physical Vapor Deposition Coatings Market Size and Share
Market Overview
| Study Period | 2021 - 2031 |
|---|---|
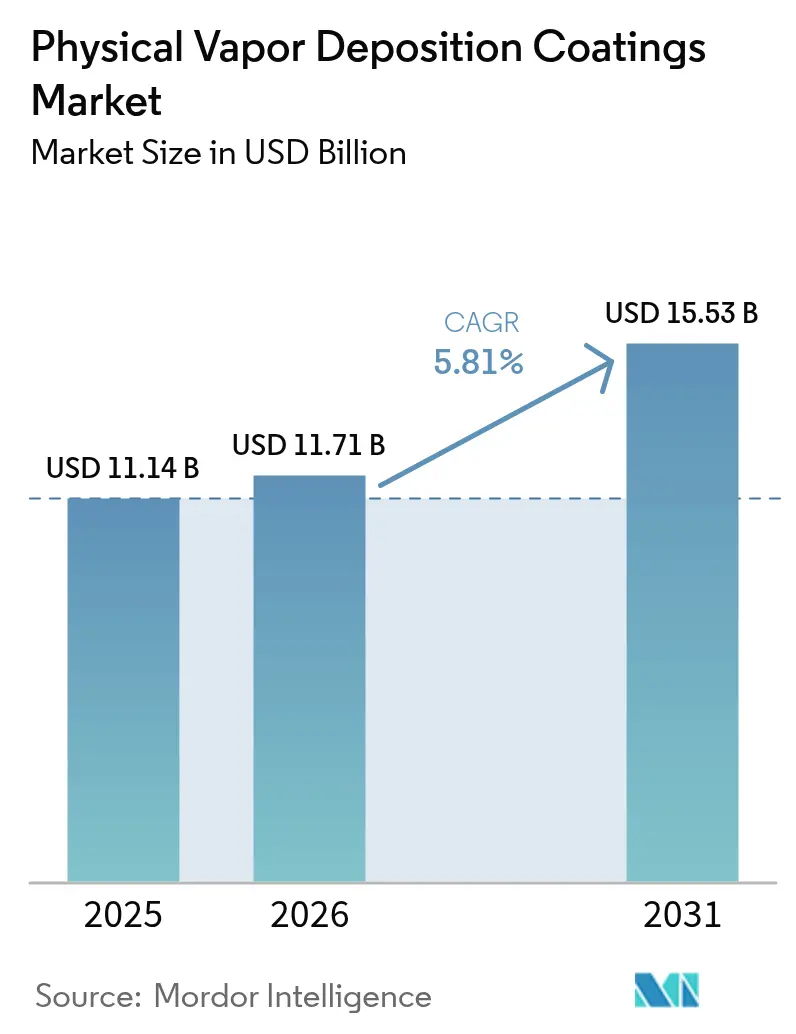
| Market Size (2026) | USD 11.71 Billion |
| Market Size (2031) | USD 15.53 Billion |
| Growth Rate (2026 - 2031) | 5.81% CAGR |
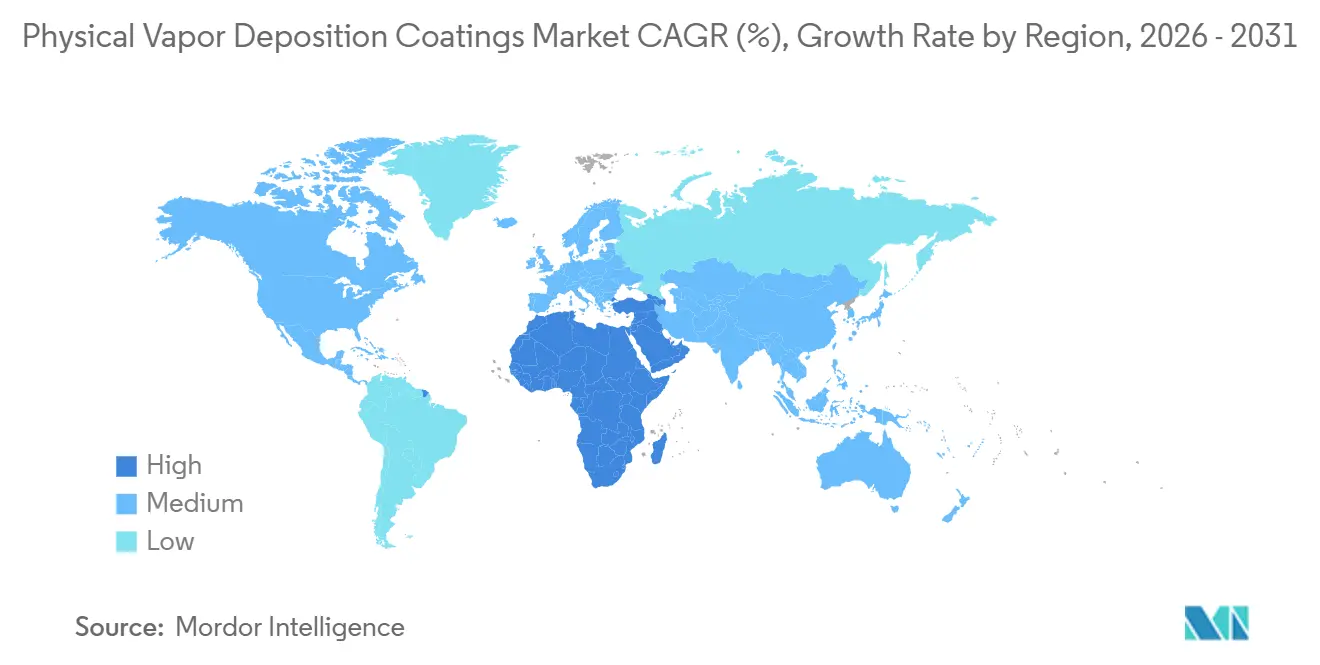
| Fastest Growing Market | Middle East and Africa |
| Largest Market | Asia-Pacific |
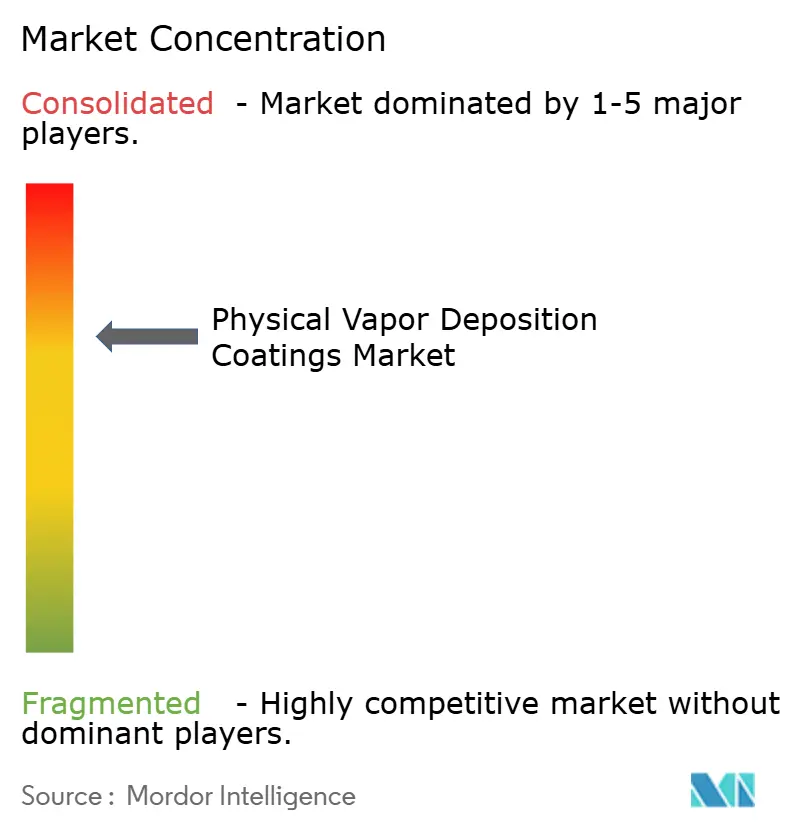
| Market Concentration | Medium |
Major Players *Disclaimer: Major Players sorted in no particular order Image © Mordor Intelligence. Reuse requires attribution under CC BY 4.0. | |
Physical Vapor Deposition Coatings Market Analysis by Mordor Intelligence
The Physical Vapor Deposition Coatings Market size is expected to grow from USD 11.14 billion in 2025 to USD 11.71 billion in 2026 and is forecast to reach USD 15.53 billion by 2031 at a 5.81% CAGR over 2026-2031. Rising demand for vacuum-based thin films that outperform wet-chemistry alternatives on hardness, biocompatibility, and environmental safety is accelerating tool upgrades in semiconductor, medical, and automotive production lines. Foundries shifting to sub-3-nanometer nodes now specify cobalt and ruthenium PVD liners, while orthopedic-implant makers adopt titanium-nitride and DLC finishes to meet FDA biocompatibility rules. Parallel regulatory phase-outs of hexavalent chromium under U.S. EPA NESHAP and the European Union’s REACH regime remove electroplating capacity and redirect capital toward zero-effluent PVD systems. Capital spending on additive-manufactured turbine blades, lightweight vehicle interiors, and flexible displays adds new deposition use-cases, giving the Physical Vapor Deposition Coatings market a durable mid-single-digit growth runway through the decade.
Key Report Takeaways
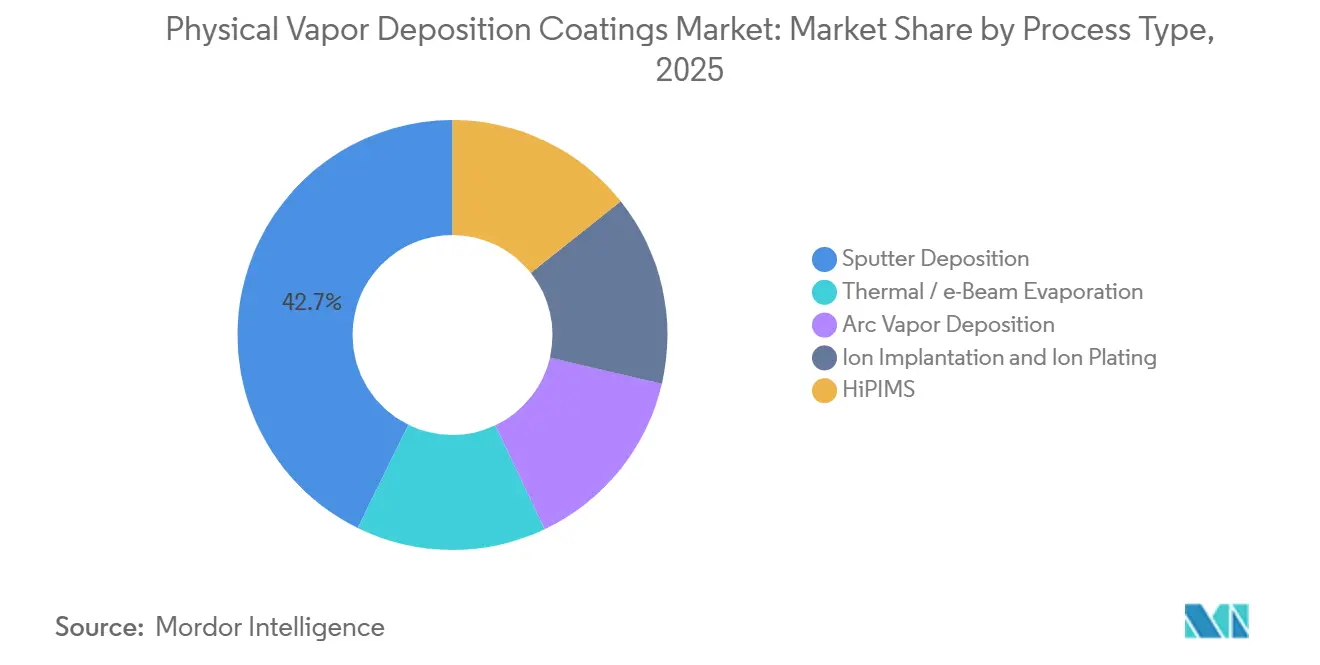
- By process type, sputter deposition led with 42.74% of 2025 revenue, while HiPIMS is projected to deliver the fastest 7.25% CAGR through 2031.
- By substrate, metals accounted for 61.28% of 2025 sales; plastics substrates are set to expand at a 6.38% CAGR as automakers replace chrome-plated trim with low-temperature PVD aluminum.
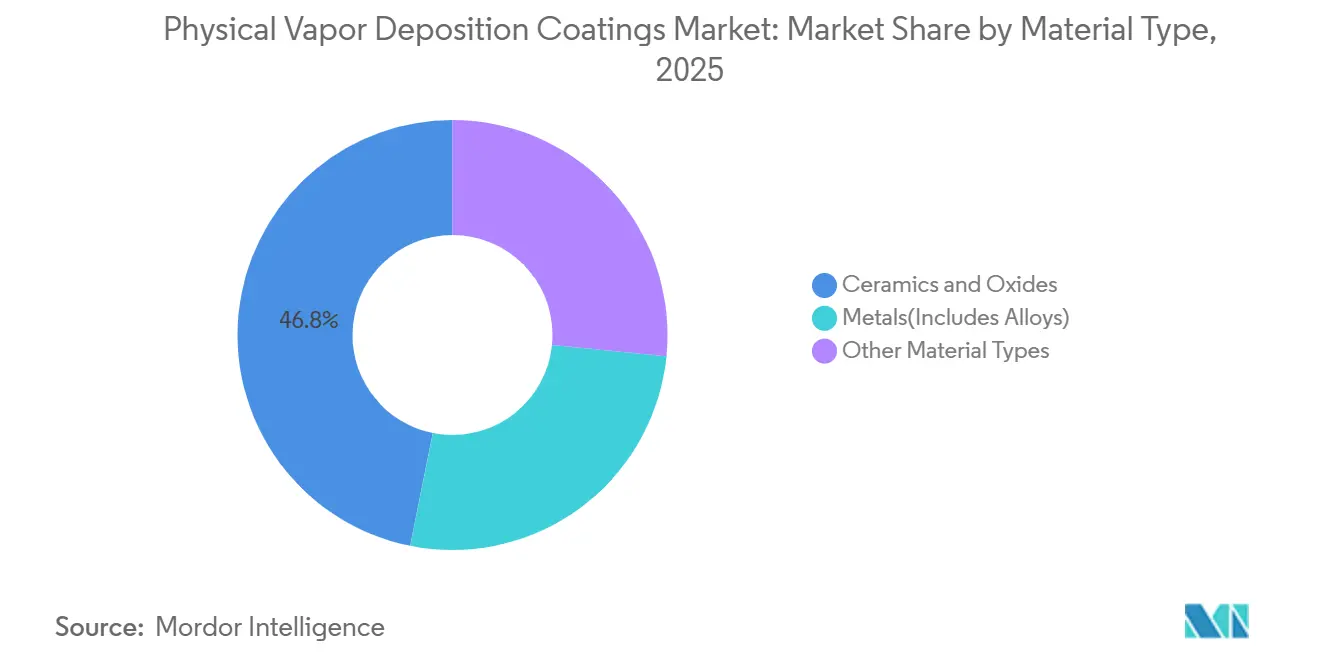
- By material, ceramics and oxides captured 46.85% of revenue in 2025, whereas the ‘other material types’ segment, led by DLC and nitride super-lattices, is poised for a 6.20% CAGR.
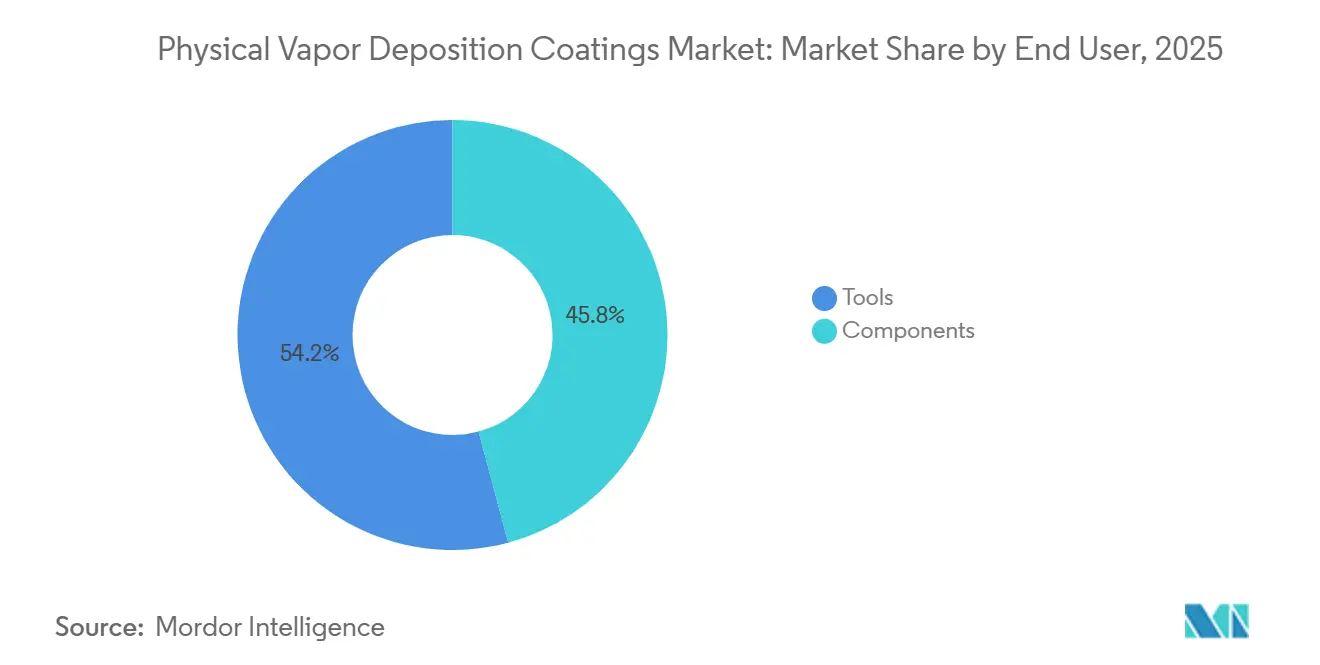
- By end user, tools commanded 54.17% of the 2025 market; the components segment will grow at 6.44% through 2031 as aerospace primes coat 3D-printed turbine parts with PVD yttria-stabilized zirconia.
- By geography, Asia-Pacific dominated with 47.96% of 2025 revenue; the Middle East and Africa will post the quickest 6.09% CAGR owing to Saudi Vision 2030 downstream manufacturing investment.
Note: Market size and forecast figures in this report are generated using Mordor Intelligence’s proprietary estimation framework, updated with the latest available data and insights as of 2026.
Global Physical Vapor Deposition Coatings Market Trends and Insights
Driver Impact Analysis*
| Driver | (~) % Impact on CAGR Forecast | Geographic Relevance | Impact Timeline |
|---|---|---|---|
| Rising semiconductor node transition below 7 nm | +1.4 | APAC core, spill-over to North America | Medium term (2-4 years) |
| Booming minimally-invasive medical device production | +0.9 | North America and EU, emerging APAC | Long term (≥ 4 years) |
| Regulatory shift away from hex-chrome electroplating | +1.2 | Global, led by North America and EU | Short term (≤ 2 years) |
| 3D-printing parts requiring conformal PVD finishes | +0.7 | North America and EU aerospace clusters | Medium term (2-4 years) |
| Low-temperature decorative PVD on plastics and composites | +0.8 | Global, strongest in automotive regions | Short term (≤ 2 years) |
| Source: Mordor Intelligence | |||
Rising Semiconductor Node Transition Below 7 nm
Foundries ramping 3- and 2-nanometer logic nodes rely on PVD cobalt and ruthenium liners that lower resistivity and cut RC delay, adding three to four extra deposition steps per wafer. Samsung’s gate-all-around architecture adopts PVD tungsten wordlines, lifting equipment intensity by nearly USD 1.2 billion per 100,000-WPM fab. Intel’s backside-power-delivery roadmap uses through-silicon-via PVD barriers to block copper diffusion. As a result, Applied Materials shipped 22% more PVD systems in 2025 than in the prior year. Industry roadmaps indicate PVD will remain the dominant bulk-metal solution through the 1-nanometer node because ALD’s cycle time is tenfold slower at comparable thicknesses[1]International Roadmap for Devices and Systems, “2024 Edition,” irds.ieee.org.
Booming Minimally-Invasive Medical Device Production
Orthopedic and cardiovascular manufacturers coat implants with TiN and DLC to cut wear debris and thrombogenicity, aligning with ISO 10993 biocompatibility guidance. Stryker’s 2025 hip and knee lines showed 40% lower particulate generation versus uncoated cobalt-chrome. Boston Scientific’s drug-eluting stents added PVD platinum-iridium markers for fluoroscopic visibility and secured 510(k) clearance in 2025. Outpatient centers now perform 68% of U.S. orthopedic procedures, favoring implants with PVD’s dense, pinhole-free surfaces that help curb infection risk. Europe’s MDR regime, fully enforced since 2024, strengthens traceability obligations that reward established PVD approaches[2]European Commission, “MDR 2017/745,” ec.europa.eu. Medtronic spinal-fusion cages with hydroxyapatite PVD coatings achieved 92% 12-month fusion rates, eight points above plasma-sprayed alternatives.
Regulatory Shift Away From Hex-Chrome Electroplating
EPA’s 2024 NESHAP final rule mandates a 90% cut in hex-chrome emissions by 2027, pushing aerospace and automotive suppliers toward PVD or thermal-spray alternatives . The EU added chromium trioxide to REACH Annex XIV, and fewer than 30% of applicants received sunset-date authorization. California enforced a statewide ban in 2025, leading Boeing and Lockheed Martin to requalify landing-gear parts with CrN PVD finishes that meet NADCAP AC7108 specifications. Oerlikon Balzers logged a 45% jump in decorative PVD requests from automotive Tier-1s in 2025. The U.S. DoD allocated USD 180 million in 2025 to requalify depot-level PVD procedures for turbine components.
3D-Printing Parts Requiring Conformal PVD Finishes
Additively manufactured parts feature complex channels and surface roughness that PVD can uniformly coat when combined with multi-axis rotation, improving fatigue life by up to 35%. GE Aerospace’s LEAP blades receive yttria-stabilized zirconia via electron-beam PVD to handle gas-path temperatures of 1,650 °C. Pratt & Whitney uses arc-vapor TiAlN on TiAl components to curb oxidation at 900 °C. ASTM F3413, issued in 2024, accelerated FDA submissions for PVD-coated implants by 40% in 2025. Siemens Energy coats 3D-printed vanes with aluminide diffusion barriers, cutting hot corrosion by half.
Restraint Impact Analysis*
| Restraints | (~) % Impact on CAGR Forecast | Geographic Relevance | Impact Timeline |
|---|---|---|---|
| High cap-ex of ultra-high-vacuum systems | -0.6 | Global, acute in emerging markets | Short term (≤ 2 years) |
| Competition from CVD / ALD for high-aspect features | -0.4 | APAC semiconductor hubs, North America | Medium term (2-4 years) |
| Shortage of skilled vacuum-process engineers | -0.3 | Global, most severe in North America and EU | Long term (≥ 4 years) |
| Source: Mordor Intelligence | |||
High Cap-Ex of Ultra-High-Vacuum Systems
A single-wafer cluster tool costs USD 8 million-12 million, locking out smaller manufacturers. Batch coaters for cutting tools still demand USD 0.5 million-1.5 million, and depreciation consumes 12-15% of coating-service revenue. Ten-year total ownership tops USD 20 million for semiconductor PVD equipment, while vacuum-pump rebuilds run USD 150,000-300,000 every three to five years. Emerging-market die shops often lack financing, forcing them to outsource coating and slowing penetration of the Physical Vapor Deposition Coatings market.
Competition From CVD / ALD for High-Aspect Features
ALD provides 98% step coverage in 80:1 contact holes, outperforming PVD’s 60% but at 100-times slower deposition rates. Lam Research shipped 19% more ALD tools in 2025 for high-bandwidth-memory capacitor trenches. However, bulk metallization still favors PVD because ALD’s throughput cannot satisfy wafer volumes, sustaining a hybrid deposition strategy through the decade.
*Our forecasts treat driver/restraint impacts as directional, not additive. The impact forecasts reflect baseline growth, mix effects, and variable interactions.
Segment Analysis
By Process Type: HiPIMS Adoption Narrows Defect Density
Sputter deposition generated 42.74% of 2025 revenue, while HiPIMS is expected to outpace the overall Physical Vapor Deposition Coatings market with a 7.25% CAGR through 2031. The HiPIMS’s 70% metal-ionization rate delivers near-void-free copper seed layers that enhance sub-5 nm via fill and slash electromigration failures.
HiPIMS rollouts in cutting-tool plants cut macroparticle-linked chipping by 60%, doubling carbide end-mill life and improving throughput. Conventional DC magnetron sputtering remains cost-effective for blanket films and optical stacks, whereas arc-vapor deposition retains its stronghold in TiAlN coatings despite macroparticle limits that preclude semiconductor use. Thermal and e-beam evaporation address niche mirror and OLED encapsulation jobs, while ion-implantation combined with ion-plating densifies medical-instrument films to 98% of bulk density, boosting sterilization durability.


By Substrate: Plastics Capture Lightweighting Upside
Metals held 61.28% of 2025 substrate revenue, but plastics are forecast to grow 6.38% annually as automakers and electronics OEMs chase weight reduction and eliminate hex-chrome waste streams. The Physical Vapor Deposition Coatings market share for plastics is rising due to low-temperature aluminum deposition that keeps polycarbonate below its glass-transition point.
Volkswagen’s shift to PVD aluminum bezels trims dashboard mass by 40% and achieves Class-A gloss without plating baths. SABIC and BASF polymer grades that accept direct vacuum metalization remove primer steps and compress cycle time by 25%. Glass remains pivotal in architectural and automotive glazing, where triple-silver PVD low-e stacks cut HVAC loads 30%. Flexible electronics promise new polymer substrates as roll-to-roll PVD at <100 °C prevents PET warpage.
By Material Type: Ceramics Remain the Wear-Resistance Workhorse
Ceramics and oxides secured 46.85% of 2025 material revenue on the strength of TiAlN and AlCrN coatings that extend carbide insert life five fold. Kennametal’s multilayer TiAlN/AlCrN grade machines Inconel 718 at 25% higher surface speed, while Sandvik Coromant’s aluminum-titanium-oxide layers double tool life in interrupted cuts. DLC’s <0.10 friction coefficient spurs adoption in valve-train and medical implants, and high-entropy alloy targets in research and development promise over 40 GPa hardness coatings that could stretch replacement cycles in aerospace engines after mid-decade commercialization.
By End User: Components Segment Accelerates on Aerospace Investments
Tools generated 54.17% of 2025 revenue, but components are projected to grow 6.44% per year as PVD thermal-barrier, DLC, and conductive layers penetrate turbine blades, drivetrain parts, and implants. GE’s yttria-stabilized zirconia coatings enable 1,650 °C turbine inlet temperatures, raising engine efficiency two percentage points, while automotive piston rings coated with DLC reduce friction 15% and boost fleet fuel economy by roughly 1.5%. Semiconductor devices add up to 14 PVD metal layers per wafer at the 3 nm node, reinforcing equipment utilization. Renewable-energy installations and minimally invasive procedures will sustain indium-tin-oxide and TiN demand for photovoltaics and surgical tools, respectively.
Geography Analysis
Asia-Pacific supplied 47.96% of global revenue in 2025 on the back of USD 140 billion in advanced-node fab capex by TSMC and Samsung, each facility requiring 50-plus PVD clusters. China’s 14th Five-Year Plan earmarked USD 150 billion for indigenous equipment, lifting SMIC tool orders 28% despite export controls. Japan’s METI subsidy will place 20 PVD tools in Rapidus’s Hokkaido pilot line by 2027. India’s PLI attracted Micron and Tata Electronics, positioning the country as an emerging memory-packaging hub that needs barrier-metal PVD. Southeast Asia added 18 FDA-registered medical-device plants in 2025, each installing batch coaters for orthopedic implants.
North America benefits from the CHIPS Act’s USD 52 billion incentives that underpin Intel Ohio, TSMC Arizona, and Samsung Texas fabs, collectively calling for 180 PVD tools. Canada’s Montreal aerospace cluster expanded Pratt & Whitney coating capacity by USD 1.8 billion, and Mexico’s auto sector lifted decorative-coating revenues 35% to meet California’s hex-chrome ban. Europe sustains PVD demand through lightweighting mandates and Rolls-Royce-equipped Airbus A350 deliveries at 900 units annually. Germany’s Fraunhofer IST invested EUR 50 million into HiPIMS and filtered-arc research and development for hydrogen-economy parts.
The Middle East and Africa will lead growth at 6.09% through 2031. Saudi Arabia’s Public Investment Fund is steering USD 20 billion into downstream auto and building-product clusters that require decorative and functional PVD capacity. The UAE’s Masdar City secured USD 3.2 billion of advanced-manufacturing inflows in 2025, attracting coating-service shops for aerospace and oil-and-gas hardware. South Africa’s 8 GW solar build in 2025 raised demand for transparent conductive oxide PVD on PV modules.

Competitive Landscape
The Physical Vapor Deposition Coatings market is moderately consolidated. Competition is shifting to technology features such as HiPIMS power supplies, in-situ metrology, and multi-chamber integration that lock customers into proprietary ecosystems for a decade of service revenues. Patent applications in filtered-arc and pulsed-laser deposition jumped 34% year on year, signaling a race to cut macroparticle defects. Smaller challengers—Angstrom Engineering and Denton Vacuum—use modular designs priced 40% below incumbents to win 12% of the sub-USD 1 million segment.
Digital twins and machine-learning process control are differentiators: Applied’s SmartFactory software reduced chamber-matching variation by 30% and lifted yield by two points in early deployments. Private-equity backed roll-ups of regional job shops accelerated in 2025, offering a 48-hour turnaround that small independents struggle to match. SEMI’s supplier sustainability initiative now requires Scope 3 disclosure, favoring incumbents with mature ESG reporting. End-market diversification into flexible displays, hydrogen fuel-cell plates, and bioactive implants opens whitespace where nimble entrants can scale ahead of legacy balance sheets.
Physical Vapor Deposition Coatings Industry Leaders
Applied Materials, Inc.
OC Oerlikon Management AG
ULVAC
Veeco Instruments Inc.
LAM RESEARCH CORPORATION
- *Disclaimer: Major Players sorted in no particular order

Recent Industry Developments
- January 2026: Applied Materials committed USD 1.2 billion to expand its Singapore PVD factory, adding 40,000 m² of cleanroom that will raise tool output 25% by Q3 2026.
- November 2025: ULVAC inked a JPY 85 billion (USD 570 million) deal to supply 60 PVD clusters to an Asian foundry through 2028.


Global Physical Vapor Deposition Coatings Market Report Scope
Physical vapor deposition (PVD) coating is a dry coating process. Mostly, the coating is transferred to the substrate with the help of a medium, such as a solvent. In the case of PVD coatings, the vapor is generated, transferred in the gas phase, and then deposited as a coating directly to the substrate without using any medium.
The physical vapor deposition (PVD) coating market is segmented by process type, substrate, material type, end user, and geography. By process type, the market is segmented into sputter deposition, thermal / e-beam evaporation, arc vapor deposition, ion implantation and ion plating, and HiPIMS. By substrate, the market is segmented into metals, plastics, and glass. By material type, the market is segmented into metals (including alloys), ceramics and oxides, and other material types. By end user, the market is segmented into tools and components (aerospace and defense, automotive, electronics and semiconductors (including optics), power generation, and other components. The report also covers the market sizes and forecasts for the PVD coatings market in 21 major countries across various regions. For each segment, the market sizes and forecasts are provided in terms of value (USD).
| Sputter Deposition |
| Thermal / e-Beam Evaporation |
| Arc Vapor Deposition |
| Ion Implantation and Ion Plating |
| HiPIMS |
| Metals |
| Plastics |
| Glass |
| Metals(Includes Alloys) |
| Ceramics and Oxides |
| Other Material Types |
| Tools | |
| Components | Aerospace and Defense |
| Automotive | |
| Electronics and Semiconductors (incl. Optics) | |
| Power Generation | |
| Other Components (Solar Products, Medical Equipment, and Others) |
| Asia-Pacific | China |
| India | |
| Japan | |
| South Korea | |
| ASEAN Countries | |
| Rest of Asia-Pacific | |
| North America | United States |
| Canada | |
| Mexico | |
| Europe | Germany |
| United Kingdom | |
| France | |
| Italy | |
| Spain | |
| Russia | |
| Nordic Countries | |
| Rest of Europe | |
| South America | Brazil |
| Argentina | |
| Colombia | |
| Rest of South America | |
| Middle-East and Africa | Saudi Arabia |
| United Arab Emirates | |
| Qatar | |
| Egypt | |
| South Africa | |
| Rest of Middle-East and Africa |
| By Process Type | Sputter Deposition | |
| Thermal / e-Beam Evaporation | ||
| Arc Vapor Deposition | ||
| Ion Implantation and Ion Plating | ||
| HiPIMS | ||
| By Substrate | Metals | |
| Plastics | ||
| Glass | ||
| By Material Type | Metals(Includes Alloys) | |
| Ceramics and Oxides | ||
| Other Material Types | ||
| By End User | Tools | |
| Components | Aerospace and Defense | |
| Automotive | ||
| Electronics and Semiconductors (incl. Optics) | ||
| Power Generation | ||
| Other Components (Solar Products, Medical Equipment, and Others) | ||
| By Geography | Asia-Pacific | China |
| India | ||
| Japan | ||
| South Korea | ||
| ASEAN Countries | ||
| Rest of Asia-Pacific | ||
| North America | United States | |
| Canada | ||
| Mexico | ||
| Europe | Germany | |
| United Kingdom | ||
| France | ||
| Italy | ||
| Spain | ||
| Russia | ||
| Nordic Countries | ||
| Rest of Europe | ||
| South America | Brazil | |
| Argentina | ||
| Colombia | ||
| Rest of South America | ||
| Middle-East and Africa | Saudi Arabia | |
| United Arab Emirates | ||
| Qatar | ||
| Egypt | ||
| South Africa | ||
| Rest of Middle-East and Africa | ||


Key Questions Answered in the Report
How large will global demand for physical vapor deposition coatings be by 2031?
The Physical Vapor Deposition Coatings market size is forecast to reach USD 15.53 billion by 2031, expanding at a 5.81% CAGR from 2026.
Which process segment is growing the fastest?
High-power impulse magnetron sputtering will post the highest 7.25% CAGR through 2031 as chipmakers adopt its high-ionization flux for sub-5 nm features.
Why are automakers shifting to PVD on interior trim?
PVD aluminum and chromium deposited below 80 °C give plastics a metal look, avert hex-chrome regulations, cut water use by 95%, and reduce part weight by 40%.
What restrains wider adoption of PVD equipment?
Ultra-high-vacuum cluster tools carry capital costs of USD 8 million-12 million and demand specialized engineers, limiting uptake among smaller firms.
Which region will lead growth to 2031?
The Middle East & Africa will record the quickest 6.09% CAGR as Saudi and Emirati manufacturing clusters invest in decorative and functional PVD capacity.
Page last updated on:


