Phosphorus Trichloride Market Size and Share
Market Overview
| Study Period | 2021 - 2031 |
|---|---|
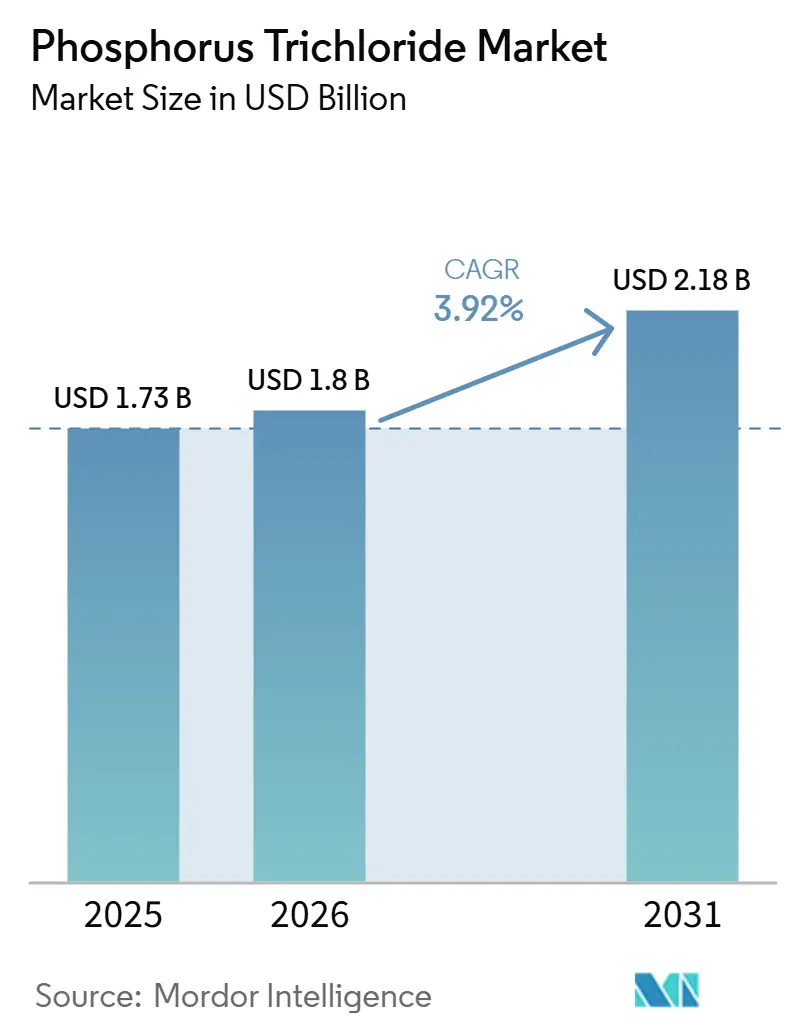
| Market Size (2026) | USD 1.8 Billion |
| Market Size (2031) | USD 2.18 Billion |
| Growth Rate (2026 - 2031) | 3.92% CAGR |
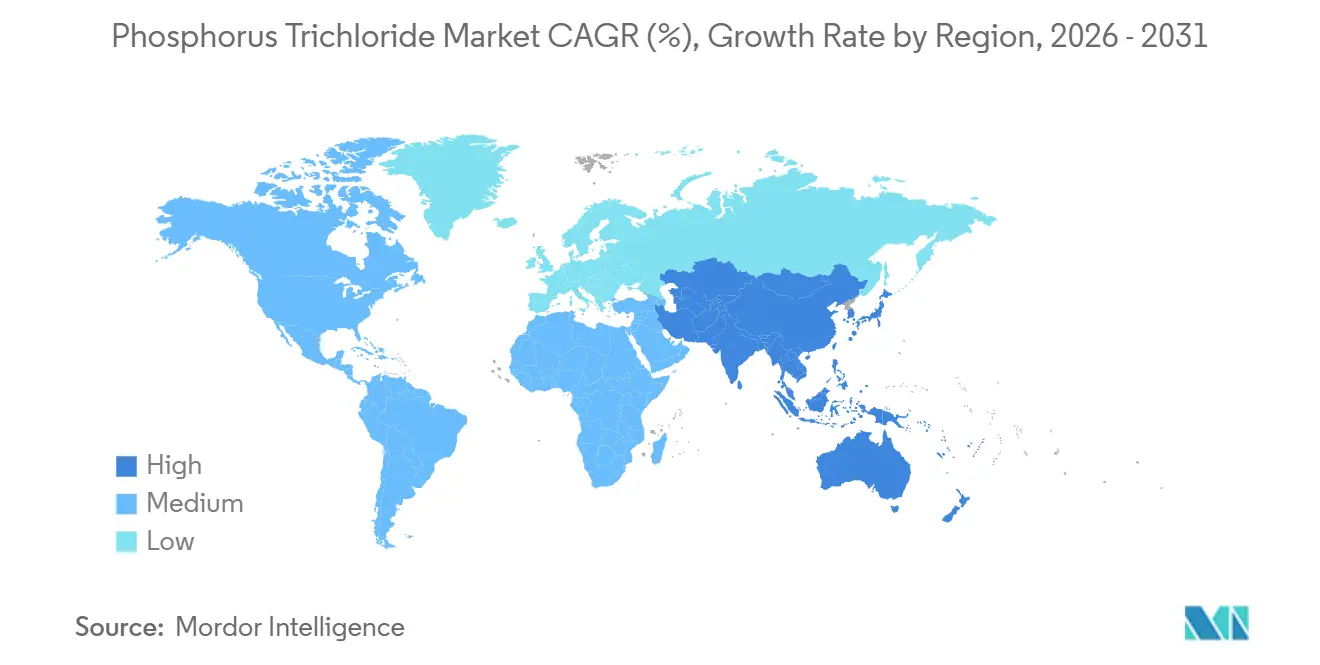
| Fastest Growing Market | Asia Pacific |
| Largest Market | Asia Pacific |
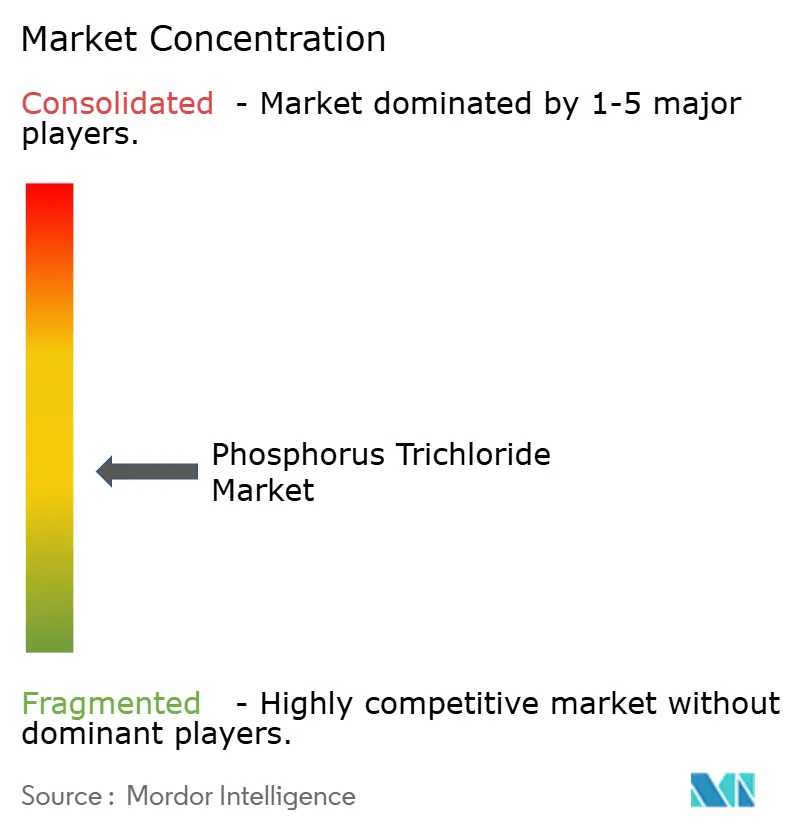
| Market Concentration | Medium |
Major Players *Disclaimer: Major Players sorted in no particular order Image © Mordor Intelligence. Reuse requires attribution under CC BY 4.0. | |
Phosphorus Trichloride Market Analysis by Mordor Intelligence
The Phosphorus Trichloride Market size is projected to expand from USD 1.73 billion in 2025 and USD 1.8 billion in 2026 to USD 2.18 billion by 2031, registering a CAGR of 3.92% between 2026 to 2031. Continuing semiconductor‐fab build-outs in South Korea, Taiwan, and the United States are driving demand for ultra-high purity materials, even as technical-grade volumes face intense price competition from thionyl chloride and increasing feedstock volatility in China. Automotive and electronics manufacturers are accelerating their shift to phosphorus-based flame retardants in response to stricter RoHS and REACH regulations, maintaining steady demand for downstream organophosphate derivatives. Meanwhile, Beijing’s planned removal of export VAT refunds on phosphorus pesticide intermediates, effective April 1, 2026, is creating pressure on Chinese exporters, a move that could tighten offshore supply by late 2027. The February 2026 U.S. executive order listing phosphorus as a strategic element highlights the growing focus on critical-mineral security, indicating that non-Chinese buyers will increasingly seek diversified sources despite higher delivered costs.
Key Report Takeaways
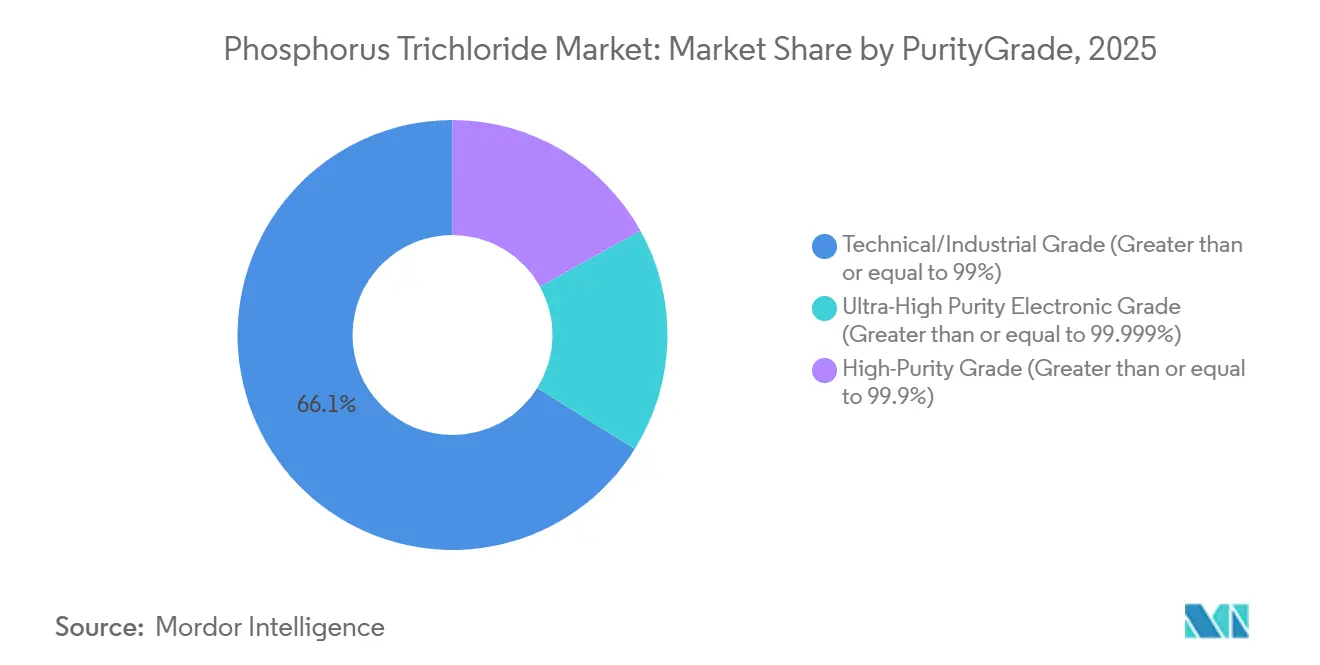
- By purity/grade, technical/industrial grade captured 66.11% of phosphorus trichloride market share in 2025, whereas the ultra-high purity electronic grade is forecast to advance at a 4.33% CAGR through 2031.
- By application, agrochemicals led with 41.35% of phosphorus trichloride market share in 2025, while flame retardants are projected to grow at a 4.67% CAGR through 2031.
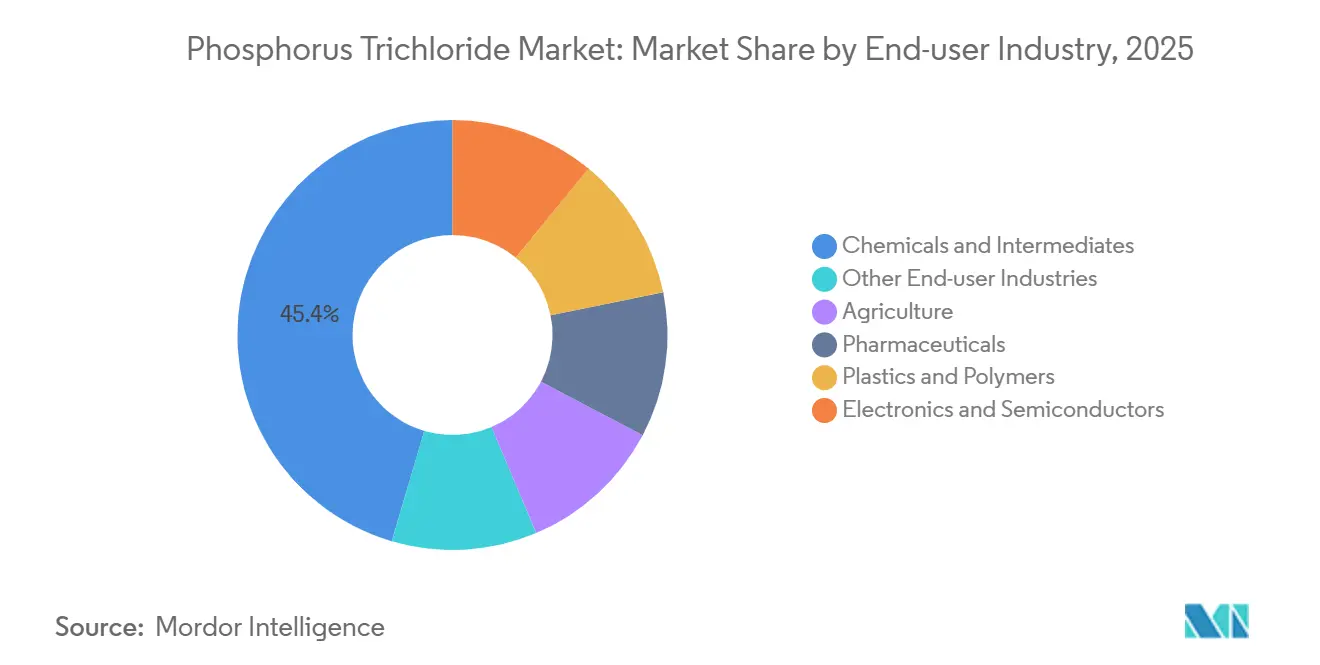
- By end-user industry, chemicals and intermediates held 45.44% of the phosphorus trichloride market share in 2025, yet electronics and semiconductors are expanding at a 4.92% CAGR through 2031.
- By geography, Asia-Pacific accounted for 56.12% of the phosphorus trichloride market share in 2025 and is on track for a 5.11% CAGR through 2031.
Note: Market size and forecast figures in this report are generated using Mordor Intelligence’s proprietary estimation framework, updated with the latest available data and insights as of January 2026.
Global Phosphorus Trichloride Market Trends and Insights
Drivers Impact Analysis*
| Driver | (~) % Impact on CAGR Forecast | Geographic Relevance | Impact Timeline |
|---|---|---|---|
| Expanding pharmaceutical-intermediate synthesis | +0.6% | Global, with concentration in India, China, and select EU contract manufacturing hubs | Medium term (2-4 years) |
| Growth in phosphorus-based flame-retardant adoption | +0.9% | APAC core (China, South Korea, Japan), spill-over to North America and EU automotive/electronics clusters | Medium term (2-4 years) |
| High-purity need for semiconductor wet-etch chemistries | +1.2% | South Korea, Taiwan, Japan; emerging in US (Arizona, Texas) and EU (Germany, Netherlands) | Long term (≥4 years) |
| Emerging Li-ion battery electrolyte precursor demand (LiPF₆ route) | +0.7% | China (dominant), with nascent capacity in South Korea and pilot projects in North America | Long term (≥4 years) |
| On-site chlorination and circular-chemistry plants reducing logistics cost | +0.4% | EU (Germany, Netherlands, Belgium), pilot projects in North America | Long term (≥4 years) |
| Source: Mordor Intelligence | |||
Expanding Pharmaceutical-Intermediate Synthesis
India’s contract manufacturing leaders, such as Excel Industries, are addressing the growing demand for phosphorus trichloride as Western pharmaceutical companies outsource late-stage API synthesis to cost-effective, audited facilities. Environmental regulations in China have reduced the number of marginal producers, redirecting orders to Indian plants that comply with Good Manufacturing Practices. Phosphorus trichloride remains a preferred reagent for producing acyl chlorides and alkyl chlorides in mild chlorination processes. Excel’s new capacity at its Lote complex positions the company to support multistep syntheses through 2028, ensuring supply chain stability for Western markets amid potential Chinese supply disruptions. A robust pipeline of small-molecule drugs requiring phosphorus chlorination further supports medium-term growth.
Growth in Phosphorus-Based Flame-Retardant Adoption
Regulators are phasing out halogenated additives in electronics, vehicles, and construction materials, prompting OEMs to adopt phosphorus-based flame retardants that char instead of emitting corrosive fumes. Clariant’s joint-venture plant in Leshan, scheduled to open in 2025, utilizes second-generation Exolit lines that meet UL94 V-0 standards for thin-wall battery modules. Microencapsulated red phosphorus now enables pale-colored engineering polymers, expanding design options for consumer goods manufacturers in Japan and Germany. The combination of safer chemistry and broader color compatibility is increasing average selling prices, with annual substitution growth nearing 5%. The strongest momentum is observed in Asia’s e-mobility and home-appliance sectors.
High-Purity Need for Semiconductor Wet-Etch Chemistries
Advanced semiconductor nodes, such as 3 nm logic, require electronic-grade phosphorus trichloride as a precursor for producing ultra-pure phosphoric acid with less than 1 ppb metal content, essential for silicon-nitride etching. Qualification cycles for these materials span 18-24 months, and fabs rarely switch suppliers once established, ensuring long-term revenue streams. Prayon’s plan to double its capacity in Switzerland by 2028 aligns with European Commission incentives for regional chip-chemical autonomy. Similarly, OCI is expanding in South Korea to support Samsung and SK Hynix. Each new giga-fab requires up to 3,000 tons of ultra-clean phosphoric acid annually, contributing over one percentage point to the global CAGR despite the relatively small tonnage.
On-Site Chlorination and Circular-Chemistry Plants Reducing Logistics Cost
European initiatives, such as the SPODOFOS project in Germany’s Schkopau park, are exploring white-phosphorus recovery from sewage-sludge ash, supported by EUR 27.1 million in EU funding[1]European Commission, “SPODOFOS Project Grant Award,” ec.europa.eu. Co-locating recovered phosphorus with chlorination loops reduces hydrolysis losses and minimizes transportation risks for corrosive intermediates. The Netherlands is planning a 10,000-ton plant by 2029, while U.S. chemical clusters in Texas are studying similar circular processes. These configurations can lower delivered phosphorus trichloride costs by up to 25%, offering significant cost advantages to flame-retardant formulators and API manufacturers.
Restraints Impact Analysis*
| Restraint | (~) % Impact on CAGR Forecast | Geographic Relevance | Impact Timeline |
|---|---|---|---|
| Volatile yellow-phosphorus feedstock supply in China | -0.8% | Global, with acute impact on Asia-Pacific and buyers dependent on Chinese exports | Short term (≤2 years) |
| Rising adoption of alternative chlorinating agents (SOCl₂, POCl₃) | -0.5% | North America, EU, and India (pharmaceutical and specialty chemical sectors) | Medium term (2-4 years) |
| Carbon-intensity scrutiny of chlor-phosphorus route | -0.5% | EU and North America (driven by CBAM and corporate ESG commitments); emerging pressure in APAC | Medium term (2-4 years) |
| Source: Mordor Intelligence | |||
Volatile Yellow-Phosphorus Feedstock Supply in China
Yellow phosphorus production requires 14,000 kWh per ton, making smelters in Yunnan and Sichuan vulnerable to hydropower shortages and environmental restrictions. Spot prices fluctuated by 38% in 2025, compressing downstream margins. Although 2026 began with a 45,500-ton surplus, analysts predict temporary closures could reverse the surplus by 2027. Western buyers face risks of sudden export restrictions as Beijing prioritizes domestic formulators. The February 2026 U.S. critical-mineral designation aims to mitigate this risk by encouraging local feedstock projects.
Rising Adoption of Alternative Chlorinating Agents (SOCl₂, POCl₃)
Innovations in continuous-flow processes now enable thionyl chloride (SOCl₂) and phosphorus oxychloride (POCl₃) production with conversion rates exceeding 95%, allowing pharmaceutical plants to switch when phosphorus trichloride prices rise. Indian drug-intermediate manufacturers report 8-12% cost savings from SOCl₂ routes, which produce saleable SO₂ instead of phosphorous-acid waste. As regulatory scrutiny over waste treatment increases, the simpler effluent profiles are accelerating the adoption of alternatives.
*Our forecasts treat driver/restraint impacts as directional, not additive. The impact forecasts reflect baseline growth, mix effects, and variable interactions.
Segment Analysis
By Purity/Grade: Ultra-High Purity Drives Margin Expansion
Technical/industrial grade accounted for the majority of tonnage in 2025, capturing 66.11% of the phosphorus trichloride market share. However, margin pressures were evident as oversupply from China intensified price competition, leading to a 6% year-on-year decline in average selling prices due to changes in VAT policies. In contrast, the high-purity segment, catering to niche organophosphorus syntheses, maintained stable pricing as buyers accepted modest premiums for cleaner product profiles.
Ultra-high purity electronic grade commanded price multiples of 300-500% over commodity products. Stringent qualification requirements, such as sub-ppb metal and particle count verification for each batch, create significant entry barriers, discouraging new competitors. This segment is expected to gain further traction as logic nodes advance from 3 nm to 2 nm.


By Application: Flame Retardants Outpace Agrochemicals
Agrochemicals led the market in 2025 with a 41.35% revenue share. However, margins have been narrowing following the removal of VAT rebates in China. The mature growth of glyphosate and the emergence of bio-based alternatives have constrained demand for new chlorination units.
Flame retardants are projected to grow at a 4.67% CAGR through 2031, outpacing other applications. This growth is driven by the shift to halogen-free formulations in EV battery casings, smart devices, and building panels. Innovations such as microencapsulated red phosphorus expand design possibilities, while new automotive safety regulations further boost demand. Consequently, the market share of phosphorus trichloride dedicated to flame-retardant intermediates is expected to grow faster than any other downstream application.
By End-user Industry: Electronics Gains Share
The chemicals and intermediates segment accounted for 45.44% of demand in 2025, reflecting mature derivative chains in key markets like China and India. Growth in this segment aligns with general industrial output, with limited potential for significant expansion in the absence of new value-added product launches.
In contrast, the electronics and semiconductor industry is projected to grow at a 4.92% CAGR through 2031. Advanced node fabs, each processing 30,000 wafers per month, require 1,500-3,000 tons of ultra-pure phosphoric acid annually, driving incremental demand for upstream phosphorus trichloride. The sector's stringent audit requirements increase switching costs, fostering long-term offtake agreements that support capacity investments in regions such as South Korea, Taiwan, Arizona, and Dresden.
Geography Analysis
Asia-Pacific dominated the market in 2025 with a 56.12% share, driven by China's feedstock production, India's expanding pharmaceutical sector, and South Korea's semiconductor advancements. The region is expected to grow at a 5.11% CAGR through 2031, supported by multi-billion-dollar incentives for chip-chemical production and sustained fertilizer demand. Indian companies like Rashtriya Chemicals and Coromandel are expanding phosphoric acid capacity to enhance backward integration and reduce reliance on imported raw materials.
North America is experiencing moderate growth, supported by policies promoting battery materials and domestic chip fabrication. Projects like Mosaic's Louisiana initiative highlight a trend toward sourcing from allied nations, although large-scale yellow-phosphorus smelting remains absent in the region.
Europe is focusing on circular chemistry initiatives, which could supply 10,000 tons of recovered white phosphorus by 2029. These efforts aim to enhance supply resilience while adhering to stringent carbon disclosure requirements.
South America and the Middle-East and Africa remain smaller markets in terms of volume and application diversity. Mega-projects in Egypt and Jordan are targeting fertilizer value chains, but connections to higher-value chlorination platforms are still in early stages. Brazil continues to import phosphorus trichloride for herbicide production, highlighting its dependence on Asian feedstock cycles.

Competitive Landscape
The phosphorus trichloride market is moderately fragmented, with numerous Asian producers competing primarily on price. Overcapacity and the increasing adoption of thionyl chloride are eroding profit margins, prompting smaller Chinese players to consider consolidation or market exit. Indian companies like Excel Industries are leveraging new capacity and stricter Chinese compliance costs to secure export opportunities.
Electronic-grade production is concentrated among key players such as OCI, Prayon, ICL, and LANXESS, who possess the necessary purification expertise and qualification records required by semiconductor fabs. These companies maintain premium pricing, up to five times higher than bulk products, ensuring stable margins even during market downturns[2]LANXESS, “Acquisition of Solvay’s Phosphorus Business,” lanxess.com. Strategic opportunities exist in on-site chlorination loops colocated with flame-retardant or phosphite units, reducing freight costs and minimizing hydrolysis waste.
Technological divergence is evident in the market. Commodity plants are adopting digital reactors for safer and more efficient continuous operations, while LiPF₆ specialists are utilizing microchannel reactors to achieve near-perfect stoichiometry and contain corrosive by-products. European circular chemistry initiatives pose a potential long-term disruption to feedstock supply but are unlikely to scale beyond pilot projects before 2028.
Phosphorus Trichloride Industry Leaders
ICL
BASF
LANXESS
SANDHYA GROUP
Wynca Group
- *Disclaimer: Major Players sorted in no particular order

Recent Industry Developments
- September 2024: ICL and Orbia partnered to supply potassium trichloride specifically for lithium battery materials, highlighting a focus on energy storage applications. This collaboration enabled ICL and Orbia to advance electrification in both transportation and stationary applications while establishing the production of this essential component in North America.
- October 2023: Wynca Group established a partnership with a European agrochemical company for the supply of high-purity phosphorus trichloride (PCl₃). The agreement aligns with Wynca's global market expansion strategy, focusing on intermediate production for crop protection products.


Global Phosphorus Trichloride Market Report Scope
Phosphorus trichloride is an essential industrial chemical intermediate primarily utilized in the production of herbicides such as glyphosate, as well as in agrochemicals, pharmaceuticals, and flame retardants. It is a toxic, corrosive, and water-reactive liquid, typically manufactured through direct chlorination.
The Phosphorus Trichloride Market is segmented into purity/grade, application, end-user industry, and geography. By purity/grade, the market is segmented into technical/industrial grade (≥ 99%), high-purity grade (≥ 99.9%), and ultra-high purity electronic grade (≥ 99.999%). By application, the market is segmented into agrochemicals (herbicides, insecticides, etc.), pharmaceuticals, plastic additives and stabilizers, flame retardants, surfactants and detergents, metal and water treatment chemicals, and other applications. By end-user industry, the market is segmented into chemicals and intermediates, agriculture, pharmaceuticals, plastics and polymers, electronics and semiconductors, and other end-user industries. The report also covers the market size and forecasts for phosphorus trichloride in 17 countries across major regions. For each segment, the market sizing and forecasts have been done on the basis of value (USD).
| Technical/Industrial Grade (Greater than or equal to 99%) |
| High-Purity Grade (Greater than or equal to 99.9%) |
| Ultra-High Purity Electronic Grade (Greater than or equal to 99.999%) |
| Agrochemicals (Herbicides, Insecticides, etc.) |
| Pharmaceuticals |
| Plastic Additives and Stabilizers |
| Flame Retardants |
| Surfactants and Detergents |
| Metal and Water Treatment Chemicals |
| Other Applications |
| Chemicals and Intermediates |
| Agriculture |
| Pharmaceuticals |
| Plastics and Polymers |
| Electronics and Semiconductors |
| Other End-user Industries |
| Asia-Pacific | China |
| India | |
| Japan | |
| South Korea | |
| ASEAN Countries | |
| Rest of Asia-Pacific | |
| North America | United States |
| Canada | |
| Mexico | |
| Europe | Germany |
| United Kingdom | |
| France | |
| Italy | |
| Spain | |
| Russia | |
| Rest of Europe | |
| South America | Brazil |
| Argentina | |
| Rest of South America | |
| Middle-East and Africa | Saudi Arabia |
| South Africa | |
| Rest of Middle-East and Africa |
| By Purity/Grade | Technical/Industrial Grade (Greater than or equal to 99%) | |
| High-Purity Grade (Greater than or equal to 99.9%) | ||
| Ultra-High Purity Electronic Grade (Greater than or equal to 99.999%) | ||
| By Application | Agrochemicals (Herbicides, Insecticides, etc.) | |
| Pharmaceuticals | ||
| Plastic Additives and Stabilizers | ||
| Flame Retardants | ||
| Surfactants and Detergents | ||
| Metal and Water Treatment Chemicals | ||
| Other Applications | ||
| By End-user Industry | Chemicals and Intermediates | |
| Agriculture | ||
| Pharmaceuticals | ||
| Plastics and Polymers | ||
| Electronics and Semiconductors | ||
| Other End-user Industries | ||
| By Geography | Asia-Pacific | China |
| India | ||
| Japan | ||
| South Korea | ||
| ASEAN Countries | ||
| Rest of Asia-Pacific | ||
| North America | United States | |
| Canada | ||
| Mexico | ||
| Europe | Germany | |
| United Kingdom | ||
| France | ||
| Italy | ||
| Spain | ||
| Russia | ||
| Rest of Europe | ||
| South America | Brazil | |
| Argentina | ||
| Rest of South America | ||
| Middle-East and Africa | Saudi Arabia | |
| South Africa | ||
| Rest of Middle-East and Africa | ||


Key Questions Answered in the Report
What is the size of the phosphorus trichloride market?
The phosphorus trichloride market stands at USD 1.80 billion in 2026 and is on course to reach USD 2.18 billion by 2031.
Which purity/grade is growing the fastest through 2031?
Ultra-high purity electronic grade is advancing at a 4.33% CAGR through 2031, fueled by semiconductor demand.
Why is Asia-Pacific the dominant region?
The region controls yellow-phosphorus feedstock, hosts major agrochemical and semiconductor hubs, and is expanding capacity across India, China, and South Korea.
How are regulatory trends affecting demand?
Halogen-free mandates in electronics and vehicles are accelerating substitution toward phosphorus flame retardants, lifting usage rates in premium polymers.
Page last updated on:


