
Market Overview
| Study Period | 2020 - 2031 |
|---|---|
| Forecast Data Period | 2026 - 2031 |
| Base Year Market Size (2025) | USD 7.5 Billion |
| Market Size (2026) | USD 7.81 Billion |
| Market Size (2031) | USD 9.58 Billion |
| Growth Rate (2026 - 2031) | 4.16 % |
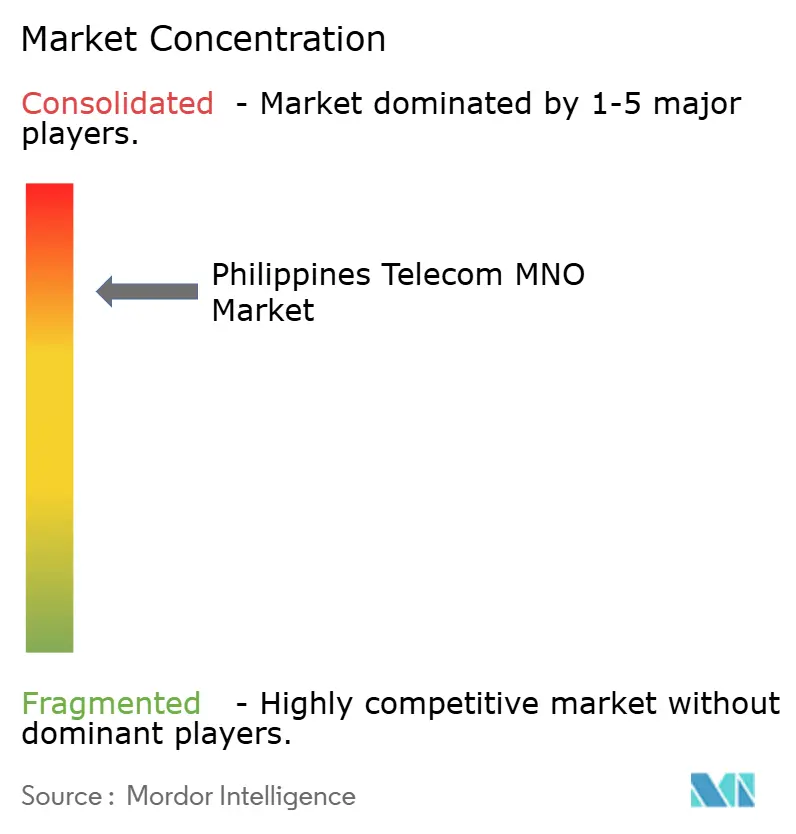
| Market Concentration | High |
Major Players *Disclaimer: Major Players sorted in no particular order Image © Mordor Intelligence. Reuse requires attribution under CC BY 4.0. | |
Philippines Telecom MNO Market Analysis by Mordor Intelligence
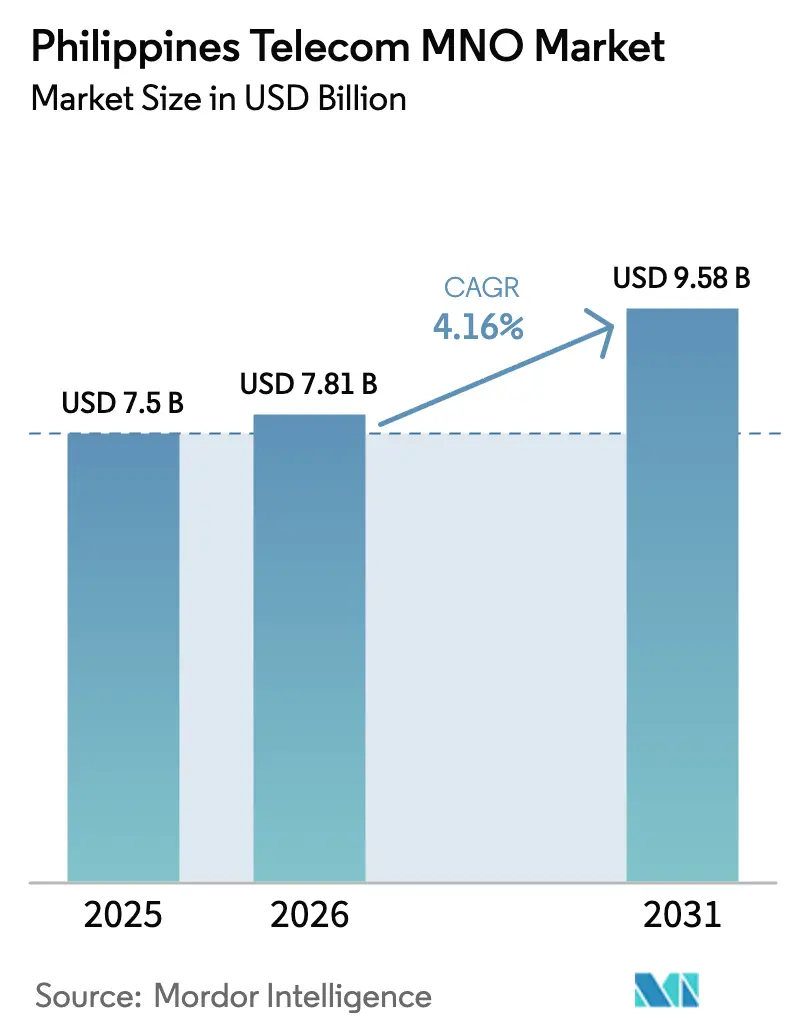
The Philippines Telecom MNO Market size in 2026 is estimated at USD 7.81 billion, growing from 2025 value of USD 7.5 billion with 2031 projections showing USD 9.58 billion, growing at 4.16% CAGR over 2026-2031.
Growth is powered by the rapid pivot to mobile‐data services, progressive spectrum reforms and the maturing 5G footprint that now blankets every regional capital. New frequency auctions scheduled for 2026, together with mandatory tower-sharing rules, are lowering entry barriers and widening coverage in underserved municipalities. Data traffic from video streaming and mobile gaming continues to drive incremental revenue, while fintech-anchored super-apps are lifting average revenue per user by bundling payments, micro-loans and entertainment under a single login. On the supply side, operators are racing to harden networks against typhoon-related outages and to bring edge data-centers online for low-latency enterprise workloads.
Key Report Takeaways
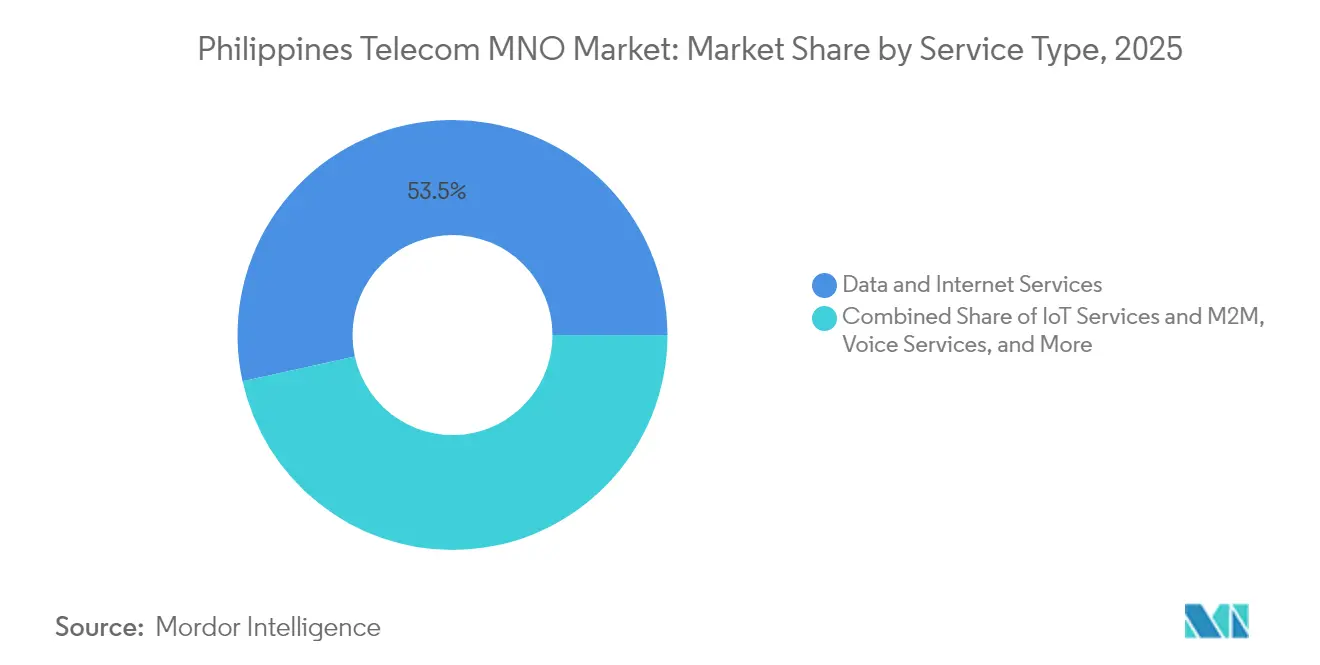
- By service type, mobile data captured 53.46% of Philippines telecom MNO market share in 2025, while IoT and M2M services are projected to expand at a 4.28% CAGR to 2031.
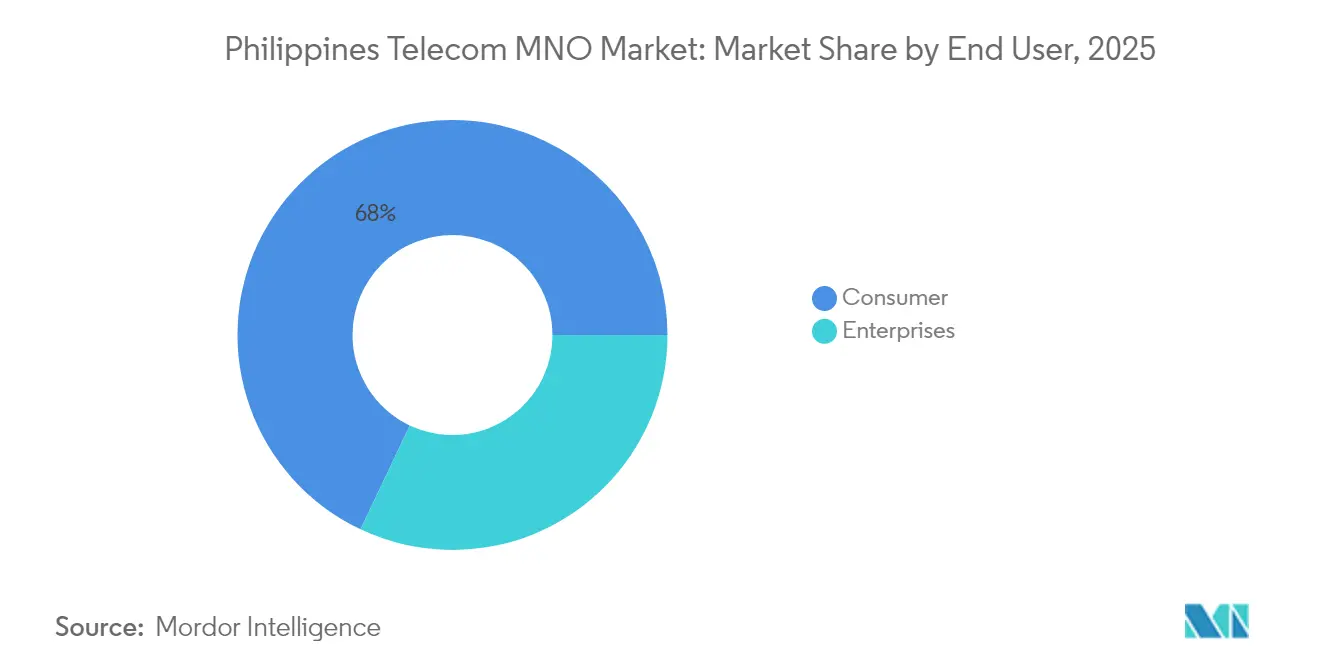
- By end user, the consumer segment held 67.97% of the Philippines telecom MNO market size in 2025, whereas enterprise connectivity is advancing at a 4.42% CAGR through 2031.
Note: Market size and forecast figures in this report are generated using Mordor Intelligence’s proprietary estimation framework, updated with the latest available data and insights as of 2026.
Philippines Telecom MNO Market Trends and Insights
Drivers Impact Analysis*
| Driver | (~) % Impact on CAGR Forecast | Geographic Relevance | Impact Timeline |
|---|---|---|---|
| Rising mobile-data consumption from video and gaming boom | +1.2% | National, highest in Metro Manila | Medium term (2-4 years) |
| Accelerated 5G roll-out and device affordability | +0.8% | Urban centers, expanding to provincial capitals | Long term (≥ 4 years) |
| Government common-tower and spectrum-reform programs | +0.6% | National, focus on underserved towns | Long term (≥ 4 years) |
| Enterprise digital-transformation and IoT connectivity demand | +0.5% | Metro Manila, Clark, Subic | Medium term (2-4 years) |
| Fintech super-apps bolstering stickiness and ARPU | +0.4% | National, urban skew | Short term (≤ 2 years) |
| Typhoon-resilient network design raising densification | +0.3% | Coastal provinces | Long term (≥ 4 years) |
| Source: Mordor Intelligence | |||
Rising mobile-data consumption from video and gaming boom
Average monthly data use climbed to 8.7 GB in 2024, a 340% surge since 2022, as high-definition streaming and mobile esports moved into the mainstream. [1] Philippine News Agency, “Philippine Monthly Mobile Data Usage Hits New High,” pna.gov.phVideo now absorbs 65% of peak evening traffic on Globe Telecom’s network, prompting the operator to accelerate capacity upgrades on densest LTE and 5G sites.[2]Globe Telecom, “Network Performance Dashboard Q4-2024,” globe.com.ph Gaming contributes a further uplift in premium plan uptake because competitive titles require latency below 30 ms. Localization of streaming catalogs by global providers has reinforced this data pull, with Filipino-language originals boosting subscriber acquisition. Together these factors have made mobile data the dominant revenue line in the Philippines telecom MNO market.
Accelerated 5G roll-out and device affordability
By late-2024 Smart Communications reported 95% population coverage in Metro Manila, while entry-level 5G handsets fell below PHP 10,000 (USD 175) for the first time. [3]Smart Communications, “Expanding 5G Nationwide Coverage,” smart.com.phThe confluence of coverage and cost has driven a 280% year-on-year increase in 5G SIMs. Regulatory streamlining under the Konektadong Pinoy Act trimmed tower-permit lead times from 18 months to 6 months, allowing operators to light up dense urban corridors ahead of schedule. Device manufacturers have also bundled installment schemes through e-wallets, further lowering adoption barriers. These trends underpin the long-run revenue uplift baked into the Philippines telecom MNO market forecasts.
Government common-tower and spectrum-reform programs
The Department of Information and Communications Technology approved 6,500 shared macro-sites by Q1-2025, cutting individual operator capex by up to 40% in far-flung towns. A draft Philippine Spectrum Management Act proposes transparent auctions to redistribute under-used frequencies originally awarded administratively, challenging the historical duopoly grip. Performance-based spectrum fees will reward efficient carriers, amplifying competition in 700 MHz and 3.5 GHz bands that support wide-area 5G. These structural reforms are set to widen service availability and intensify price competition over the medium term.
Enterprise digital-transformation and IoT connectivity demand
Financial institutions embraced BSP’s real-time payment rails, requiring fully redundant fiber and 5G links with 99.99% service-level commitments. In Clark and Subic, export-manufacturing plants connected thousands of sensors for predictive maintenance, generating new recurring fees for managed IoT connectivity. Government’s eGovPH platform obliges agencies to migrate citizen services online, further inflating demand for secure MPLS and private 5G slices. Enterprise ARPU typically runs 3-4 × consumer levels, cushioning margin pressure in the Philippines telecom MNO market.
Restraints Impact Analysis*
| Restraint | (~) % Impact on CAGR Forecast | Geographic Relevance | Impact Timeline |
|---|---|---|---|
| Heavy 5G / fiber capex burden on operators | –0.7% | National, acute in remote areas | Medium term (2-4 years) |
| Low rural ARPU limiting ROI | –0.5% | Mountainous and island provinces | Long term (≥ 4 years) |
| SIM Registration Act–driven prepaid deactivations | –0.3% | National, rural bias | Short term (≤ 2 years) |
| Climate-related outages raising opex and churn risk | –0.2% | Typhoon-prone coastal belts | Long term (≥ 4 years) |
| Source: Mordor Intelligence | |||
Heavy 5G / fiber capex burden on operators
PLDT allocated PHP 92 billion (USD 1.6 billion) in capex during 2024—23% of service revenue—as it densified 5G radios and pushed fiber-to-the-home deeper into suburbs. Each 5G site needs 40-60% more cash than its 4G predecessor once spectrum, backhaul and edge upgrades are included. Upcoming spectrum auctions may add upfront costs running into hundreds of millions of USD. Consequently, carriers prioritize high-ARPU districts and postpone rural builds, slowing universal-service progress.
Low rural ARPU limiting ROI
Average revenue per user in remote provinces remains stuck at PHP 150-200 (USD 2.6-3.5) per month, barely covering site power and backhaul expenses. Geographic fragmentation forces the use of submarine cables or microwave spurs that lift unit costs fivefold versus mainland fiber. Prepaid churn compounds the problem: subscribers hop between promos, diluting lifetime value. Without subsidies or expanded tower-sharing, operators lack a viable path to rapid rural 5G economics, restraining the overall Philippines telecom MNO market CAGR.
*Our forecasts treat driver/restraint impacts as directional, not additive. The impact forecasts reflect baseline growth, mix effects, and variable interactions.
Segment Analysis
By Service Type: Data services drive revenue transformation
Mobile‐data services generated 53.46% of 2025 operator revenue, confirming their primacy within the Philippines telecom MNO market. This share will widen as 5G penetration spreads beyond early adopters and as streaming video climbs beyond 60% of peak traffic loads. The Philippines telecom MNO market size attributable to IoT and M2M services is forecast to compound at 4.28% annually, underpinned by smart-city deployments in Metro Manila and agro-monitoring projects across Luzon’s rice belt. Voice revenue continues its structural retreat—down 80% since 2020—as messaging apps absorb person-to-person traffic.
In response, operators bundle OTT video and music subscriptions, monetizing data while preserving engagement. Business messaging APIs are replacing legacy SMS for e-commerce order updates and two-factor authentication, mitigating revenue loss. Emerging edge-cloud services such as mobile private networks and network slicing are expected to anchor the next wave of enterprise contracts. These dynamics ensure that data-centric offerings will broaden the Philippines telecom MNO market over the forecast horizon.



By End User: Enterprise growth accelerates digital divide
Consumers still accounted for 67.97% of 2025 connections, reflecting a SIM penetration rate that tops 150% in urban agglomerations. Yet enterprise lines are rising faster, with a 4.42% CAGR projected through 2031. Banking, BPO and government users demand carrier-grade uptime and cybersecurity wrappers, pushing their contribution to Philippines telecom MNO market share well above revenue share parity by 2028. The Philippines telecom MNO market size derived from corporate accounts delivers ARPU three to four times higher than prepaid mass-market lines, providing an essential cushion against consumer price wars.
The Bangko Sentral ng Pilipinas insists on redundant links for licensed digital banks, while manufacturing exporters in eco-zones stipulate SLA-backed fiber and 5G for machine-vision and IoT telemetry. The government’s cloud-first policy mandates secure connectivity to DICT’s GovCloud, further inflating enterprise bandwidth demand. Operators are tailoring vertical bundles—combining SD-WAN, cybersecurity and managed cloud—to secure long-term contracts that even out cash flow and reduce churn.
Geography Analysis
National revenue remains concentrated: Metro Manila and Calabarzon generate 45% of receipts though housing only 25% of the population. ARPU in the capital averaged PHP 450 (USD 8) in 2024 versus PHP 200 (USD 3.5) in rural districts. Cebu and Davao act as secondary growth hubs thanks to BPO spillover and port modernization, attracting fiber backbones and the first edge-data-center clusters. International subsea cables SJC2 and ADC supply extra terabits of capacity, enhancing the archipelago’s appeal to hyperscale cloud tenants.
Rural communities, especially in the Visayas and Mindanao islands, lag on both coverage and speed. The Konektadong Pinoy Act aims to compress this divide by mandating passive-infrastructure sharing and by accelerating permit approvals, but execution varies by municipality. Northern Luzon now benefits from fresh fiber routes linking Laoag to Manila, while conflict-affected Mindanao provinces await broader investment once security risks ebb. These disparities influence how quickly the Philippines telecom MNO market can capture remaining addressable subscribers.
Climate resilience drives mounting opex in coastal belts battered by 20 typhoons annually. Following Typhoon Odette’s 2021 damage, Globe and Smart introduced pre-positioned gensets and microwave emergency rings that restore basic service within 24 hours. Capital disbursements into hardened shelters and elevated power plants add 15-20% to rural site cost but reduce customer churn during disaster seasons. Meanwhile, the clustering of new hyperscale facilities—such as STT Fairview 1’s 124 MW campus—cements the Philippines as a rising data-center node complementing Singapore and Jakarta.
Regulatory Landscape
The Philippines telecom MNO market is regulated by the National Telecommunications Commission (NTC), with policy direction from the Department of Information and Communications Technology (DICT) and competition oversight from the Philippine Competition Commission (PCC). A key inflection is the Konektadong Pinoy Act (RA 12234), which removed the legislative franchise requirement for data transmission industry participants (DTIPs), reshaping how network and connectivity providers can qualify to operate and interconnect alongside incumbent MNOs.
Implementation has tightened around eligibility and infrastructure rules. NTC Memorandum Circular No. 002-02-2026 introduced new DTIP eligibility and compliance requirements, while DICT-issued passive telecommunications tower infrastructure sharing measures in 2026 reinforced tower sharing and siting discipline. These measures include restrictions on constructing adjacent towers and separation guidance aimed at curbing inefficient duplication. In parallel, the Dig Once Policy supports coordinated civil works to lower rollout friction, aligning with the market push toward faster densification and wider geographic reach.
Competitive Landscape
The market is a tight oligopoly: Globe Telecom and PLDT-Smart together served roughly 85% of SIMs in 2024, while DITO Telecommunity held more than 15 million lines barely three years post-launch. PLDT’s April 2025 purchase of Digitel folded Sun Cellular into Smart, shoring up double-SIM users in the low-end segment. Globe counters with a fintech ecosystem—GCash counts 94 million wallets—that embeds payments, lending and insurance, deepening user stickiness and pushing blended ARPU upward. DITO focuses on flat-rate data and gamer promotions to carve out a youth niche.
Competition has shifted from headline tariffs to network quality and bundled services. Globe completed 92% 5G coverage in NCR using 3.5 GHz and 700 MHz spectrum, while Smart invests in millimeter-wave clusters to win enterprise contracts needing <10 ms latency. DITO leverages a fresh, all-IP network for VoNR and stands to benefit if the 2026 spectrum auctions redistribute premium low-band blocks. White-space opportunities remain in agritech IoT and wholesale backhaul to new data-centers sprouting in Laguna and Pampanga.
Regulators signaled tougher performance oversight: the NTC revoked NOW Telecom’s mobile license in May 2025 after verifying only six active base stations—far short of its rollout pledge. This precedent underscores compliance risk for niche aspirants and increases barriers for would-be fourth entrants. Nevertheless, towercos such as PhilTower and EdgePoint continue to aggregate passive assets, offering co-location discounts that may ultimately widen retail competition.
Philippines Telecom MNO Industry Leaders
Globe Telecom
Smart Communications
DITO Telecommunity
- *Disclaimer: Major Players sorted in no particular order

Market Opportunities and Future Outlook
Coverage extension and cost takeout are creating whitespace for both retail and wholesale mobile connectivity, supported by policy and operator actions rather than new build alone. With RA 12234 expanding DTIP participation and the NTC formalizing updated DTIP eligibility via Memorandum Circular No. 002-02-2026, the market has clearer pathways for community-based, rural, and enterprise-focused network players to participate through partnerships, localized access builds, or wholesale arrangements. These changes also map to the archipelago deployment challenge and the ongoing rural ROI gap seen in low provincial ARPU, keeping shared infrastructure and new operating models at the center of incremental coverage.
Infrastructure-sharing momentum in 2026 includes a July 2026 infrastructure-sharing memorandum between PLDT/Smart and DITO, alongside DICT reinforcement of tower sharing and restrictions on adjacent tower builds. This supports co-location, backhaul wholesaling, and managed connectivity that combines MNO radio footprints with fiber and neutral-host assets. Enterprise demand is another lever: requirements for redundant, SLA-backed connectivity tied to real-time payments and government digitization programs continue to pull higher-value services such as secure SD-WAN, private wireless, and IoT connectivity in hubs like Metro Manila, Clark, and Subic. Satellite-to-mobile initiatives add further optionality, including Globe's Starlink direct-to-cell rollout (NTC-approved in June 2026), which expands the toolkit for disaster recovery and hard-to-reach areas where terrestrial economics remain challenging.
Recent Industry Developments
- July 2026: Globe Telecom launches commercial satellite-to-mobile service using Starlink DTC technology. The launch broadens satellite enabled coverage into underserved and disaster prone areas. It positions Globe as a pioneer in satellite backed connectivity and widens its addressable market.
- July 2026: Smart Communications conducts live demonstration for international roaming with Nokia using Core SaaS Edge technology. The demonstration upgrades roaming infrastructure and reduces latency. It supports higher ARPU through premium cross border services.
- June 2026: Globe Telecom launches commercial rollout of Starlink Direct-to-Cell service approved by NTC. The regulatory approval enables satellite to cell service and expands Globe's satellite capabilities. It could alter competitive dynamics and capex focus in the Philippine market.


Research Methodology Framework and Report Scope
Market Definition and Coverage
In this report, the Philippines telecom market is defined as operator service revenues earned from providing connectivity and communication services to consumer and business customers across the country.
Scope exclusions: We exclude handset and network equipment sales, tower-only leasing revenues, and pure software IT services that do not generate telecom service revenue.
Segmentation Overview
- Overall Telecom Revenue and ARPU
- Service Type
- Voice Services
- Data and Internet Services
- Messaging Services
- IoT and M2M Services
- OTT and PayTV Services
- Other Services (VAS, Roaming and International Services, Enterprise and Wholesale Services, etc.)
- End-User
- Enterprises
- Consumer
Data Sources, Market Sizing, and Validation
Desk Research
Desk research starts with getting the best public view of demand and network activity in the Philippines, and then connecting it to operator revenue reporting. We used regulatory and government releases such as National Telecommunications Commission statistics, Department of Information and Communications Technology publications, and Philippine Statistics Authority macro indicators to ground subscriber and usage assumptions.
To avoid building the model on one data series, we also cross-checked with sources such as ITU indicators, GSMA Intelligence summaries where publicly cited, and official spectrum and licensing announcements. Company annual reports, earnings decks, and audited financial statements were used to split service lines and check year-on-year movements. In a few places, paid subscriptions for company financials, patents, and shipment-level trade data were used to clarify gaps and sanity-check imports tied to network rollouts. These desk sources are illustrative and not exhaustive, since many other references were used for data collection, validation, and clarification.
Primary Interviews and Surveys
Primary work was used to confirm how revenues are actually booked across mobile, fixed, and bundled plans, and to sense-check pricing direction when promotions shift. We spoke with a mix of operator-side teams, channel and distribution stakeholders, and enterprise connectivity buyers across key regions, and then we used their inputs to triangulate adoption trends, ARPU movement, and technology migration assumptions.
Distribution of primary research fieldwork respondents
| Company type | Respondent position |
|---|---|
| Top tier: 36% | CXOs: 14% |
| Mid tier: 49% | Functional/Unit leaders: 32% |
| Smaller Players: 15% | Managers: 54% |
Market-Sizing & Forecasting
Sizing is built with a top-down approach where subscriber bases, access mix, and usage indicators are used to reconstruct the service revenue pool, and then it is split into major service buckets through reported disclosures and interview checks. Once that market total is formed, we corroborate it with selective bottom-up approximations such as sampled plan pricing times subscriber volumes, plus channel checks on prepaid load and broadband plan uptake, and then adjust for double counting in bundles.
Key inputs used in the model include mobile and fixed subscriber counts, broadband penetration and fiber take-up, ARPU trends by service type, data traffic growth and the share of data in service revenue, and the pace of 4G to 5G migration that affects pricing and usage. For forecasting, scenario analysis is applied around a base case that is anchored on macro conditions, capex intensity, and expected pricing discipline, and then sensitivity cases are used for faster fiber rollout or more aggressive promotions. Where operator disclosures are incomplete, gaps are filled through ratio-based allocations validated in interviews, before totals are reconciled back to reported service revenue movement.
Data Validation & Update Cycle
Validation is done through triangulation across independent checks, so outputs are compared against reported service revenue trends, subscriber metrics, and public regulatory signals. Outliers are investigated by drilling down to the driver, such as an unusual ARPU shift, a one-off policy change, or a bundle reclassification, and then the assumptions are revised and re-checked.
Before sign-off, the model and narrative go through multiple analyst reviews, and re-contacts are triggered when a key input changes or two sources disagree beyond a reasonable range. Reports are refreshed annually, and interim updates are completed when material events occur, such as major pricing moves, technology rollouts, or regulatory decisions. Before delivery, a fresh final pass is done so clients receive the latest updated view.
Mordor Intelligence's Philippines Telecom Market Size Versus Other Published Estimates
Published market sizes for Philippines telecom often do not match because each publisher chooses its own scope, year mapping, and revenue line items, and these choices can look similar on paper but differ in the model. Differences also show up when forecasts assume faster or slower ARPU progression and when bundles are treated as separate services versus one billed plan.
Some external estimates add pay-TV and broader video revenues into the telecom total, and the mix of fixed, mobile, and adjacent services is not always clearly reconciled to operator service revenue. In Mordor Intelligence, the market total is kept tied to MNO service revenue accounting and then validated using subscriber movement and ARPU direction so that add-on categories are only counted when they sit inside operator-reported service revenue.
Benchmark comparison
| Source | Market Size | Gaps in Research Methodology |
|---|---|---|
| Mordor Intelligence | USD 7.50 B (2025) | |
| Trade Journal A | USD 8.00 B (2024) | This figure is stated as telecom plus pay-TV services revenue, so the total can run higher than a telecom-only service revenue pool, and the split of bundled plans is not shown. |
| Industry Publisher B | USD 7.11 B (2023) | The scope description is broad (voice, data, and video across wired and wireless), and the base year differs, which can shift currency timing, inflation effects, and the revenue lines included in the total. |
The comparison shows that the biggest spread comes from what is included alongside core connectivity services and from the base year selected for the snapshot. When the total is built from clearly defined service revenue lines, and then cross-checked with subscriber and ARPU realities, the estimate becomes easier to trace and repeat across updates.


Key Questions Answered in the Report
How large is the Philippines telecom MNO market in 2026?
It generated USD 7.81 billion in service revenue in 2026 and is projected to reach USD 9.58 billion by 2031 at a 4.16% CAGR.
Which segment is growing fastest within Philippine mobile services?
IoT and M2M connectivity leads with a 4.28% CAGR through 2031, spurred by smart-city and agricultural use cases.
What share of revenue comes from data services?
Mobile-data accounted for 53.46% of operator revenue in 2025 and continues to rise as voice contracts.
How significant is 5G adoption?
5G subscribers expanded 280% year-on-year in 2024 after handset prices fell below PHP 10,000 and coverage exceeded 90% of Metro Manila.
Which players dominate the market?
Globe Telecom and PLDT-Smart together hold roughly 85% of active SIMs, with DITO Telecommunity occupying the remaining mainstream share.
What regulatory actions could reshape competition?
The proposed Philippine Spectrum Management Act would auction under-utilized bands and impose performance-based fees, potentially opening doors for new entrants by 2026.
Page last updated on:


 Your data is secure and never sold or shared.


