
Market Overview
| Study Period | 2020 - 2031 |
|---|---|
| Forecast Data Period | 2026 - 2031 |
| Base Year Market Size (2025) | 4.25 gigawatt |
| Market Volume (2026) | 5.43 gigawatt |
| Market Volume (2031) | 18.49 gigawatt |
| Growth Rate (2026 - 2031) | 27.78 % |
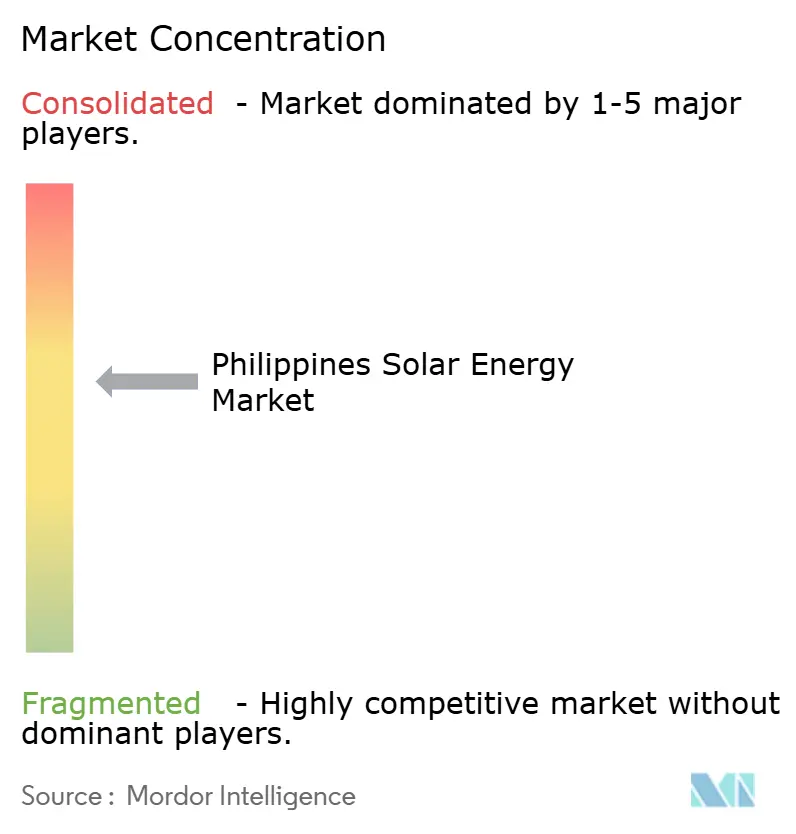
| Market Concentration | Medium |
Major Players *Disclaimer: Major Players sorted in no particular order Image © Mordor Intelligence. Reuse requires attribution under CC BY 4.0. | |
Philippines Solar Energy Market Analysis by Mordor Intelligence
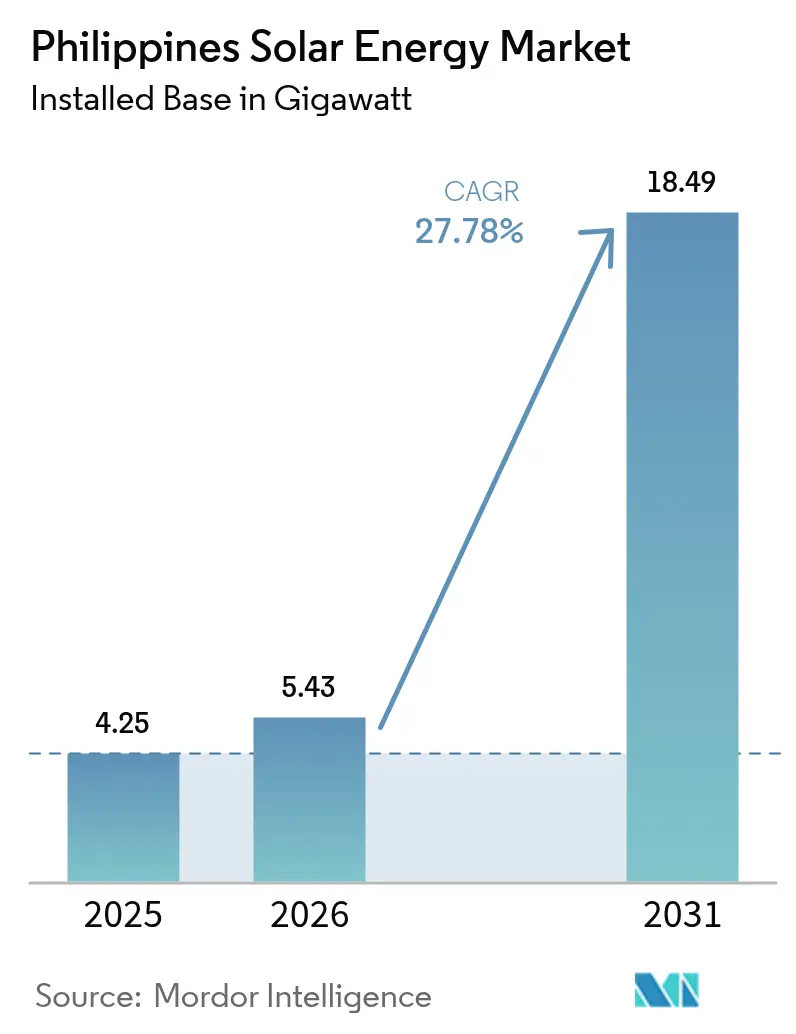
The Philippines Solar Energy Market size is expected to grow from 4.25 gigawatt in 2025 to 5.43 gigawatt in 2026 and is forecast to reach 18.49 gigawatt by 2031 at 27.78% CAGR over 2026-2031. Declining module and balance-of-system costs have driven the levelized cost of utility-scale solar down to USD 0.044 per kWh, making new photovoltaic capacity the least-cost choice for meeting baseload demand. Strong demand from hyperscale data centers and business-process outsourcing firms is accelerating hybrid solar-plus-storage projects that guarantee 24/7 clean power. Meanwhile, the Department of Energy’s Green Energy Auction Program (GEAP) has awarded 10.2 GW of capacity in its fourth round, pushing the national development pipeline above 36 GW. Floating solar on Laguna Lake and irrigation reservoirs is emerging as a land-neutral alternative, and reforms that lifted the net-metering ceiling from 100 kW to 1 MW are expected to unlock commercial and industrial rooftops.
Key Report Takeaways
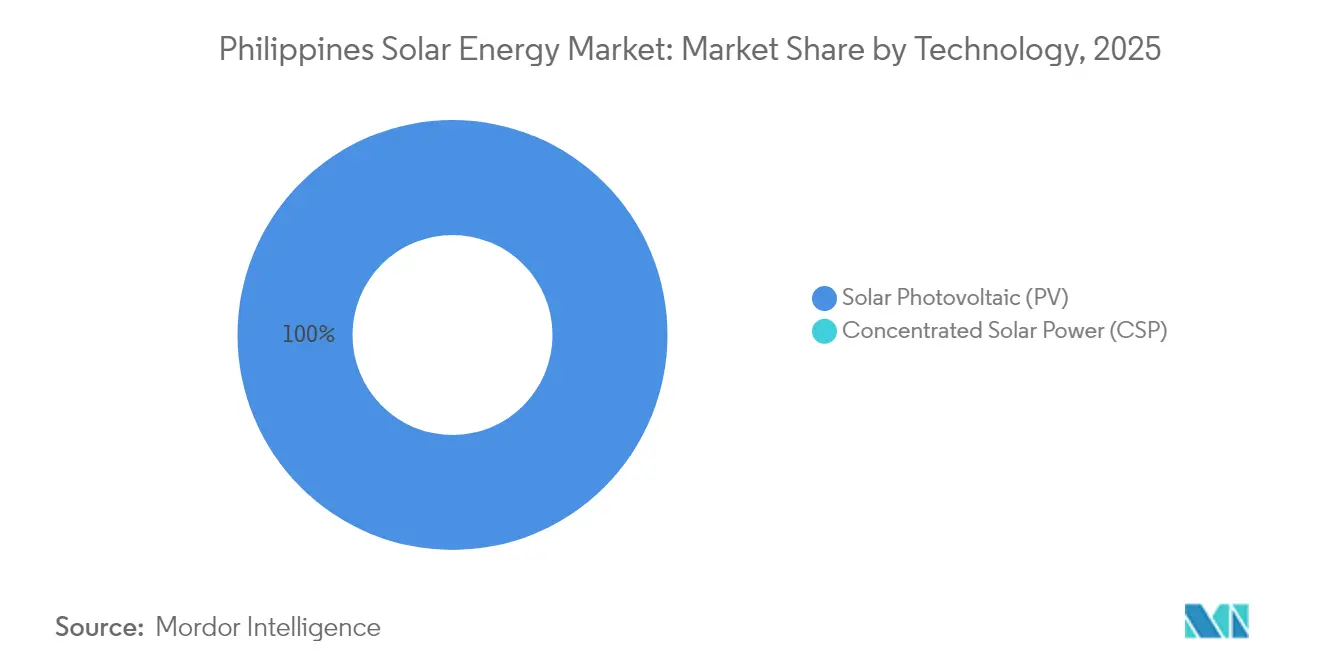
- By technology, solar photovoltaic captured 100.00% of 2025 capacity, while concentrated solar power remained absent due to land and climate constraints.
- By grid type, on-grid installations held 97.15% of capacity in 2025; off-grid systems will register the fastest 31.15% CAGR through 2031.
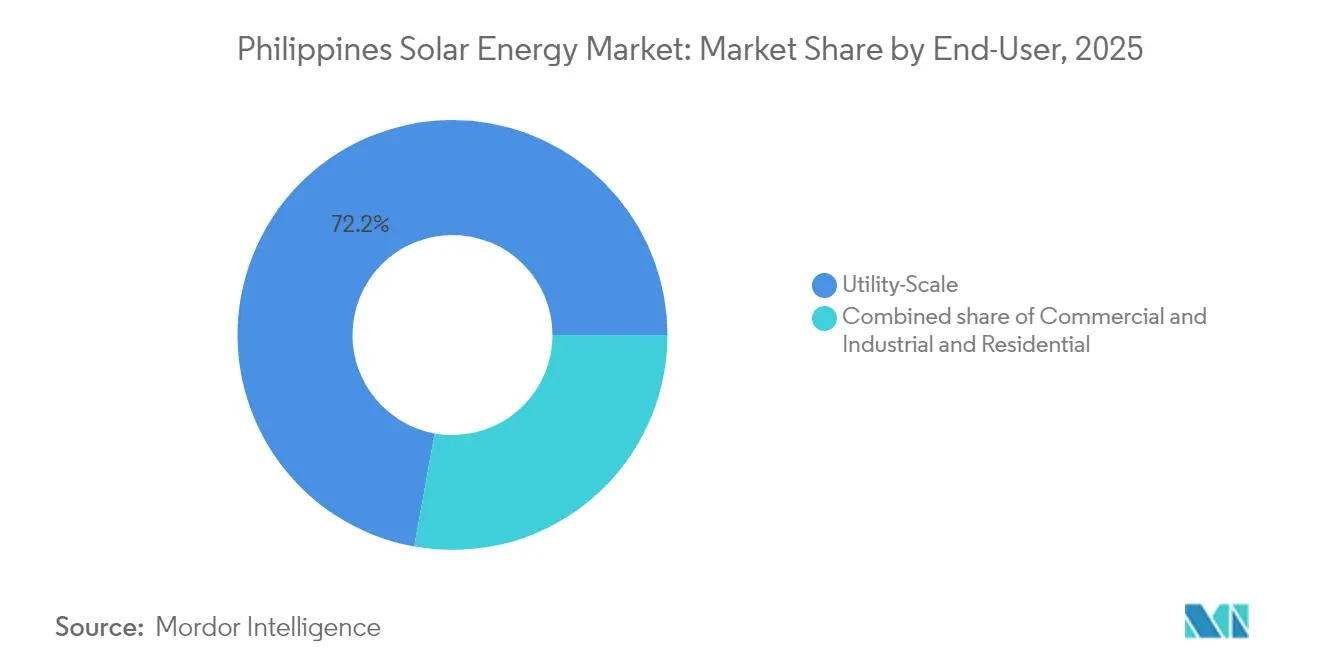
- By end-user, utility-scale projects commanded 72.15% of 2025 capacity, whereas residential rooftops are forecast to expand at a 31.60% CAGR to 2031.
- Citicore, ACEN, and Aboitiz Power secured the bulk of GEAP-4 awards, and Trina Solar’s 3 GW module partnership with Citicore highlights equipment supply consolidation.
Note: Market size and forecast figures in this report are generated using Mordor Intelligence’s proprietary estimation framework, updated with the latest available data and insights as of 2026.
Philippines Solar Energy Market Trends and Insights
Drivers Impact Analysis*
| Driver | (~) % Impact on CAGR Forecast | Geographic Relevance | Impact Timeline |
|---|---|---|---|
| Rapid decline in PV module & BOS costs | 6.20% | Nationwide, led by Luzon corridors | Short term (≤ 2 years) |
| Green energy auctions unlocking ≥1 GW yearly | 8.50% | Luzon & Visayas | Medium term (2-4 years) |
| Corporate PPAs from hyperscalers & BPOs | 5.10% | Metro Manila, Cavite, Laguna, Cebu | Medium term (2-4 years) |
| Net-metering reform raising cap to 1 MW | 3.80% | Urban residential & C&I clusters | Long term (≥ 4 years) |
| Floating-solar buildout on reservoirs | 2.70% | Laguna Lake, Mindanao impoundments | Long term (≥ 4 years) |
| ASEAN carbon-border adjustment pressure | 2.40% | Export zones in Cavite, Laguna, Bataan, Cebu | Medium term (2-4 years) |
| Source: Mordor Intelligence | |||


Rapid Decline in PV Module & BOS Costs
Global utility-scale solar leveledized costs fell to USD 0.044 /kWh in 2023, a 90% drop since 2010, slashing capital outlays for every Philippine project.[1]International Renewable Energy Agency, “Renewable Power Generation Costs in 2023,” irena.orgLocal firms now receive price quotes under USD 0.19 /W for Tier-1 modules, widening project margins and spurring Sol-Go to locate assembly lines in the country. Balance-of-system spending, historically 75% of Asian solar budgets, is becoming a new domestic value-add avenue, with metal frame, inverter, and cable manufacturers repositioning for export.[2]Institute for Energy Economics and Financial Analysis, “Asia’s Solar BOS Cost Trends,” ieefa.org This cost trajectory raises the competitive standing of the Philippines' solar energy market against imported LNG and legacy coal, accelerating utility procurement and corporate PPAs. Over the medium term, it also underpins a nascent local manufacturing base that could supply 3-5 GW of modules annually by 2030, further anchoring the supply chain.
Green Energy Auctions (GEAP) Unlocking ≥1 GW Solar Pipeline from 2025
The Department of Energy's competitive tender model replaces static feed-in tariffs with price discovery, awarding 1 GW of solar in its inaugural round and setting a 9,378 MW target for the fourth auction that includes solar-storage hybrids. Developer appetite remains robust, GEA-3 drew 7,500 MW of solar bids for a 4,650 MW cap, compressing tariffs and ensuring 20-year off-take certainty. Auction-linked PPAs lower financing risk, enabling lenders to trim spreads and developers to stretch capacity factors with storage add-ons. The integration of mandatory battery systems from GEA-4 onwards signals policy maturation toward grid-friendly renewables that can address midday curtailment. Collectively, auctions move the Philippines' solar energy market toward predictable build-out cycles and transparent cost benchmarks.
Corporate PPAs by Hyperscalers & BPOs Demanding 24/7 Clean Power
Rising data-center footprints and BPO campuses are shifting demand to hourly hourly-matched renewable supply. Digital Edge secured hydro-based power for its NARRA 1 facility, while the USD 2.7 billion Narra Technology Park pledges 100% clean electricity within five years. First Gen has lined up 180 MW of data-center PPAs, illustrating the scale of private offtake outside utilities. Contracts now embed real-time carbon accounting and require storage or hybrid portfolios to assure continuous green coverage. This has catalyzed niche integrators capable of blending solar, wind, hydro, and batteries for bespoke load profiles, adding depth to the Philippines' solar energy market.
DOE Net-Metering Reform Lifting 100 kW Cap to 1 MW (2024)
Expanding net-metering unlocks commercial rooftops previously constrained by a residential-sized ceiling. Aboitiz Power pegs rooftop solar headroom at 13 GW, while a study of 139 factories found 132 becoming bankable once the cap moved to 1 MW, totaling 1,035 MWp of capacity. The Senate is considering full removal of size limits, underscoring bipartisan support. Coupled with rising grid tariffs and diminishing panel prices, payback periods for warehouse or mall installations fall below five years, igniting fresh momentum in the Philippines' solar energy market.
Restraints Impact Analysis*
| Restraint | (~) % Impact on CAGR Forecast | Geographic Relevance | Impact Timeline |
|---|---|---|---|
| Weak grid capacity in Visayas-Mindanao corridor | -4.30% | Visayas & Mindanao | Medium term (2-4 years) |
| High financing costs vs. Vietnam & Malaysia (≥9% WACC) | -3.60% | Nationwide | Short term (≤ 2 years) |
| Land-acquisition disputes under CARP | -2.10% | Rural Luzon & Visayas | Long term (≥ 4 years) |
| Typhoon-related O&M disruptions | -1.80% | Coastal and island sites | Long term (≥ 4 years) |
| Source: Mordor Intelligence | |||
Weak Grid Capacity in Visayas-Mindanao Corridor
Only 6 of 16 priority transmission projects were completed by 2023, delaying the PHP 52 billion Mindanao-Visayas backbone by three years.[3]ScienceDirect, “Transmission Delays in Visayas-Mindanao,” sciencedirect.comBottlenecks restrict solar additions south of Luzon, compelling developers to cluster where interconnection is available and leaving ample irradiance unexploited. The Transmission Development Plan 2022-2040 maps expansions, but execution lags grid demand. Until high-voltage lines catch up, project pipelines will stay skewed toward Luzon.
High Financing Costs vs Vietnam & Malaysia (≥9% WACC)
The weighted average cost of capital for Philippine power projects stands above 9%, versus sub-8% in Malaysia and Thailand. Transmission operator NGCP carries an approved 15.04% rate of return, inflating developer hurdle rates and limiting solar-plus-storage ventures. Sovereign risk premiums, currency volatility, and shallow green bond markets keep spreads elevated.
*Our forecasts treat driver/restraint impacts as directional, not additive. The impact forecasts reflect baseline growth, mix effects, and variable interactions.
Segment Analysis
By Technology: PV Dominance, CSP Absent
Solar photovoltaic accounted for the entire 2025 installation base, reinforcing a Philippines solar energy market share of 100.00%. High-efficiency n-type i-TOPCon and bifacial modules lift output and cut land needs, helping the Philippines' solar energy market size for PV rise at a 27.78% CAGR. CSP remains commercially non-viable due to land scarcity and typhoons, and the DOE master plan allocates no targets for the technology.
The market's equipment shift toward string inverters and hybrid PV-plus-storage architectures improves uptime and meets 24/7 procurement clauses in corporate PPAs. Terra Solar's 3.5 GW PV and 4.5 GWh storage confirm this hybrid trend, locking in long-duration supply contracts with hyperscalers.


By Grid Type: On-Grid Leads, Off-Grid Accelerates
On-grid projects held 97.15% of 2025 installations, reflecting GEAP awards and corporate rooftop growth near Luzon load centers. Off-grid systems, however, will log a 31.15% CAGR, aided by PHP 5 billion in rural electrification grants that lower costs for mini-grids serving remote barangays. On-grid scale keeps installed costs near USD 0.80 per watt, while off-grid hybrids remain upward of USD 1.20 per watt yet still undercut diesel generation.
Policy enables cross-subsidy: GEAP guarantees offtake for on-grid plants, and cost-plus tariffs de-risk off-grid service providers. Although the Philippines' solar energy industry treats off-grid additions as small in absolute terms, they are critical for universal electrification.
By End-User: Utility-Scale Dominates, Residential Surges
Utility-scale assets captured 72.15% of 2025 capacity, securing economies of scale and cheaper finance. Residential rooftops, supported by the expanded 1 MW net-metering cap, are forecast to outpace all categories at a 31.60% CAGR. Commercial and industrial roofs occupy a middle tier, motivated by tariff hedging and ESG commitments. Upfront cost and financing access remain the main barriers slowing residential growth despite a sub-five-year payback.
Geography Analysis
Luzon commands roughly 78.40% of national technical potential and most commissioned capacity thanks to denser transmission, industrial demand, and auction focus. Flagship builds such as the Philippines' solar energy market-size-defining 3.5 GW Terra Solar and ACEN’s 1,120 MW floating-solar program underline the region’s dominance. Transmission reinforcement, while ongoing, is better funded here than elsewhere.
Visayas, with around 14.60% potential, continues to suffer curtailment risk because NGCP delays hold back substation and line upgrades. Aboitiz Power’s 173 MWp Calatrava plant illustrates that well-capitalized sponsors can co-invest in grid upgrades, though many smaller developers cannot absorb the extra costs. Cebu’s export-led economy fuels PPA demand, yet projects face queue times that inflate financial models.
Mindanao captures only about 7.00% of the potential and features the weakest grid. Electrification funds are channeling into solar mini-grids for Sulu, Tawi-Tawi, and Palawan, shifting market focus there from utility-scale to distributed hybrids. Grid-scale projects wait for the Visayas-Mindanao interconnection upgrade now slated for post-2027, tempering near-term additions.
Regulatory Landscape
The Philippines solar regulatory framework is anchored by Republic Act No. 9513 (Renewable Energy Act of 2008), with the Department of Energy (DOE) setting policy and program design and the Energy Regulatory Commission (ERC) acting as the independent regulator for approvals and tariff-related determinations. The DOE continues to use competitive procurement through the Green Energy Auction Program (GEAP) as a primary pathway for new renewable capacity awards, alongside the broader implementing rules and regulations for renewable energy development.
Recent rulemaking has shifted attention toward grid integration and permitting administration. In February 2026, the DOE issued Department Circular No. DC2026-02-0008, requiring new variable renewable energy projects of 10 MW or more to include energy storage sized at least 20% of installed capacity, pushing developers toward solar-plus-storage configurations. In June 2026, the DOE circulated a draft proposal to streamline permitting for own-use solar by exempting zero-export and isolated micro-solar systems from prior distribution-utility clearances, reducing procedural friction for commercial and industrial self-supply installations. Separately, the ERC approved adjustments to solar FIT rates for 2014 plants, with recovery for 2021-2025 adjustments beginning in 2026 over five years. The DOE’s 2024-2028 Missionary Electrification Development Plan also supports solar PV and batteries for off-grid areas such as Palawan, Masbate, Catanduanes, Marinduque, and Mindoro.
Competitive Landscape
The Philippines' solar energy industry shows moderate fragmentation, with the top five players together controlling just under 40% of installed capacity in 2024. ACEN Corp leads with 7 GW in service or late-stage development, aiming for 20 GW by 2030, and recently consolidated Islasol to solidify its presence in Visayas. Solar Philippines, via SP New Energy Corp, focuses on ultra-large farms, including Terra Solar, backed by Actis's USD 600 million investment for a 40% stake, underscoring foreign appetite for bankable assets. Vena Energy accelerated expansion through a 550 MW greenfield commitment, reinforcing its regional strategy.
Strategically, domestic utilities leverage vertical integration to combine generation, distribution, and retail offers. Meralco PowerGen's Terra Solar 2 proposes a second giga-scale plant in Batangas, pairing solar with multi-hour storage to defer grid upgrades. Joint ventures such as Citicore-San Miguel's 153.5 MW Bataan farm illustrate risk sharing: local conglomerates supply land and permits, while renewable specialists contribute EPC and O&M expertise. New entrants eye floating solar, rooftop leasing, and manufacturing localization as white-space plays, further broadening the competitive fabric of the Philippines' solar energy market.
M&A remains active: Acciona's entry via the Daanbantayan PPP, PATRIZIA's USD 100 million fund placement, and multiple BESS groundbreakings by Aboitiz Power reflect deal diversity across generation and storage verticals. With auctions providing visibility and corporate PPAs deepening, developer portfolios increasingly bundle solar, wind, hydro, and batteries into integrated proposals.
Philippines Solar Energy Industry Leaders
Solar Philippines Power Project Holdings
ACEN Corp.
Vena Energy
Citicore Power Inc.
Aboitiz Power Corp.
- *Disclaimer: Major Players sorted in no particular order

Market Opportunities and Future Outlook
Policy and procurement design are creating clear opportunities for integrated solar-plus-storage builds and for projects sited across multiple geographies. With the DOE requiring storage for larger variable renewable projects (February 2026 circular), and with the auction structure that accommodates solar-storage hybrids, developers and suppliers are being steered toward battery integration, EMS controls, and grid-services-oriented configurations. This supports the market’s ongoing move toward hybrid architectures for corporate buyers, where cleaner power procurement and tighter hourly matching needs increase demand for EPCs, integrators, and financiers that can package PV with multi-hour storage, forecasting, and ancillary services.
A second opportunity set is emerging through distributed and land-neutral deployment pathways. The DOE’s June 2026 draft on simplifying own-use and zero-export installations lowers procedural barriers for self-consumption systems, complementing earlier net-metering reforms that expanded addressable rooftop system sizes for commercial sites. Separately, the DOE’s 10-year green energy auction roadmap to procure 25 GW of additional renewable capacity by 2035, along with the announced 2026 seventh auction round that prioritizes rooftop, ground-mounted, and floating solar (including a stated allocation focus on Mindanao), creates room for developers to target areas that may remain unsubscribed and to pursue formats such as floating solar on reservoirs where land constraints and permitting can be limiting. Off-grid demand is also shaped by the 2024-2028 Missionary Electrification Development Plan, supporting solar PV plus batteries for island grids and remote provinces where diesel displacement economics and service reliability are central.
Recent Industry Developments
- July 2026: Meralco PowerGen Corp. (MGEN) inaugurated Phase 1 of the MTerra Solar project in Nueva Ecija and Bulacan, comprising 1,373 MW of solar PV and 825 MW (3,300 MWh) of battery energy storage. The milestone advances one of the country’s largest solar-plus-storage builds and reinforces the market shift from standalone PV to firmed capacity that can better align with grid reliability needs and large-load procurement.
- June 2026: ACEN Corp. infused PHP 1.15 billion into its subsidiary Giga Ace 8 Inc. to fund the 300.11 MWp Palauig Solar 2 project in Zambales. The capitalization supports continued scaling of utility-scale solar pipelines in Luzon and signals sustained balance-sheet backing for large projects amid tighter interconnection and grid-support requirements.
- April 2026: Citicore Renewable Energy Corp. (CREC) energized the 125 MWp Citicore Solar Pangasinan facility in Santa Barbara and Calasiao. Commissioning adds near-term on-grid capacity and strengthens Citicore’s footprint in Central Luzon, a key corridor for connecting new solar supply to major demand centers.


Research Methodology Framework and Report Scope
Market Definition and Coverage
This market is defined as solar power deployment in the Philippines, measured as installed capacity added and operating, and tracked in gigawatts across on-grid and off-grid systems.
Scope exclusions: We exclude broader renewable generation like wind, hydro, biomass, and geothermal, and we also exclude downstream electricity retailing and transmission revenues.
Segmentation Overview
- By Technology
- Solar Photovoltaic (PV)
- Concentrated Solar Power (CSP)
- By Grid Type
- On-Grid
- Off-Grid
- By End-User
- Utility-Scale
- Commercial and Industrial (C&I)
- Residential
- By Component (Qualitative Analysis)
- Solar Modules/Panels
- Inverters (String, Central, Micro)
- Mounting and Tracking Systems
- Balance-of-System and Electricals
- Energy Storage and Hybrid Integration
Data Sources, Market Sizing, and Validation
Desk Research
Desk research helps set the factual base for the Philippines solar buildout, so the model starts from what is already commissioned and what is clearly in the pipeline. We mainly use public energy statistics and policy documents to understand auction volumes, interconnection rules, and the amount of capacity that can move from awards to actual commissioning.
In practice, we referenced sources such as Department of Energy releases and project lists, ERC publications on net-metering and interconnection, PSA energy and economic indicators, and grid planning documents from the system operator, alongside customs and trade statistics that indicate import momentum for PV related equipment. We also reviewed company filings, investor presentations, reputable press coverage, and patent databases to gauge technology changes and cost direction. These examples are not exhaustive, and many other public sources were also checked to collect data, validate assumptions, and clarify gaps.
Primary Interviews and Surveys
Primary interviews were used to confirm what portion of announced or awarded projects is likely to reach commissioning, and how timelines shift due to permitting and grid readiness. We spoke with a mix of developers, EPCs, equipment suppliers, and large buyers, and we validated assumptions with power sector advisors focused on the main island grids, so the final view reflects on-ground constraints and demand intent.
Distribution of primary research fieldwork respondents
| Company type | Respondent position |
|---|---|
| Top tier: 30% | CXOs: 17% |
| Mid tier: 53% | Functional/Unit leaders: 31% |
| Smaller Players: 17% | Managers: 52% |
Market-Sizing & Forecasting
The sizing logic is anchored in a top-down build where national installed capacity is reconstructed from commissioning additions, project award pipelines, and grid connection readiness, then translated into annual capacity totals for the study period. We corroborate these totals with selective bottom-up checks, such as sampled project size roll-ups by region, channel checks on typical system sizes for commercial and residential, and a sanity check using indicative equipment volumes and installation activity.
A few inputs carried the most weight, including awarded capacity under auction programs, historical commissioning pace, grid interconnection lead times, rooftop adoption signals under net-metering, and the expected split between utility-scale and distributed systems. Where project lists were incomplete or timelines conflicted, we handled gaps through range assumptions that were re-tested with interview feedback before being locked.
For forecasting, we used scenario analysis supported by an adoption curve view, since solar additions in the Philippines tend to occur in steps when policy, grid availability, and financing conditions align. We stress-tested the forward path by varying commissioning slippage, auction conversion rates, and rooftop uptake, and the final trajectory reflects the most consistent scenario across expert consensus and observable constraints.
Data Validation & Update Cycle
Outputs were checked against independent signals like grid planning targets, auction award totals, and publicly visible commissioning announcements, then reviewed again for year-to-year jumps that did not align with permitting or interconnection realities. When a variance looked material, we revisited the assumptions and re-contacted selected experts to confirm whether it was a true market shift or a data timing issue.
Before sign-off, the model and narrative go through multiple analyst reviews so definitions, units, and timeframes stay consistent. Reports are refreshed annually, with interim updates when a material event changes the build pipeline or policy direction, and a final pre-delivery pass is done so clients receive the latest view available.
Mordor Intelligence's Philippines Solar Energy Market Size Compared Against Other Published Estimates
Published figures for the Philippines solar energy market often differ because some sources size the market in value terms, while others track physical capacity, and these do not move in sync when prices fall or component mix shifts. Differences also come from whether forecasts assume faster auction conversion and quicker grid connections, or whether they use longer commissioning timelines tied to permitting and interconnection lead times.
The table shows a wide spread mainly because some estimates treat the market as a hardware and systems spend number in USD, while our report tracks installed capacity in GW that is commissioned and counted in the operating base. The table also points to a scope gap, because in Mordor Intelligence's model, solar output is counted only when capacity is commissioned or firmly scheduled for grid connection, and announced projects without clear interconnection status sit outside scope.
Benchmark comparison
| Source | Market Size | Gaps in Research Methodology |
|---|---|---|
| Mordor Intelligence | USD 4.25 B (2025) | |
| Regional Consultancy A | USD 2.19 B (2024) | This estimate is presented as market value, which can diverge from deployment when equipment prices move down, and it can also include a broader bill of materials and services beyond capacity accounting. |
| Trade Journal B | USD 2.06 B (2025) | This estimate appears to be built around equipment categories and spending, and the final totals can change depending on assumed system pricing, import mix, and whether delayed projects are still treated as market output. |
Taken together, the spread is best explained by unit choice and what is being counted as market output, which can shift the result even if the same projects are being discussed. Our steps keep assumptions traceable to commissioning pace, auction conversion, and grid readiness, and the benchmark stays repeatable as new capacity data gets released.


Key Questions Answered in the Report
How fast is capacity expected to grow in the Philippines solar energy market?
Installed capacity is projected to rise from 5.43 GW in 2026 to 18.49 GW by 2031, advancing at a 27.78% CAGR.
Which technology dominates new builds?
Photovoltaic systems hold 100.00% of current installations, and no concentrated solar power projects are in the pipeline.
What share do utility-scale projects hold today?
Utility-scale plants account for 72.15% of 2025 capacity, reflecting auction-driven growth and large corporate PPAs.
Why is floating solar gaining traction?
Reservoir-based arrays avoid land-acquisition delays, deliver up to 10% higher yields, and have 2.6 GW of announced capacity led by ACEN and Blueleaf Energy.
What challenges slow rural adoption?
High upfront costs, limited consumer financing, and interconnection delays limit residential rooftop uptake despite a four-year payback.
How do financing conditions compare with neighbors?
Weighted average cost of capital averages ?9% in the Philippines, versus 6-7% in Vietnam and ?6% in Malaysia, raising hurdle rates for developers.
Page last updated on:




