Market Overview
| Study Period | 2020 - 2031 |
|---|---|
| Forecast Data Period | 2026 - 2031 |
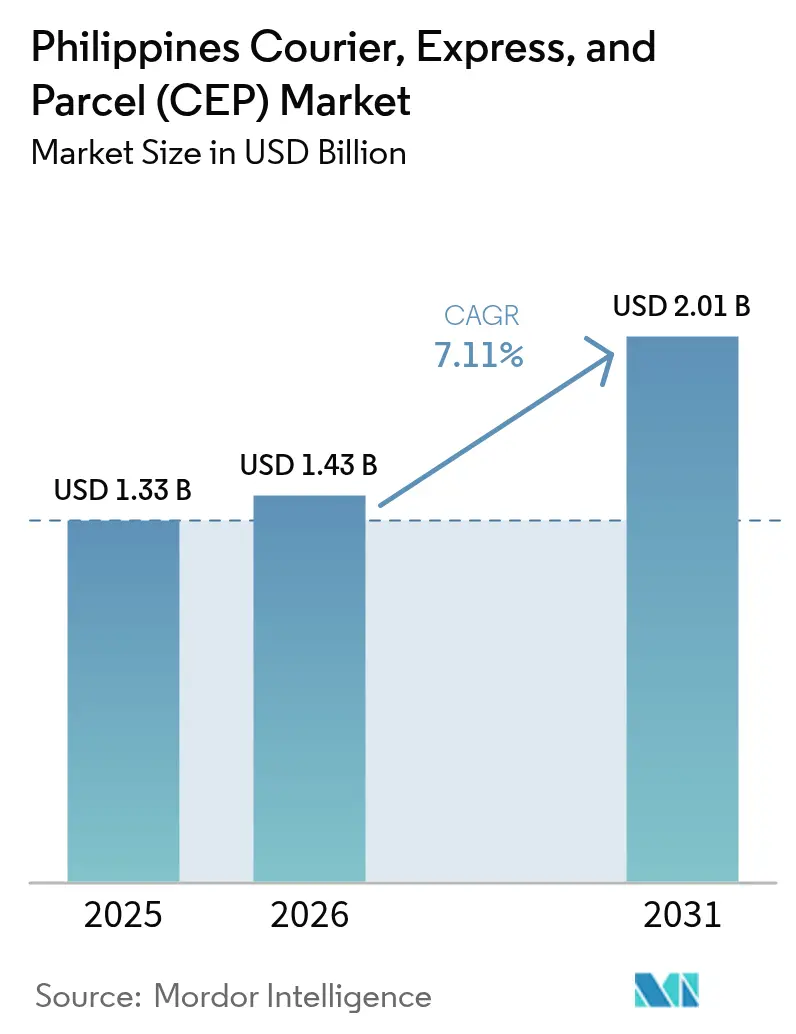
| Base Year Market Size (2025) | USD 1.33 Billion |
| Market Size (2026) | USD 1.43 Billion |
| Market Size (2031) | USD 2.01 Billion |
| Growth Rate (2026 - 2031) | 7.11% CAGR |
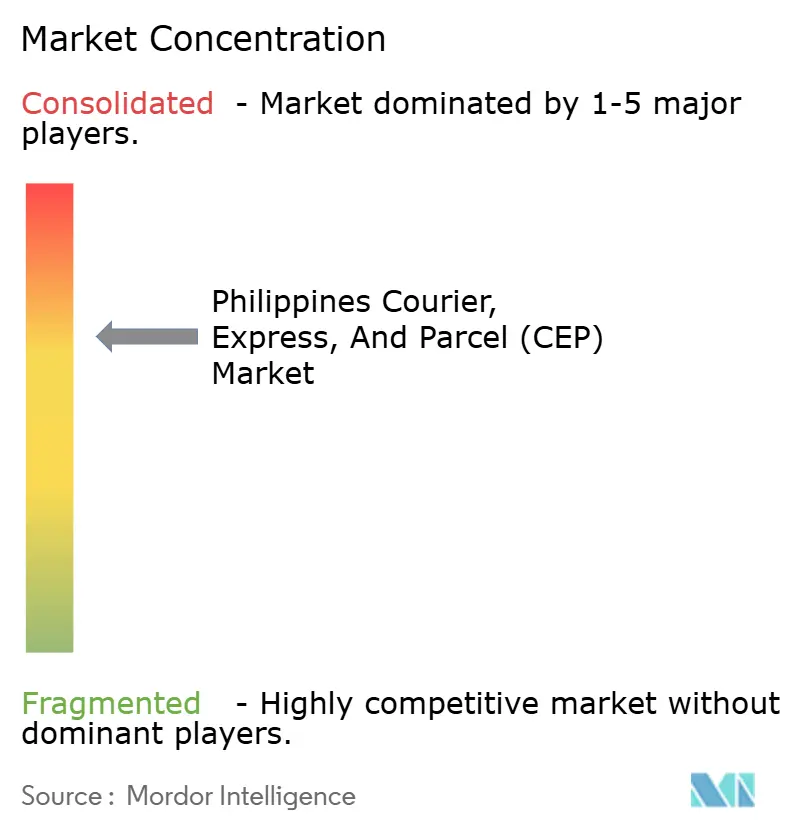
| Market Concentration | Medium |
Major Players *Disclaimer: Major Players sorted in no particular order Image © Mordor Intelligence. Reuse requires attribution under CC BY 4.0. | |
Philippines Courier, Express, And Parcel (CEP) Market Analysis by Mordor Intelligence
The Philippines courier, express, and parcel (CEP) market size is projected to be USD 1.33 billion in 2025 and USD 1.43 billion in 2026, and reach USD 2.01 billion by 2031, growing at a CAGR of 7.11% from 2026 to 2031.
Consistent digital-commerce adoption, infrastructure upgrades under the Build Better More program, and widening provincial coverage are sharpening competitive differentiation. E-commerce order frequency doubled in 2025, reshaping network design toward high-parcel-count routes and pushing operators to automate sorting hubs. Explosive promotional-event peaks, which can push daily parcel volumes 300-400%, have become the new planning baseline for Manila-centric facilities. Meanwhile, inter-island shipping efficiencies are improving as private airlines add capacity and airports such as Clark double warehouse footprints. Labor stability is gradually rising after new courier-rider welfare rules extended social protection and reined in turnover, lifting service quality in the Philippines courier, express, and parcel market.
Key Report Takeaways
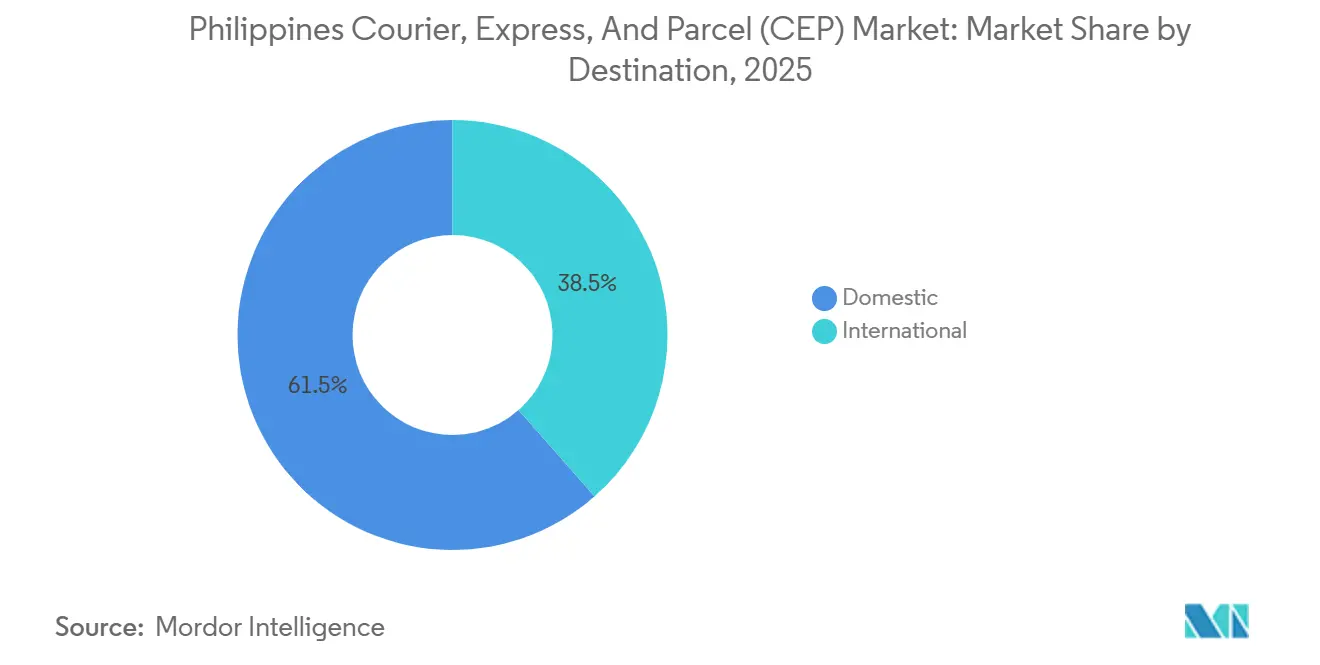
- By destination, domestic shipments led with 61.49% of the Philippines courier, express, and parcel (CEP) market share in 2025, while international flows are the fastest-growing at a 7.82% CAGR to 2031.
- By speed of delivery, non-express services held a 73.17% market share in 2025; express deliveries are projected to rise at an 8.13% CAGR through 2031.
- By business model, B2C accounted for 61.28% of 2025 revenue, whereas the C2C segment records the highest 8.71% CAGR on the back of social-commerce scaling.
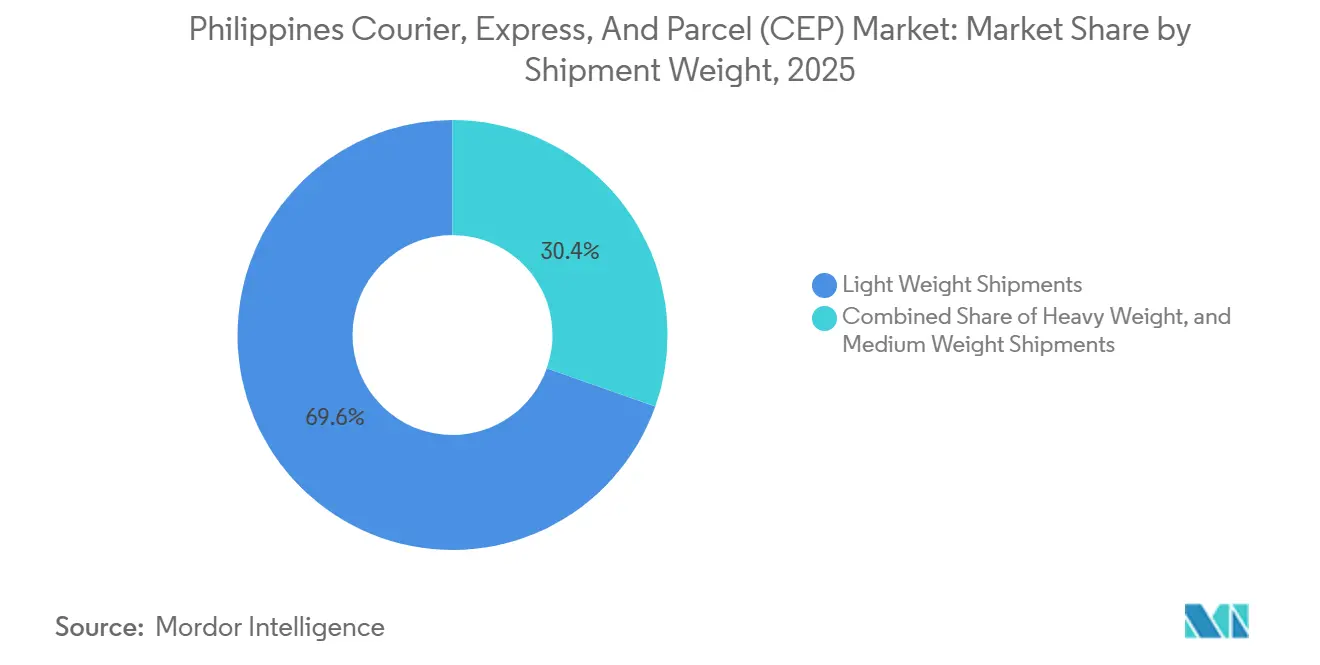
- By shipment weight, light parcels captured 69.61% of the Philippines courier, express, and parcel (CEP) market size in 2025 and will continue leading at a 7.57% CAGR.
- By mode of transport, road services dominated with 54.34% share in 2025; air cargo expands the quickest at 7.82% CAGR as new airport facilities come online.
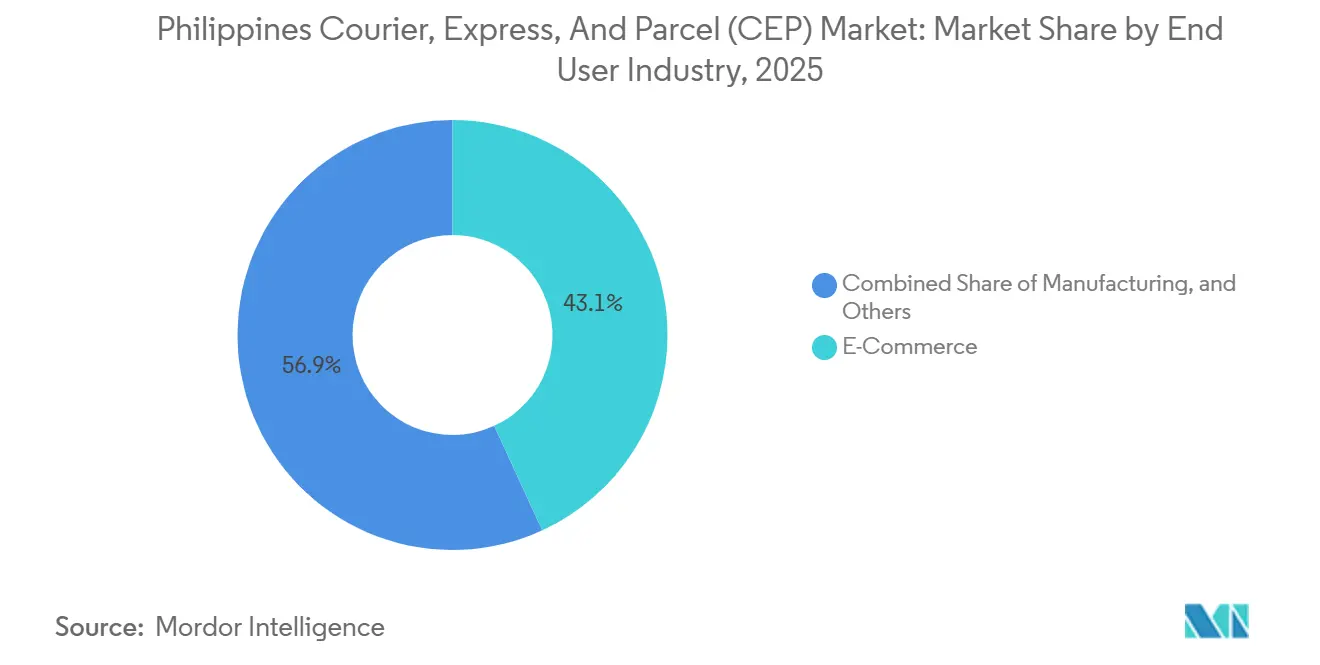
- By end-user industry, e-commerce generated 43.14% of demand in 2025, while healthcare exhibits the strongest 8.64% CAGR as temperature-controlled capacity scales up.
Note: Market size and forecast figures in this report are generated using Mordor Intelligence’s proprietary estimation framework, updated with the latest available data and insights as of 2026.
Philippines Courier, Express, And Parcel (CEP) Market Trends and Insights
Drivers Impact Analysis*
| Driver | ( ~ ) % Impact on CAGR Forecast | Geographic Relevance | Impact Timeline |
|---|---|---|---|
| Surging online retail parcel traffic | +2.3% | National, concentrated in NCR and Calabarzon | Short term (≤ 2 years) |
| Urban consumers demanding sub-same-day fulfilment in Greater Manila | +1.4% | Metro Manila, Quezon City, Makati, Pasig | Short term (≤ 2 years) |
| Proliferation of provincial micro-sellers on social commerce platforms | +1.9% | Visayas, Mindanao, provincial Luzon | Medium term (2-4 years) |
| Roll-out of flagship infrastructure under Build Better More programme | +1.0% | National corridors, priority port upgrades | Long term (≥ 4 years) |
| Enhanced courier-rider welfare policies boosting labour availability | +0.8% | Urban centers, delivery hubs nationwide | Medium term (2-4 years) |
| Trials of unmanned aerial vehicles for hard-to-reach archipelagic routes | +0.3% | Palawan, Mindanao islands, remote municipalities | Long term (≥ 4 years) |
| Source: Mordor Intelligence | |||


Surging Online Retail Parcel Traffic
E-commerce already equates to 5.5% of GDP and is generating delivery densities that justify automated mega-sortation investments in Metro Manila. Promotional events such as 11.11 and 12.12 inflate daily parcels four-fold, forcing couriers to design overflow routing and mobile pop-up sorters. Basket sizes are smaller yet order frequency higher, so profitability hinges on per-stop efficiency rather than per-kilogram rates. Marketplaces now embed strict service-level clauses, creating a two-tier competitive field between scale operators and niche players. These volumes keep the Philippines courier, express, and parcel market on a high-growth trajectory[1]“e-Commerce Roadmap Updates,” Department of Trade and Industry, dti.gov.ph.
Urban Consumers Demanding Sub-Same-Day Fulfilment in Greater Manila
Roughly 24 million residents in the capital region expect 2-4-hour delivery windows, compressing historical lead times by 70%. Motorcycle fleets numbering in the thousands allow high stop-density drops that vans cannot match under congestion. Premium fees collected for faster service currently offset the 20-30% higher per-parcel cost, but rush-hour traffic variability still threatens promise compliance. Consumer expectations now include real-time map-based tracking and on-the-fly scheduling changes, making sophisticated routing engines mandatory. As a result, express parcels represent the fastest-expanding revenue stream in the Philippines courier, express, and parcel market[2]“Trade Facilitation Performance Report,” Bureau of Customs, customs.gov.ph .
Proliferation of Provincial Micro-Sellers on Social Commerce Platforms
More than 129 Negosyo Centers coach rural entrepreneurs on packaging and shipping, expanding origination nodes beyond Metro Manila. Small sellers of crafts and specialty food use Facebook and TikTok to reach buyers nationwide, heightening demand for reverse-logistics pick-ups and consolidated drop-off points. Couriers must layer flexible pick-up schedules onto routes designed originally only for delivery. Packaging variance from non-professional shippers raises quality-control workloads, but incremental volume secures load factors on otherwise back-haul legs. Social commerce hence deepens provincial penetration of the Philippines courier, express, and parcel market.
Roll-Out of Flagship Infrastructure Under Build Better More Programme
USD 180 billion in public spending through 2028 aims to lower logistics costs from 27% to below 20% of GDP by modernizing ports and RORO links. Electronic manifests are trimming customs clearance times by up to 50%. Expanded RORO lanes shorten inter-island trips, enabling tighter dispatch schedules and more reliable ETAs. Road and bridge upgrades open new barangays for everyday parcel service, enlarging the Philippines courier, express, and parcel market addressable base. Long-haul cost curves are expected to fall steadily once priority works pass mid-construction in 2027.
Restraints Impact Analysis*
| Restraint | ( ~ ) % Impact on CAGR Forecast | Geographic Relevance | Impact Timeline |
|---|---|---|---|
| Chronic backlog at key seaports and Ro-Ro links | -1.3% | Manila, Cebu, Davao port complexes | Short term (≤ 2 years) |
| Volatile diesel prices squeezing delivery unit economics | -0.9% | National, acute in inter-island routes | Medium term (2-4 years) |
| Informal household addressing in countryside municipalities | -0.7% | Rural barangays, provincial areas | Long term (≥ 4 years) |
| Aggressive rate undercutting by app-based couriers | -0.5% | Metro Manila, Cebu, Davao urban cores | Short term (≤ 2 years) |
| Source: Mordor Intelligence | |||
Chronic Backlog at Key Seaports and RORO Links
Ports still operate above design capacity, pushing vessel wait times to as long as five days during revival peaks, which consumes up to 40% of total inter-island transit. Fixed RORO sailing windows allow limited agility when weather or mechanical disruptions occur, forcing couriers to stock buffer inventory. Manual customs paperwork prolongs dwell times even as digital roll-outs advance incrementally. Until berth expansions complete, backlogs will periodically erode service reliability in the Philippines courier, express, and parcel market[3]“Port Congestion Statistics,” Bureau of Customs, customs.gov.ph.
Volatile Diesel Prices Squeezing Delivery Unit Economics
Fuel costs account for more than half of transport spend on multi-modal island routes. Sudden price spikes cannot be fully passed through because shippers resist dynamic surcharges in a price-sensitive market. Battery-electric vehicles remain impractical outside Metro Manila owing to limited charging infrastructure. Profit margins therefore hinge on network optimization and backhaul fill rates capabilities smaller operators lack intensifying consolidation within the Philippines courier, express, and parcel market[4]“Quezon City, Ninja Van Support MSMEs,” Manila Standard, manilastandard.net.
*Our forecasts treat driver/restraint impacts as directional, not additive. The impact forecasts reflect baseline growth, mix effects, and variable interactions.
Segment Analysis
By End-User Industry: Healthcare Leads Growth amid E-Commerce Dominance
E-commerce commanded a 43.14% market share of 2025 revenue as free-shipping thresholds entrenched parcel culture nationwide. Automated fulfillment alliances allow marketplaces to guarantee three-day delivery to 96% of addresses.
Healthcare parcels climb at 8.64% CAGR thanks to telemedicine, medication drops, and cold-chain vaccine flows. DHL’s planned EUR 500 million (USD 520.78 million) Asia health-logistics spend earmarks GDP-certified pharma hubs, plugging a critical capability gap. Financial-services documents and legal filings secure stable express demand, while wholesale trade integrates courier links for store restocking, broadening service diversity across the Philippines courier, express, and parcel market.


By Destination: International Flows Accelerate Despite Domestic Dominance
Domestic deliveries captured 61.49% of the Philippines courier, express, and parcel market share in 2025, reflecting intense intra-archipelago trade clusters anchored in Metro Manila. The Philippines courier, express, and parcel market size for domestic flows benefits from dense Manila-Cebu-Davao corridors that permit hub-and-spoke optimization. Yet serving remote islands still entails double-digit day transit windows that premium tiers partly mitigate through air–sea hybrids.
International parcels, buoyed by cross-border marketplaces and overseas Filipino worker care packages, are projected to expand at 7.82% CAGR to 2031. Customs digitization and expanded air cargo capacity, such as FedEx doubling Clark hub area to 34,000 m², reduce clearance delays and enable next-day regional links. Domestic operators diversify into freight-forwarding partnerships to capture this higher-yield segment, uplifting the blended revenue profile of the Philippines courier, express, and parcel market.
By Speed of Delivery: Express Outpaces Non-Express Volume
Non-express maintains 73.17% share as of 2025 because inter-island maritime legs constrain speed and favor cost-sensitive shippers. However, express services surge at 8.13% CAGR, fueled by sub-same-day expectations in Greater Manila, where dense drop clusters justify premium rates.
Operators invest in real-time tracking, handheld scanners, and route-prediction tools exclusively for express networks, absorbing higher unit costs to secure 25-35% gross-margin premiums. Capacity upgrades like DHL’s 40% material-handling boost at its Singapore hub underpin next-day Asia–Manila lanes. Non-express remains vital for e-commerce free-shipping offers, creating a twin-track pricing model within the Philippines courier, express, and parcel market.
By Shipment Weight: Light Parcels Define Volume Economics
Light parcels made up 69.61% of 2025 consignments, dominating conveyor-based automation layouts across Metro Manila hubs. Lower cube weights allow motorcycles and compact vans to hit 60–80 stops daily, driving scale for last-mile operators.
Dimensional pricing replaces kilogram billing, rewarding couriers who master cube utilization. Medium parcels, home decor, and kitchen appliances need manual touches that slow belts, whereas heavy parcels remain a niche B2B domain. Light-parcel prevalence underpins the cost profile of the Philippines courier, express, and parcel market size and is expected to grow at a 7.57% CAGR, making automation critical to margin defense.
By Mode of Transport: Air Cargo Gains Despite Road Dominance
Road kept a 54.34% modal share in 2025 because Luzon’s highways support nightly line-haul loops at low relative cost. Yet air cargo will rise at 7.82% CAGR as more feeder flights connect Visayas and Mindanao to Manila sort centers. DHL’s eight new 777 freighters on Asia lanes expand Philippine belly-hold options and cut miss-sort restitution times.
Maritime RORO remains indispensable for bulk non-express volumes, but schedule rigidity prompts hybrid truck–air models for high-value SKUs. The evolving mix redistributes capex toward cold-chain aircraft pallets and airport-side cross-docks, diffusing concentration risk inside the Philippines courier, express, and parcel market.
By Business Model: C2C Surge Reflects Social-Commerce Expansion
B2C transactions dominated at 61.28% in 2025 as major marketplaces bundle fulfillment and contract-logistics agreements. Predictable volumes let couriers automate sorters and negotiate bulk airline slots, protecting margins.
C2C parcels, though smaller today, post the strongest 8.71% CAGR through 2031, driven by influencer-led fashion resale and in-app live selling. Services such as Ninja Van’s two-way MSME-bank referral uplift micro-seller professionalism and credit access. The Philippines courier, express, and parcel industry consequently diversifies its revenue mix, balancing corporate contracts with fragmented individual senders.
Geography Analysis
Metro Manila accounts for an estimated 40% of national parcel throughput despite housing only 13% of the population, underscoring its primacy in the Philippines courier, express, and parcel market. Doorstep delivery expectations set here cascade to secondary cities, requiring standardized service levels nationwide.
Provincial Luzon, Visayas, and Mindanao corridors are catching up as MSME digitization unlocks origin points beyond the capital. Partnerships such as the Quezon City-Ninja Van program illustrate municipal support for local online sellers. Cebu and Davao emerge as mini-hubs, shortening trunk-haul legs by 12-18 hours for shipments staying within their islands.
International outbound and inbound parcels, while only 38.51% of 2025 volumes, enjoy customs reforms that trim paperwork time by half and open earlier flight connections. Strengthened Clark and Ninoy Aquino airport facilities give the Philippines courier, express, and parcel market reliable trans-shipment gateways into wider Asia-Pacific routes.
Competitive Landscape
The market is moderately fragmented, yet scale economics and technology costs accelerate consolidation. Established couriers, postal incumbents, and venture-backed apps overlap on urban B2C and C2C lanes, sparking price wars that compress margins by nearly one-fifth relative to 2023 levels. Automated sortation systems, real-time data lakes, and predictive routing engines have become entry tickets for winning metro contracts.
Strategic moves trend toward vertical expansion. Ninja Van rolled out a 1,000-vehicle fleet rebrand to market B2B services, signaling diversification beyond marketplace parcels. DHL channels EUR-level investments to pharma hubs, aiming at cold-chain leadership. FedEx doubles Clark hub footprint, positioning for cross-border e-commerce scale.
White-space niches remain in rural pick-up aggregation, drone last-mile for medical emergencies, and AI-enabled address validation. Operators able to combine compliance prowess with multimodal capacity will outpace peers as infrastructure bottlenecks ease. Overall, technology capability ranks above fleet size in determining future share shifts in the Philippines courier, express, and parcel market.
Philippines Courier, Express, And Parcel (CEP) Industry Leaders
DHL Group
J&T Express
LBC Express Holdings, Inc.
SM Investments Corporation (including 2GO)
Ninja Van
- *Disclaimer: Major Players sorted in no particular order

Recent Industry Developments
- May 2025: Ninja Van Philippines and Security Bank launched a two-way MSME referral scheme to bundle banking and logistics services.
- April 2025: DHL Group committed EUR 2 billion (USD 2.08 billion) to global healthcare logistics, with EUR 500 million (USD 520.78 million) for Asia Pacific cold-chain sites including the Philippines.
- February 2025: DHL Express boosted Asia Pacific network capacity, lifting next-day service reliability on Hong Kong–Philippines routes by 30%.
- January 2025: Ninja Van partnered with Universal Robina to deploy Ninja Restock scan-to-print fulfillment for FMCG branch replenishment.


Philippines Courier, Express, And Parcel (CEP) Market Report Scope
By Destination
| Domestic |
| International |
By Speed of Delivery
| Express |
| Non-Express |
By Model
| Business-to-Business (B2B) |
| Business-to-Consumer (B2C) |
| Consumer-to-Consumer (C2C) |
By Shipment Weight
| Heavy Weight Shipments |
| Light Weight Shipments |
| Medium Weight Shipments |
By Mode of Transport
| Air |
| Road |
| Others |
By End User Industry
| E-Commerce |
| Financial Services (BFSI) |
| Healthcare |
| Manufacturing |
| Primary Industry |
| Wholesale and Retail Trade (Offline) |
| Others |
| By Destination | Domestic |
| International | |
| By Speed of Delivery | Express |
| Non-Express | |
| By Model | Business-to-Business (B2B) |
| Business-to-Consumer (B2C) | |
| Consumer-to-Consumer (C2C) | |
| By Shipment Weight | Heavy Weight Shipments |
| Light Weight Shipments | |
| Medium Weight Shipments | |
| By Mode of Transport | Air |
| Road | |
| Others | |
| By End User Industry | E-Commerce |
| Financial Services (BFSI) | |
| Healthcare | |
| Manufacturing | |
| Primary Industry | |
| Wholesale and Retail Trade (Offline) | |
| Others |


Market Definition
- Courier, Express, and Parcel - The Courier, Express, and Parcel services, often called as CEP Market, refers to the logistics and postal service providers which specialize in moving small goods (parcels/packages). It captures the overall market size (USD) and market volume (number of parcels) of (1) the shipments/parcels/packages which are under 70kgs/ 154lbs weight, (2) Business Customer packages viz. Business-to-Business (B2B) & Business-to-Consumer (B2C) as well as private customer packages (C2C), (3) non-express parcel delivery services (Standard and Deferred) as well as express parcel delivery services (Day-Definite-Express and Time-Definite-Express), (4) domestic as well as international shipments.
- Demographics - To analyse total addressable market demand, population growth & forecasts have been studied and presented in this industry trend. It represents population distribution across categories like gender (male/female), development area (urban/rural), major cities among other key parameters like population density and final consumption expenditure (growth and share % of GDP). This data has been used for assessing the fluctations in demand & consumption expenditure, and the major hotspots (cities) of potential demand.
- Domestic Courier Market - Domestic Courier Market refers to the CEP shipments wherein the origin and destination is within the boundary of the geography studied (country or region as per the scope of report). It captures the market size (USD) and market volume (number of parcels) of (1) the shipments/parcels/packages which are under 70kgs/ 154lbs weight, including light weight shipments, medium weight shipments and heavy weight shipments (2) Business Customer packages viz. Business-to-Business (B2B) & Business-to-Consumer (B2C) as well as private customer packages (C2C), (3) non-express parcel delivery services (Standard and Deferred) as well as express parcel delivery services (Day-Definite-Express and Time-Definite-Express).
- E-Commerce - This end user industry segment captures the external (outsourced) logistics expenditure incurred by the e-tailers, through online sales channel, on Courier, Express, and Parcel (CEP) services. The scope includes (i) the supply chain of a company's online customer orders being fulfilled, (ii) the process of getting a product from the point of manufacturing to the point at which it is delivered to consumers. It involves managing inventory (deferred as well as time critical), shipping, and distribution.
- Export Trends and Import Trends - Overall logistics performance of an economy is positively and significantly (statistically) correlated to its trade performance (exports and imports). Hence, in this industry trend, total value of trade, major commodities/ commodity groups and the major trade partners, for the studied geography (country or region as per the scope of report) have been analysed alongside the impact of major trade/logistics infrastructure investments & regulatory environment.
- Financial Services (BFSI) - This end user industry segment captures the external (outsourced) logistics expenditure incurred by the BFSI players, on Courier, Express, and Parcel (CEP) services. CEP is important to the financial services industry in shipping of confidential documents and files. The establishments in this sector are engaged in (i) financial transactions (that is, transactions involving the creation, liquidation, or change in ownership of financial assets) or in facilitating financial transactions, (ii) financial intermediation, (iii) the pooling of risk by underwriting annuities and insurance, (iv) providing specialized services that facilitate or support financial intermediation, insurance and employee benefit programs, and (v) monetary control - the monetary authorities.
- Fuel Price - Fuel price spikes can cause delays and diruption for logistics service providers (LSPs), while drops in the same can result in higher short-term profitability and increased market rivalry to offer consumers with the best deals. Hence, the fuel price variations have been studied over the review period and presented along with the causes as well as market impacts.
- GDP Distribution by Economic Activity - Nominal Gross Domestic Product and distribution of the same, across major economic sectors in the geography studied (country or region as per scope of the report) have been studied and presented in this industry trend. As GDP is positively related to the profitability and growth of logistics industry, this data has been used in adjunction to the input-output tables/ supply-use tables for analyzing the potential major contributing sectors towards the logistics demand.
- GDP Growth by Economic Activity - Growth of Nominal Gross Domestic Product across major economic sectors, for the geography studied (country or region as per scope of the report) have been presented in this industry trend. This data has been utilized for assessing the growth of logistics demand from all the market end users (economic sectors considered here).
- Healthcare - This end user industry segment captures the external (outsourced) logistics expenditure incurred by the Healthcare players (Hospitals, clinics, mrdical centres) , on Courier, Express, and Parcel (CEP) services. The scope includes CEP services involved in the defrerred as well time critical movement of medical goods & supplies (surgical supplies and instruments, including gloves, masks, syringes, equipment). The establishments in this sector (i) include the ones providing medical care exclusively (ii) deliver services by trained professionals (iii) involve processes, including labor inputs of health practitioners with the requisite expertise (iv) are defined based on the educational degree held by the practitioners included in the industry.
- Inflation - Variations in both Wholesale Price Inflation (YoY change in producer price index) and Consumer Price Inflation have been presented in this industry trend. This data has been used to assess the inflationary environment as it plays a vital role in smooth functioning of the supply chain, directly impacting the logistics operational cost components e.g., pricing of tyres, driver wages & benefits, energy/fuel prices, maintenace costs, toll charges, warehousing rents, custom brokerage, forwarding rates, courier rates etc. hence impacting the overall freight and logistics market.
- Infrastructure - As infrastructure plays a vital role in an economy's logistics performance, variables like length of roads, distribution of road length by surface category (paved v/s unpaved), distribution of road length by road classification (expressways v/s highways v/s other roads), rail length, volume of containers handled by major ports and tonnage handled by major airports have been analysed and presented in this industry trend.
- International Express Service Market - International Express Service Market refers to the CEP shipments wherein the origin or destination is not within the boundary of the geography studied (country or region as per the scope of report). It captures the market size (USD) and market volume (number of parcels) of (1) the shipments/parcels/packages which are under 70kgs/ 154lbs weight, including light weight shipments, medium weight shipments and heavy weight shipments (ii) Inter-Region as well as Intra-Region Shipments
- Key Industry Trends - The report section named "Key Industry Trends" include all the key variables/parameters studied to better analyze the market size estimates and forecasts. All the trends have been presented in the form of data points (time series or latest available data points) along with analysis of the paramter in the form of concise market relevant commentary, for the geography studied (country or region as per the scope of report).
- Key Strategic Moves - The action taken by a company to differentiate from its competitor or used as a general strategy is referred to as a key strategic move (KSM). This includes (1) Agreements (2) Expansions (3) Financial Restructuring (4) Mergers and Acquisitions (5) Partnerships, and (6) Product Innovations. Key players (Logistics Service Providers, LSPs) in the market have been shortlisted, their KSM have been studied and presented in this section.
- Logistics Performance - Logistics Performance and Logistics Costs are the backbone of trade, and influences trade costs, making countries compete globally. Logistics performance is influenced by market wide adopted supply chain management strategies, government services, investments & policies, fuel/ energy costs, inflationary environment etc. Hence, in this industry trend, the logistics performance of the geography studied (country/ region as per the scope of report) has been analysed and presented over the review period.
- Manufacturing - This end user industry segment captures the external (outsourced) logistics expenditure incurred by the Manufacturing industry (including Hi-Tech/Technology) players, on Courier, Express, and Parcel (CEP) services. The end user players considered are the establishments primarily engaged in the chemical, mechanical or physical transformation of materials or substances into new products. Logistics Service Providers (LSPs) play a crucial role in maintaining a smooth flow of raw materials across the supply chain, enabling timely delivery of finished goods to distributors or end customers and storing & supplying the raw materials to clients for just-in-time manufacturing.
- Other End Users - Other end user segment captures the external (outsourced) logistics expenditure incurred by the construction, real estate, educational services, and professional services (administrative, waste management, legal, architectural, engineering, design, consulting, scientific R&D), on Courier, Express, and Parcel (CEP) services. Logistics Service Providers (LSPs) plays a crucial role in the reliable movement of time critical supplies and documents to/from these industries such as transporting any equipment or resources required, shipping confidential documents and files.
- Primary Industry - This end user industry segment captures the external (outsourced) logistics expenditure incurred by the AFF (Agriculture, Fishing, and Forestry) and Extraction indsutry (Oil &Gas, Quarrying and Mining) players, on Courier, Express, and Parcel (CEP) services. The end user players considered are the establishments (i) primarily engaged in growing crops, raising animals, harvesting timber, harvesting fish & other animals from their natural habitats and providing related support activities; (ii) that extract naturally occurring mineral solids, such as coal and ores; liquid minerals, such as crude petroleum; and gases, such as natural gas. Herein, Logistics Service Providers (LSPs) (i) play a crucial role in acquisition, storage, handling, transportation, and distribution activities for the optimal & continuous flow of inputs (seeds, pesticides, fertilizers, equipment, and water) from manufacturers or suppliers to the producers and smooth flow of output (produce, agro-goods) to distributors/ consumers; (ii) cover entire phases from upstream to downstream and play a crucial role in the transportation of machinery, drilling equipments, extracted minerals, crude oil & natural gas and refined/ processed products from one place to another. This includes both termperature controlled and non-temperature controlled logistics, as and when required according to the shelf life of goods being transported or stored.
- Producer Price Inflation - It indicates inflation from viewpoint of the producers viz. the average selling price received for their output over a period of time. Annual change (YoY) of producer price index is reported as wholesale price inflation in the "Inflation" industry trend. As WPI captures dynamic price movements in most comprehensive way, it is widely used by governments, banks, industry, business circles and is deemed important in formulation of trade, fiscal and other economic policies. The data has been used in adjunction to consumer price inflation for better understanding the inflationary environment.
- Segmental Revenue - Segmental Revenue has been triangulated or computed and presented for all the major players in the market. It refers to the courier, express, and parcel (CEP) market specific revenue earned by the company, over the base year of study, in the geography studied (country or region as per the scope of report). It is computed through the study and analysis of major parameters like financials, service portfolio, employee strength, fleet size, investments, number of countries present in, major economies of concern, etc. that have been reported by the company in its annual reports, webpage. For companies having scarce financial disclosures, paid databases like D&B Hoovers, Dow Jones Factiva have been resorted to and verified through industry/expert interactions.
- Transport and Storage Sector GDP - Value and growth of Transport and Storage Sector GDP has a direct relation to the freight and logistics market size. Hence, this variable has been studied and presented over the review period, in value terms (USD) and as share % of total GDP, in this industry trend. The data has been supported by concise and relevant commentary around the investments, developments, and current market scenario.
- Trends in E-Commerce Industry - Enhanced internet connectivity and boom in smartphone penetration, coupled with increasing disposable incomes, has led to a phenomenal growth in the e-commerce market globally. Online shoppers require fast and efficient delivery of their orders leading to an increase in the demand for logistics services especially e-commerce fulfilment services. Hence, the Gross Merchandise Value (GMV), historial and projected growth, breakup of major commodity groups in e-commerce industry for the studied geography (country or region as per scope of the report) have been analysed and presented in this industry trend.
- Trends in Manufacturing Industry - Manufacturing industry involves the transformation of raw materials into finished products, while logistics industry ensures the efficient flow of raw materials to the factory, and the transport of manufactured products to the distributors & consumers. Demand-Supply of both industries are highly cross-linked and critical for a seamless supply chain. Hence, the Gross Value Added (GVA), breakup of GVA into major manufacturing sectors, and growth of manufacturing industry over the review period have been analysed and presented, in this industry trend.
- Wholesale and Retail Trade (Offline) - This end user industry segment captures the external (outsourced) logistics expenditure incurred by the wholesalers and retailers, through offline sales channel, on Courier, Express, and Parcel (CEP) services. The end user players considered are the establishments primarily engaged in wholesaling or retailing merchandise, generally without transformation, and rendering services incidental to the sale of merchandise. Logistics Service Providers (LSPs) plays a crucial role in the reliable movement of supplies to and finished products from production houses to the distributors and finally to the end customer covering activites like material sourcing, transportation, order fulfillment, warehousing & storage, demand forecasting, inventory management etc.
| Keyword | Definition |
|---|---|
| Axle Load | The axle load refers to the total load (weight) bearing on the roadway through wheels connected to a given axle. Across the globe, there are systems in place to ensure axle load monitoring, wherein surpassing the defined limits set by the concerned regulatory authority can lead to penalty/fine. For transportation of goods via road this can be an important determinant of costs as knowledge about the axle load limits can be used to (i) load the vehicle optimally for maximizing profits (ii) avoid exceeding the same and hence the probable fines associated (iii) avoid wear and tear of the vehicle (iv) avoid damage to pavement resulting in noticeable public maintenance and repair costs (v) achieve better turnaround time. |
| Back Haul | Backhaul is the return movement of a transport vehicle from its original destination to its original point of departure, and can include full, partial, or empty truck loads (all or part of the way) depending on the visibility of the local freight ecosystem. In this regard, transportation of empty containers to the point of origin, known as deadheading is also a significant factor, considering the supply/container shortages across the geographies, resulting in cost escalation and under optimized profit potential attainment. Generally, the carriers offer discounts on the backhaul, to secure freight for the trip. |
| Bill of Lading (BOL) | A bill of lading is a legal contract document issued by a carrier to a shipper to acknowledge reception of their cargo, and is evidence for the contract of carriage between the two parties. Broadly it details the (i) type, quantity, and other specifications of the goods being carried (ii) destination, and terms & conditions of the shipment (iii) carrier and drivers with all the necessary information to process the shipment, which can be used for insurance and customs clearance purposes (iv) assurance that the consignment is damage-free and ready to be shipped to the consignee. In this regard, a house bill of lading (HBL) is a document issued by a freight forwarder or a non-vessel operating common carrier (NVOCC) to acknowledge receipt of items for shipment (to a shipper). If shipments from several shippers are involved a master bill of lading (MBL) might be involved which is a consolidated version of the same for all the shipments being taken care of by the carrier (to a common destination) and might be issued by the carrier to the freight forwarder or the shipper (depending on who books the transport). |
| Bunkering | Bunkering is the process of supplying fuel to power the propulsion system of a ship. It includes the logistics of loading and distributing the fuel among available shipboard tanks. In this regard, (i) Bunker fuel is technically any type of fuel oil used aboard ships. It gets its name from the containers on ships and in ports that it is stored in; in the days of steam they were coal bunkers but now they are bunker-fuel tanks, (ii) Bunker refers to the spaces (Tank) on board a vessel to store fuel, (iii) Bunker trader refers to a person dealing in trade of bunker (fuel), (iv) Bunker call is made when a cargo ship anchors or berths in a port to take on bunker oil or supplies, (v) Bunkering service is the supply of a requested quality and quantity of bunkers to a ship. Bunkering is signficant from point of view of freight rates applicable to the shipper as Bunker Contribution (BUC)/ Fuel Adjustment Factor (FAF)/ Bunker Adjustment Factor (BAF) are applied by shipping lines to offset the effect of fluctuations in the cost of bunkers. |
| Cabotage | Transport by a vehicle registered in a country, performed on the national territory of another country. Cabotage law may restrict domestic cargo traffic to be carried in its own nationally registered, and sometimes built and crewed vehicles, though regulations vary across industries/commodity groups/countries and sometimes specify maximum allowable percentage of cabotage that can be serviced by foreign registered fleet. |
| C-commerce | Collaborative commerce (also known as C-commerce), (i) describes electronically enabled business interactions among an enterprise’s internal personnel, business partners and customers throughout a trading community (industry, industry segment, supply chain or supply chain segment); (ii) is the optimization of supply and distribution channels to capitalize on the global economy by using new technology efficiently. Advantages of C-commerce, to detail few include (i) maximization of organization's efficiency and profitability (ii) technology integration with physical channels to allow companies to work together (iii) increased information exchange such as inventory and product specifications, using the web as an intermediary (iv) increased competitiveness by reaching a broader audience. Examples of C-commerce, also known as peer-to-peer commerce, include (i) companies that allow consumers to rent things from each other, or marketplaces, such as Meta (formerly Facebook) Marketplace, that allow the sale of used goods; (ii) DoorDash teamed up with many national brands, such as McDonald’s and Chipotle, to offer fast food delivery, building their business model on c-commerce. They have since expanded their delivery service from restaurants to retailers and even offer 'fleets' of drivers to businesses. |
| Courier | A business/company that delivers packages/parcels/shipments (upto 70 kgs) including quick door to door pickup and delivery service for goods or documents, domestically or internationally, on a commercial contract basis. Example, DHL Group, FedEx, United Parcel Service of America, Inc., USPS, International Distributions Services, J&T Express, SF Express among several others |
| Cross docking | Cross docking is a practice in logistics management that includes unloading incoming delivery vehicles and loading the materials directly into outbound delivery vehicles, omitting traditional warehouse logistical practices and saving time and money. It requires close synchronization of both inbound and outbound movements. It is highly significant in reduction of costs pertaining to warehousing & storage (and the associated Value Added Services). |
| Cross Trade | International transport between two different countries performed by a vehicle registered in a third country. A third country is a country other than the country of loading/embarkation and the country of unloading/disembarkation. Cross Trade law may restrict international cargo traffic to be carried by respective country's registered vehicles, and sometimes built and crewed vehicles, though regulations vary across industries/commodity groups/countries and sometimes specify maximum allowable percentage of cross trade that can be serviced by foreign registered fleet. |
| Customs Clearance | The process of declaring and clearing cargoes through customs. It includes the procedures involved in getting cargo released by Customs through designated formalities such as presenting import license/permit, payment of import duties and other required documentations by the nature of the cargo. In this regard, a customs broker is a person or company licensed by the respective department of the country to act on behalf of freight importers and exporters. |
| Dangerous Goods | Dangerous goods (or hazardous materials or HAZMAT) include flammable liquids/solids, gases (compressed, liquified, dissolved under pressure), corrosives, oxidising substances, explosive substances and articles, substances which on contact with water emit flammable gasses, organic peroxides, toxic substances, infectious substances, radioactive materials, miscellaneous dangerous goods and articles. |
| First mile Delivery | First mile delivery refers to the (i) first stage of the freight/shipment/cargo/courier transportation (ii) the transportation of goods from a merchant’s premises or warehouse to the next fulfillment centre/warehouse/hub from where the goods are forwarded (iii) shipping goods from local distribution centers to stores (For retailers) (iv) transportation of finished goods from a plant or a factory to a distribution center (For manufacturers), (v) pick up of goods from the end-customer’s home or store followed by movement to a warehouse or storage location (movers and packers), (vi) process where goods are picked up from a retailer and then transferred to third-party logistics providers or courier service providers to be delivered to the end-consumer (e-commerce). Once the package reaches the next warehouse or the courier’s hub, it is then sorted and transported further until it reaches the customer’s doorstep. Example, if one chooses UPS as a courier, first-mile delivery will be the product being delivered from manufacturer's/retailer's warehouse to the UPS’s warehouse/ fulfilment centre. |
| Last Mile Delivery | Last mile delivery refers to the very last step of the delivery process when a parcel is moved from a transportation hub (warehouse or a distribution center or fulfillment centre) to its final destination, which usually is a personal residence/retail store/ business, or parcel locker. It accounts for around half of the total cost involved in entire process of first mile, middle mile, and last mile delivery, though it can vary shipment to shipment, based on commodity, business model and similar factors. |
| Milkrun | A Milk Run is a delivery method used to transport mixed loads from various suppliers to one customer, using lean management principles applied to logistics. Instead of each supplier sending a truck every week to meet the needs of one customer, one truck (or vehicle) visits the suppliers to pick up the loads for that customer. This method of transport got its name from the dairy industry practice, where one tanker used to collect milk from several dairy farms for delivery to a milk processing company. A milk run can be a more efficient way to handle logistics but require proper planning. If the route involves products from different companies, there is need for an agreement about cost-sharing and other aspects of the cooperative delivery arrangement. Once the group settles these issues, this delivery method can save time and money for everyone by pooling operation costs and resources. |
| Multi country consolidation | Multi-Country Consolidation (MCC) is a cost-effective solution that consolidates one's cargo from different countries of origin to build Full Container Loads (FCL). MCC is most suitable for companies that import light volumes of goods from multiple countries but want to take advantage of the more economic FCL freight rates. Apart from costing some of the other advantages include (i) flexibility to choose suppliers from a wider range of origin countries without worrying about the logistics to final destination from each origin, (ii) ability to pick the most suitable suppliers from many different countries for one's business operations. The increase in one's sourcing options by MCC provides the kind of flexibility needed in competitive global markets. |
| Q-commerce | Q-commerce, also referred to as quick commerce, is a type of e-commerce where emphasis is on quick deliveries, typically in less than an hour. The companies providing Q-Commerce services might have vertically intergrated model or might be using third party delivery platforms (outsourced logistics). It has advantages like (i) competitve USP, (ii) potential to earn greater profit margins, (iii) better customer experience, (iv) guaranteed availability of products, (v) traceability, and (vi) scaleability. |
| ReverseLogistics | Reverse logistics is a type of supply chain management that moves goods from customers back to the sellers or manufacturers and may involve ciruclar economy principles (3Rs) viz. recycling, reuse (repurposing, reselling), reducing or repairing. In this regard, reverse commerce (or Recommerce) is the selling of previously owned items through physical or online marketplaces/distribution channels to buyers who reuse, recycle or resell them. |


Research Methodology
Mordor Intelligence follows a four-step methodology in all our reports.
- Step-1: Identify Key Variables: In order to build a robust forecasting methodology, the variables and factors identified in Step-1 are tested against available historical market numbers. Through an iterative process, the variables required for market forecast are set and the model is built on the basis of these variables.
- Step-2: Build a Market Model: Market-size estimations for the forecast years are in nominal terms. Inflation is considered to be a part of the pricing, and the average selling price (ASP) is varying throughout the forecast period for each country
- Step-3: Validate and Finalize: In this important step, all market numbers, variables and analyst calls are validated through an extensive network of primary research experts from the market studied. The respondents are selected across levels and functions to generate a holistic picture of the market studied.
- Step-4: Research Outputs: Syndicated Reports, Custom Consulting Assignments, Databases & Subscription Platforms


