ASEAN Courier, Express, And Parcel (CEP) Market Size and Share
Market Overview
| Study Period | 2018 - 2031 |
|---|---|
| Forecast Data Period | 2026 - 2031 |
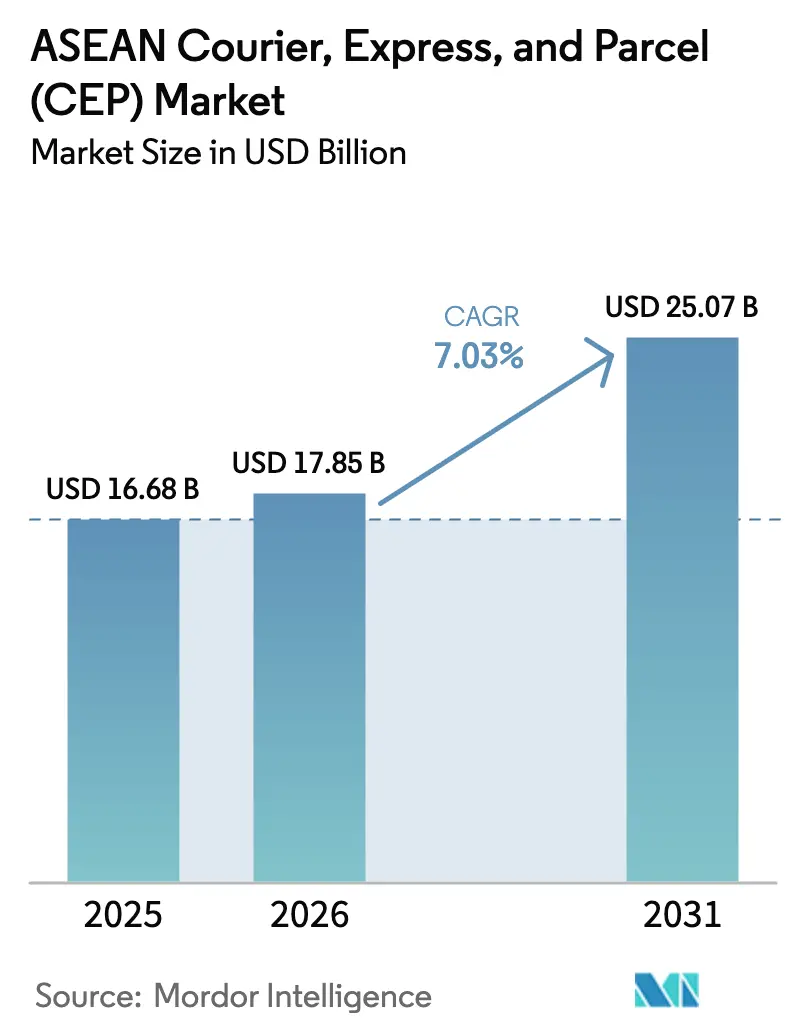
| Base Year Market Size (2025) | USD 16.68 Billion |
| Market Size (2026) | USD 17.85 Billion |
| Market Size (2031) | USD 25.07 Billion |
| Growth Rate (2026 - 2031) | 7.03% CAGR |
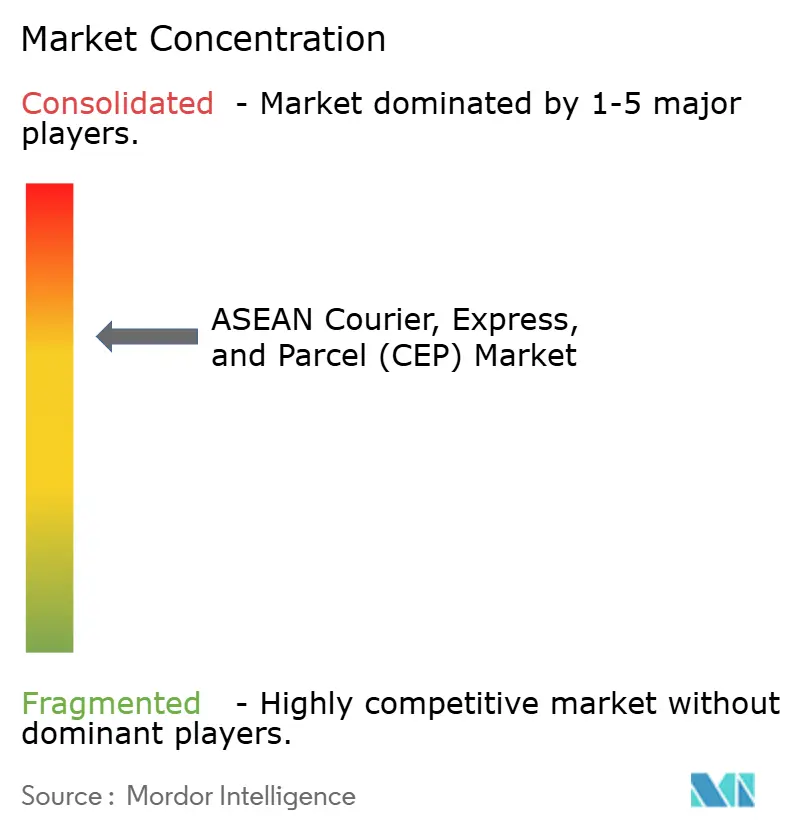
| Market Concentration | Medium |
Major Players *Disclaimer: Major Players sorted in no particular order Image © Mordor Intelligence. Reuse requires attribution under CC BY 4.0. | |
ASEAN Courier, Express, And Parcel (CEP) Market Analysis by Mordor Intelligence
The ASEAN courier express parcel market size was valued at USD 16.68 billion in 2025 and estimated to grow from USD 17.85 billion in 2026 to reach USD 25.07 billion by 2031, at a CAGR of 7.03% during the forecast period (2026-2031). Digital commerce expansion, cross-border integration initiatives such as the ASEAN Customs Transit System (ACTS), and sustained infrastructure upgrades are accelerating shipment volumes across member states. Indonesia accounts for the largest share of parcels because of its 270 million-plus consumer base and rising smartphone penetration, while Vietnam is the fastest-growing country market as manufacturing exports and online retail converge. Domestic shipments still dominate, yet international parcel flows are expanding faster, signaling ASEAN’s emergence as a single logistics corridor that connects global brands with 650 million consumers. Intensifying same-day delivery expectations in megacities, coupled with government incentives for logistics technology adoption, are encouraging operators to modernize route optimization, automation, and real-time tracking systems. At the same time, thin operating margins face pressure from fuel-price volatility and fragmented customs regimes that prolong border clearances and inflate compliance costs.
Key Report Takeaways
- By destination, domestic deliveries held 63.70% of the ASEAN courier express parcel market share in 2025, whereas international parcels are forecast to expand at a 7.05% CAGR between 2026-2031.
- By speed of delivery, express shipments commanded a 7.62% CAGR between 2026-2031, even though non-express retained 70.10% of the ASEAN courier express parcel market size in 2025.
- By model, business-to-consumer (B2C) dominated with 56.10% revenue share in 2025; consumer-to-consumer (C2C) is poised to advance at a 4.05% CAGR between 2026-2031, thanks to social-commerce micro-shipments.
- By shipment weight, light parcels accounted for 67.55% of the revenue share in 2025, while heavy parcels are projected to grow 5.32% CAGR between 2026-2031.
- By mode of transport, road transport captured 60.25% share in 2025, and air services are projected to post a 5.72% CAGR between 2026-2031 on rising cross-border demand.
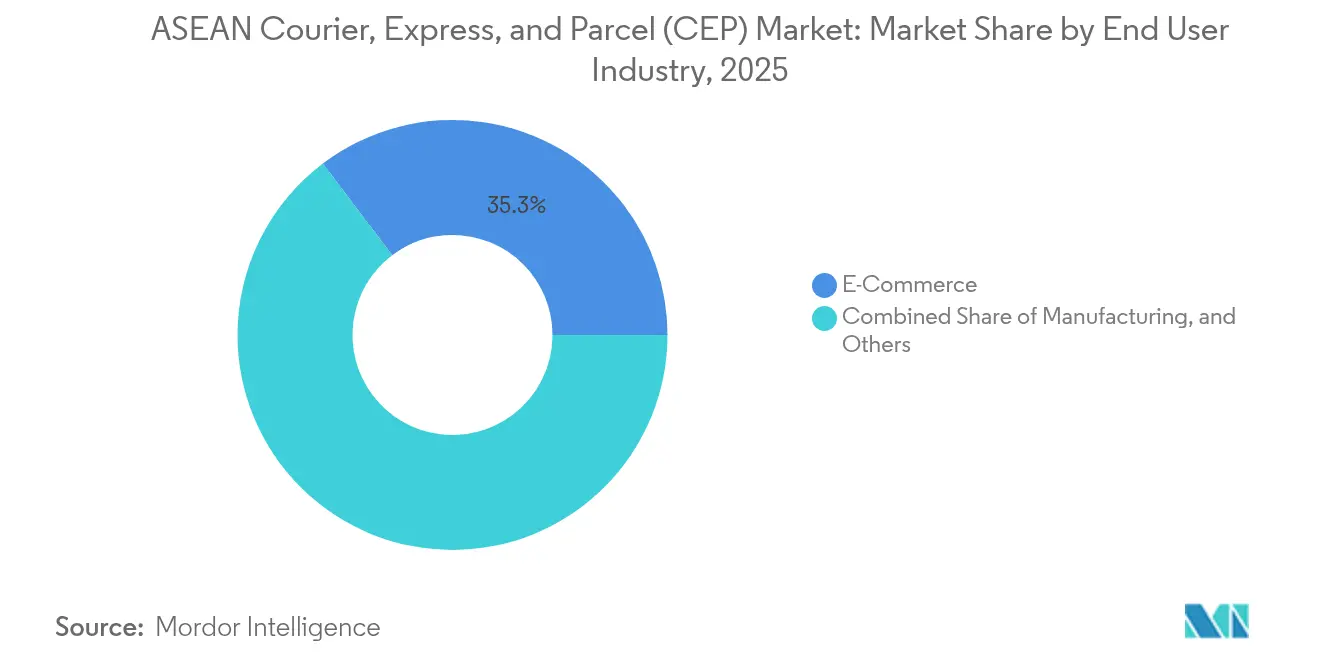
- By end user industry, e-commerce led with 35.30% share in 2025; healthcare logistics is on track for a 7.22% CAGR between 2026-2031.
- By country, Indonesia represented 46.40% of 2025 parcel revenues, whereas Vietnam is forecast to expand at 7.42% CAGR between 2026 and 2031.
Note: Market size and forecast figures in this report are generated using Mordor Intelligence’s proprietary estimation framework, updated with the latest available data and insights as of 2026.
ASEAN Courier, Express, And Parcel (CEP) Market Trends and Insights
Drivers Impact Analysis*
| Driver | (~) % Impact on CAGR Forecast | Geographic Relevance | Impact Timeline |
|---|---|---|---|
| E-commerce penetration surge post-pandemic | +2.1% | Indonesia, Thailand, Philippines; spillover to Vietnam, Malaysia | Medium term (2-4 years) |
| ASEAN cross-border digital trade pacts | +1.3% | Singapore, Malaysia, Thailand core; expanding to Vietnam, Indonesia | Long term (≥ 4 years) |
| Regional infrastructure upgrades | +0.9% | Thailand-Malaysia-Singapore corridor; Vietnam-Cambodia-Laos connectivity | Long term (≥ 4 years) |
| Rising same-day delivery expectations | +1.5% | Jakarta, Bangkok, Manila, Kuala Lumpur, Ho Chi Minh City | Short term (≤ 2 years) |
| Government incentives for logistics tech | +0.7% | Singapore, Malaysia, Thailand leading; Indonesia following | Medium term (2-4 years) |
| Social-commerce-driven micro-shipments | +1.2% | Indonesia, Philippines, Vietnam | Short term (≤ 2 years) |
| Source: Mordor Intelligence | |||


E-Commerce Penetration Surge Post-Pandemic
Sustained double-digit growth in online retail outside capital cities is boosting parcel density and narrowing last-mile unit costs. Indonesia’s Ministry of Communication and Informatics reports that tier-2 and tier-3 conurbations are now responsible for more than one-third of national e-commerce orders, forcing couriers to extend network coverage beyond Java. Vietnam simplified import procedures for packages valued under USD 200 in 2024, cutting clearance times to 48 hours and releasing new international express capacity. The Philippines integrated regional marketplaces with rural sellers through Department of Trade and Industry programs that raised inter-island parcel flows. Thailand’s Ministry of Digital Economy and Society attributed over 30% of 2024 online sales to social-commerce channels, a phenomenon that requires flexible pickup windows and technology-enabled sorting. Together these developments are lifting average daily parcels well above pre-pandemic levels across ASEAN courier express parcel market hubs[1]“EU Helps Set Up Online Customs Transit System to Spur ASEAN Trade,” PNA, pna.gov.ph.
ASEAN Cross-Border Digital Trade Pacts (e.g., DEPA)
Operational since 2024, the Digital Economy Partnership Agreement harmonizes electronic documentation and signatures, trimming average border processing by 24 hours for express consignments. Singapore Customs’ electronic Form D exchange via the ASEAN Single Window eliminates manual certificate handling and accelerates origin verification. Central-bank-backed Regional Payment Connectivity links eight real-time payment rails, easing COD reconciliations for couriers. Bilateral QR code interoperability between Bank Negara Malaysia and the Bank of Thailand further reduces cross-border transaction friction. These pacts reward operators capable of scaling compliance investments across several countries, thereby reinforcing competitive advantages for regional networks inside the ASEAN courier express parcel market[2]“Digital Economy Partnership Agreement,” Enterprise Singapore, enterprisesg.gov.sg.
Regional Infrastructure Upgrades (ASEAN Highway and Ports)
Completion of Bangkok–Kuala Lumpur highway enhancements in 2024 cut door-to-door trucking times by 18%, enabling overnight ground express services that once required airlift. Hai Phong and Ho Chi Minh deep-water terminals added 40% container capacity, encouraging couriers to funnel consolidated exports through gateway ports instead of passenger airports. Indonesia’s Trans-Java toll-way expansion trimmed ground transport costs by 25% for shipments headed to secondary cities. Laos-China railway operations opened a north-south land bridge, supporting time-sensitive consignments between Guangxi and Bangkok. Improved multimodal links let courier fleets substitute lower-cost road and rail routes for intra-ASEAN airfreight without compromising service reliability in the ASEAN courier express parcel market.
Rising Same-Day Delivery Expectations in Urban Centres
Congested megacities are giving rise to micro-fulfillment centers, motorcycle fleets, and parcel-locker networks that collectively shave delivery windows to 2-4 hours. Jakarta’s traffic ordinance spurred two-hour services reliant on app-based routing for motorbike couriers. Bangkok’s elevated-train locker network bypasses gridlock and ensures predictable handovers during peak hours. Manila’s barangay-level depots shrink last-mile distances, and Ho Chi Minh City’s digital addressing project lifted first-attempt success to 89%. Capital expenditure on advanced route optimization, GPS telemetry, and customer-notification platforms is becoming non-negotiable for any operator seeking premium urban business within the ASEAN courier express parcel market.
Restraints Impact Analysis*
| Restraint | (~) % Impact on CAGR Forecast | Geographic Relevance | Impact Timeline |
|---|---|---|---|
| Fragmented customs regimes and documentation | -1.8% | Cambodia, Laos, Myanmar; spillover across regional corridors | Medium term (2-4 years) |
| Under-developed last-mile infrastructure | -1.2% | Indonesian and Philippine islands; rural Thailand, Vietnam | Long term (≥ 4 years) |
| Talent shortages for skilled logistics roles | -0.9% | Singapore, Malaysia, Thailand urban centers | Short term (≤ 2 years) |
| High fuel-price volatility | -1.1% | Indonesia, Philippines, Thailand | Medium term (2-4 years) |
| Source: Mordor Intelligence | |||
Fragmented Customs Regimes and Document Inefficiencies
Cambodia still mandates physical verification for parcels over USD 100, adding 15% handling overheads. Limited Myanmar participation in ACTS necessitates multiple border clearances, undermining single-declaration efficiencies. The Philippines’ 2024 security documentation prolonged express clearance by up to two days. Manual quarantine checks in Indonesia can stretch to 14 days. Disparate rules oblige courier firms to retain country-specific compliance teams, diluting economies of scale inside the ASEAN courier express parcel market[3]“Electronic Exchange of Form D via the ASW,” Singapore Customs, singaporecustoms.gov.sg.
Under-Developed Last-Mile Infrastructure in Rural Islands
Outer Indonesian islands account for 60% of landmass yet only 15% of parcel volume, forcing per-shipment costs up to five times Java levels. The Philippines’ 7,641-island geography extends standard deliveries to 10 days in remote provinces. Seasonal flooding in Thailand’s south and Vietnam’s Mekong Delta compels couriers to maintain backup routes. Limited returns constrain private investment, leaving gaps that public infrastructure programs have yet to address[4]“ASEAN Customs Transit System Roll-Out,” DigitalizeTrade, digitalizetrade.org.
*Our forecasts treat driver/restraint impacts as directional, not additive. The impact forecasts reflect baseline growth, mix effects, and variable interactions.
Segment Analysis
By End User Industry: Healthcare Emerges as Premium Segment
E-commerce generated 35.30% of revenue share in 2025, reflecting consumer adoption of omnichannel retail. Healthcare parcels exhibit a 7.22% CAGR outlook between 2026-2031, catalyzed by telemedicine, specialty pharmaceuticals, and clinical trials requiring temperature-controlled chain-of-custody. DHL pledged EUR 500 million (USD 551.82 million) for GDP-certified sites across Singapore and Malaysia to capture this growth.
Manufacturing and BFSI continue to demand secure, time-critical deliveries. Wholesale and retail rely on scheduled replenishment, emphasizing reliability over speed. Future growth pockets include medical-device home deliveries and cold-chain biologics, where strict quality standards and validated packaging create defensible margins for specialized service providers within the ASEAN courier express parcel market.


By Destination: Cross-Border Momentum Builds
International consignments booked a 7.05% CAGR outlook between 2026-2031, even though domestic parcels retained 63.70% of the ASEAN courier express parcel market share in 2025. Full ACTS rollout across six member states cut clearance times by 30%, aligning international transit pricing more closely with domestic benchmarks and expanding the ASEAN courier express parcel market size for cross-border operators. Overnight ground services on the Malaysia–Thailand–Singapore corridor illustrate how regulatory harmonization and highway upgrades unlock new premium offerings. Vietnam’s surge in outbound manufacturing parcels and Indonesia’s middle-class appetite for imported goods underpin resilient international volume growth. Looking ahead, deeper participation in DEPA and wider adoption of electronic origin certificates will further narrow the cost-to-serve gap between domestic and international movements in the ASEAN courier express parcel market.
Domestic traffic still anchors network utilization, allowing carriers to optimize asset turns on inner-city and regional legs. Parcel density across Java and Sumatra supports low unit costs, while local road upgrades improve service levels in Thailand’s eastern corridor. Nonetheless, slow customs alignment in Cambodia and Laos tempers cross-border scalability. Carriers that integrate single-window clearance APIs and dynamic duty calculators will seize the incremental trade opportunities emerging along lesser-served borders.
By Speed of Delivery: Express Services Gain Premium
Express products are projected to outpace the broader ASEAN courier express parcel market at a 7.62% CAGR between 2026-2031 while non-express services continue to dominate volumes with 70.10% share in 2025. Urban millennials value guaranteed delivery windows, driving willingness to pay premiums for two- to four-hour fulfillment on fashion, electronics, and grocery orders. Ground express between Bangkok and Kuala Lumpur demonstrates how improved corridors can rival airfreight on both speed and cost.
Network-wide investments in automated dispatching, AI-enabled route planning, and real-time status alerts underpin express scalability. Micro-fulfillment centers in Manila and parcel lockers along Bangkok’s Skytrain reduce last-mile legs, boosting utilization rates. Non-express services remain essential for bulk e-commerce and B2B replenishment cycles. However, continuous cross-border payment integration will slowly raise express demand as micro-business exporters seek predictable lead times.
By Shipment Weight: Light Parcels Drive Volume Growth
Light weight parcels represented 67.55% of 2025 shipments, anchoring the ASEAN courier express parcel market size through favorable vehicle fill rates. Smart-phone accessories, apparel, and personal-care items dominate this weight band, allowing operators to load higher parcel counts per trip and amortize fixed route costs. Heavy weight parcels—including furniture and industrial spares—are set for a 5.32% CAGR between 2026-2031 on rising B2B e-commerce.
While automated sorters handle light items efficiently, heavy parcels necessitate forklift-equipped depots and multi-person handling, elevating cost per ship-unit. Vietnam’s electronics export boom brings in heavy inbound raw materials and heavy outbound finished goods, requiring carriers to balance load mixes for fleet utilization. Regulatory differences between postal and freight regimes add documentation layers for oversized items, underscoring the need for unified cross-functional compliance teams.

By Model: Social Commerce Reshapes B2C Dynamics
B2C shipments controlled 56.10% of revenue in 2025, buoyed by platform marketplaces, but C2C is expanding at 4.05% CAGR between 2026-2031 on social-commerce adoption. Sellers on Instagram Live or TikTok Shop require on-demand pickups and bite-sized pricing models. In Indonesia, where 78% of netizens engage in social commerce, parcel volumes spike during flash-sale live streams.
Large platforms negotiate fleet capacity well ahead of promotional events, but C2C parcels often arrive ad-hoc, straining sortation during peak hours. Success in this sub-segment hinges on intuitive shipping apps, flexible cutoff times, and transparent tracking. B2B volumes, though smaller, deliver higher yields per stop, especially for regulated items like pharmaceuticals, suggesting that multi-segment positioning offers risk diversification in the ASEAN courier express parcel market.
By Mode of Transport: Road Networks Expand Reach
Road captured 60.25% of parcel revenue in 2025, leveraging trans-ASEAN highway improvements that cut journey times and enhance reliability. The ASEAN courier express parcel market size for ground transport benefited from the Trans-Java toll-way and Bangkok–Kuala Lumpur corridor upgrades. Air volumes, though smaller, are growing at a 5.72% CAGR between 2026-2031 because of cross-border express and same-day city pairs.
Fleet telematics and dynamic routing shorten trip lengths and reduce fuel burn on road lanes. Air remains indispensable for archipelagic routes where surface links are absent or weather-sensitive. Rail and maritime comprise niche legs—for example, the Laos-China rail corridor serves heavy exports—yet require multimodal IT for full visibility. Operators with integrated transport management systems can allocate shipments by cost-to-serve, maximizing gross margin.
Geography Analysis
Indonesia’s vast archipelago creates density advantages on Java and Sumatra but raises per-parcel costs in outer islands, where specialized air-sea routings can multiply logistics expenses threefold. The country controlled 46.40% of 2025 revenue. Completion of the Trans-Java expressway shortened transfer times to Jakarta hubs by up to 25% and enabled broader coverage of tier-2 industrial clusters. Despite scale benefits, thin margins remain vulnerable to diesel price swings and seasonal ferry disruptions that compel operators to retain costly buffer capacity for time-critical consignments.
Vietnam’s 7.42% CAGR between 2026-2031 trajectory is underpinned by streamlined customs for low-value parcels and high adoption of digital addresses in Ho Chi Minh City. Proximity to China enables same-day trucking of high-value electronics components, while new port capacity in Hai Phong positions northern Vietnam as a maritime gateway for intra-ASEAN commerce. Government investment in cross-border highways with Laos and Cambodia further integrates the Mekong sub-region, diversifying trade lanes and stimulating parcel flows.
Thailand, Malaysia, and Singapore benefit from contiguous geography, harmonized documentation, and 24-hour border processing, which together facilitate overnight surface services. The Bangkok–Kuala Lumpur corridor leverages upgraded roads to compete with airfares on price-sensitive lanes. Singapore functions as a transshipment nucleus, handling volumes that exceed local consumption and reinforcing its pivotal role in the ASEAN courier express parcel market. The Philippines and Rest-of-ASEAN markets remain dependent on multimodal innovation and customs digitization to unlock latent demand.
Competitive Landscape
Moderate consolidation persists across the ASEAN courier express parcel market, with regional leaders, postal incumbents, and tech-enabled challengers vying for network density. J&T Express moved over 5 billion parcels in 2024, leveraging automated mega-sort centers to reach a significant regional share. Incumbent global integrators DHL, FedEx, and UPS focus on premium cross-border and healthcare niches, investing heavily in GDP-certified warehouses and AI route engines that raise average revenue per parcel.
Local champions such as Thailand Post and Pos Indonesia defend share through state-backed network reach but face modernization imperatives. Technology remains a primary differentiator: predictive analytics, IoT-enabled fleet telematics, and cloud-native customer portals enable real-time visibility and proactive exception management. Start-ups specializing in same-day urban delivery and social-commerce fulfillment are scaling via asset-light partnerships, though high cash-burn rates may prompt consolidation.
ACTS compliance and electronic Form D connectivity reward multinational players that can amortize systems integration over large transaction bases. Healthcare logistics, last-mile locker platforms, and cold-chain services represent high-barrier niches where early movers can lock in advantageous margins. Nevertheless, volatility in fuel and labor costs underscores the need for continuous route optimization and pricing agility across all operator tiers.
ASEAN Courier, Express, And Parcel (CEP) Industry Leaders
DHL Group
J&T Express
SF Express (KEX-SF)
Pos Malaysia Berhad
Ninja Van
- *Disclaimer: Major Players sorted in no particular order

Recent Industry Developments
- April 2025: DHL Group pledged EUR 500 million (USD 551.82 million) for Asia-Pacific healthcare logistics facilities, including GDP-certified sites in Singapore and Malaysia.
- December 2024: FedEx completed ASEAN network realignment, consolidating secondary-city operations while adding premium express lanes in primary metros.
- November 2024: UPS deepened last-mile collaboration with Ninja Van in Malaysia to blend international express reach with domestic delivery density.
- October 2024: Thailand Post launched automated sortation and full-journey tracking to enhance competitiveness against private couriers.


ASEAN Courier, Express, And Parcel (CEP) Market Report Scope
Domestic, International are covered as segments by Destination. Express, Non-Express are covered as segments by Speed Of Delivery. Business-to-Business (B2B), Business-to-Consumer (B2C), Consumer-to-Consumer (C2C) are covered as segments by Model. Heavy Weight Shipments, Light Weight Shipments, Medium Weight Shipments are covered as segments by Shipment Weight. Air, Road, Others are covered as segments by Mode Of Transport. E-Commerce, Financial Services (BFSI), Healthcare, Manufacturing, Primary Industry, Wholesale and Retail Trade (Offline), Others are covered as segments by End User Industry. Indonesia, Malaysia, Philippines, Thailand, Vietnam are covered as segments by Country.| Domestic |
| International |
| Express |
| Non-Express |
| Business-to-Business (B2B) |
| Business-to-Consumer (B2C) |
| Consumer-to-Consumer (C2C) |
| Heavy Weight Shipments |
| Light Weight Shipments |
| Medium Weight Shipments |
| Air |
| Road |
| Others |
| E-Commerce |
| Financial Services (BFSI) |
| Healthcare |
| Manufacturing |
| Primary Industry |
| Wholesale and Retail Trade (Offline) |
| Others |
| Indonesia |
| Malaysia |
| Philippines |
| Thailand |
| Vietnam |
| Rest of ASEAN |
| Destination | Domestic |
| International | |
| Speed of Delivery | Express |
| Non-Express | |
| Model | Business-to-Business (B2B) |
| Business-to-Consumer (B2C) | |
| Consumer-to-Consumer (C2C) | |
| Shipment Weight | Heavy Weight Shipments |
| Light Weight Shipments | |
| Medium Weight Shipments | |
| Mode of Transport | Air |
| Road | |
| Others | |
| End User Industry | E-Commerce |
| Financial Services (BFSI) | |
| Healthcare | |
| Manufacturing | |
| Primary Industry | |
| Wholesale and Retail Trade (Offline) | |
| Others | |
| Country | Indonesia |
| Malaysia | |
| Philippines | |
| Thailand | |
| Vietnam | |
| Rest of ASEAN |


Market Definition
- Courier, Express, and Parcel - The Courier, Express, and Parcel services, often called as CEP Market, refers to the logistics and postal service providers which specialize in moving small goods (parcels/packages). It captures the overall market size (USD) and market volume (number of parcels) of (1) the shipments/parcels/packages which are under 70kgs/ 154lbs weight, (2) Business Customer packages viz. Business-to-Business (B2B) & Business-to-Consumer (B2C) as well as private customer packages (C2C), (3) non-express parcel delivery services (Standard and Deferred) as well as express parcel delivery services (Day-Definite-Express and Time-Definite-Express), (4) domestic as well as international shipments.
- Demographics - To analyse total addressable market demand, population growth & forecasts have been studied and presented in this industry trend. It represents population distribution across categories like gender (male/female), development area (urban/rural), major cities among other key parameters like population density and final consumption expenditure (growth and share % of GDP). This data has been used for assessing the fluctations in demand & consumption expenditure, and the major hotspots (cities) of potential demand.
- Domestic Courier Market - Domestic Courier Market refers to the CEP shipments wherein the origin and destination is within the boundary of the geography studied (country or region as per the scope of report). It captures the market size (USD) and market volume (number of parcels) of (1) the shipments/parcels/packages which are under 70kgs/ 154lbs weight, including light weight shipments, medium weight shipments and heavy weight shipments (2) Business Customer packages viz. Business-to-Business (B2B) & Business-to-Consumer (B2C) as well as private customer packages (C2C), (3) non-express parcel delivery services (Standard and Deferred) as well as express parcel delivery services (Day-Definite-Express and Time-Definite-Express).
- E-Commerce - This end user industry segment captures the external (outsourced) logistics expenditure incurred by the e-tailers, through online sales channel, on Courier, Express, and Parcel (CEP) services. The scope includes (i) the supply chain of a company's online customer orders being fulfilled, (ii) the process of getting a product from the point of manufacturing to the point at which it is delivered to consumers. It involves managing inventory (deferred as well as time critical), shipping, and distribution.
- Export Trends and Import Trends - Overall logistics performance of an economy is positively and significantly (statistically) correlated to its trade performance (exports and imports). Hence, in this industry trend, total value of trade, major commodities/ commodity groups and the major trade partners, for the studied geography (country or region as per the scope of report) have been analysed alongside the impact of major trade/logistics infrastructure investments & regulatory environment.
- Financial Services (BFSI) - This end user industry segment captures the external (outsourced) logistics expenditure incurred by the BFSI players, on Courier, Express, and Parcel (CEP) services. CEP is important to the financial services industry in shipping of confidential documents and files. The establishments in this sector are engaged in (i) financial transactions (that is, transactions involving the creation, liquidation, or change in ownership of financial assets) or in facilitating financial transactions, (ii) financial intermediation, (iii) the pooling of risk by underwriting annuities and insurance, (iv) providing specialized services that facilitate or support financial intermediation, insurance and employee benefit programs, and (v) monetary control - the monetary authorities.
- Fuel Price - Fuel price spikes can cause delays and diruption for logistics service providers (LSPs), while drops in the same can result in higher short-term profitability and increased market rivalry to offer consumers with the best deals. Hence, the fuel price variations have been studied over the review period and presented along with the causes as well as market impacts.
- GDP Distribution by Economic Activity - Nominal Gross Domestic Product and distribution of the same, across major economic sectors in the geography studied (country or region as per scope of the report) have been studied and presented in this industry trend. As GDP is positively related to the profitability and growth of logistics industry, this data has been used in adjunction to the input-output tables/ supply-use tables for analyzing the potential major contributing sectors towards the logistics demand.
- GDP Growth by Economic Activity - Growth of Nominal Gross Domestic Product across major economic sectors, for the geography studied (country or region as per scope of the report) have been presented in this industry trend. This data has been utilized for assessing the growth of logistics demand from all the market end users (economic sectors considered here).
- Healthcare - This end user industry segment captures the external (outsourced) logistics expenditure incurred by the Healthcare players (Hospitals, clinics, mrdical centres) , on Courier, Express, and Parcel (CEP) services. The scope includes CEP services involved in the defrerred as well time critical movement of medical goods & supplies (surgical supplies and instruments, including gloves, masks, syringes, equipment). The establishments in this sector (i) include the ones providing medical care exclusively (ii) deliver services by trained professionals (iii) involve processes, including labor inputs of health practitioners with the requisite expertise (iv) are defined based on the educational degree held by the practitioners included in the industry.
- Inflation - Variations in both Wholesale Price Inflation (YoY change in producer price index) and Consumer Price Inflation have been presented in this industry trend. This data has been used to assess the inflationary environment as it plays a vital role in smooth functioning of the supply chain, directly impacting the logistics operational cost components e.g., pricing of tyres, driver wages & benefits, energy/fuel prices, maintenace costs, toll charges, warehousing rents, custom brokerage, forwarding rates, courier rates etc. hence impacting the overall freight and logistics market.
- Infrastructure - As infrastructure plays a vital role in an economy's logistics performance, variables like length of roads, distribution of road length by surface category (paved v/s unpaved), distribution of road length by road classification (expressways v/s highways v/s other roads), rail length, volume of containers handled by major ports and tonnage handled by major airports have been analysed and presented in this industry trend.
- International Express Service Market - International Express Service Market refers to the CEP shipments wherein the origin or destination is not within the boundary of the geography studied (country or region as per the scope of report). It captures the market size (USD) and market volume (number of parcels) of (1) the shipments/parcels/packages which are under 70kgs/ 154lbs weight, including light weight shipments, medium weight shipments and heavy weight shipments (ii) Inter-Region as well as Intra-Region Shipments
- Key Industry Trends - The report section named "Key Industry Trends" include all the key variables/parameters studied to better analyze the market size estimates and forecasts. All the trends have been presented in the form of data points (time series or latest available data points) along with analysis of the paramter in the form of concise market relevant commentary, for the geography studied (country or region as per the scope of report).
- Key Strategic Moves - The action taken by a company to differentiate from its competitor or used as a general strategy is referred to as a key strategic move (KSM). This includes (1) Agreements (2) Expansions (3) Financial Restructuring (4) Mergers and Acquisitions (5) Partnerships, and (6) Product Innovations. Key players (Logistics Service Providers, LSPs) in the market have been shortlisted, their KSM have been studied and presented in this section.
- Logistics Performance - Logistics Performance and Logistics Costs are the backbone of trade, and influences trade costs, making countries compete globally. Logistics performance is influenced by market wide adopted supply chain management strategies, government services, investments & policies, fuel/ energy costs, inflationary environment etc. Hence, in this industry trend, the logistics performance of the geography studied (country/ region as per the scope of report) has been analysed and presented over the review period.
- Manufacturing - This end user industry segment captures the external (outsourced) logistics expenditure incurred by the Manufacturing industry (including Hi-Tech/Technology) players, on Courier, Express, and Parcel (CEP) services. The end user players considered are the establishments primarily engaged in the chemical, mechanical or physical transformation of materials or substances into new products. Logistics Service Providers (LSPs) play a crucial role in maintaining a smooth flow of raw materials across the supply chain, enabling timely delivery of finished goods to distributors or end customers and storing & supplying the raw materials to clients for just-in-time manufacturing.
- Other End Users - Other end user segment captures the external (outsourced) logistics expenditure incurred by the construction, real estate, educational services, and professional services (administrative, waste management, legal, architectural, engineering, design, consulting, scientific R&D), on Courier, Express, and Parcel (CEP) services. Logistics Service Providers (LSPs) plays a crucial role in the reliable movement of time critical supplies and documents to/from these industries such as transporting any equipment or resources required, shipping confidential documents and files.
- Primary Industry - This end user industry segment captures the external (outsourced) logistics expenditure incurred by the AFF (Agriculture, Fishing, and Forestry) and Extraction indsutry (Oil &Gas, Quarrying and Mining) players, on Courier, Express, and Parcel (CEP) services. The end user players considered are the establishments (i) primarily engaged in growing crops, raising animals, harvesting timber, harvesting fish & other animals from their natural habitats and providing related support activities; (ii) that extract naturally occurring mineral solids, such as coal and ores; liquid minerals, such as crude petroleum; and gases, such as natural gas. Herein, Logistics Service Providers (LSPs) (i) play a crucial role in acquisition, storage, handling, transportation, and distribution activities for the optimal & continuous flow of inputs (seeds, pesticides, fertilizers, equipment, and water) from manufacturers or suppliers to the producers and smooth flow of output (produce, agro-goods) to distributors/ consumers; (ii) cover entire phases from upstream to downstream and play a crucial role in the transportation of machinery, drilling equipments, extracted minerals, crude oil & natural gas and refined/ processed products from one place to another. This includes both termperature controlled and non-temperature controlled logistics, as and when required according to the shelf life of goods being transported or stored.
- Producer Price Inflation - It indicates inflation from viewpoint of the producers viz. the average selling price received for their output over a period of time. Annual change (YoY) of producer price index is reported as wholesale price inflation in the "Inflation" industry trend. As WPI captures dynamic price movements in most comprehensive way, it is widely used by governments, banks, industry, business circles and is deemed important in formulation of trade, fiscal and other economic policies. The data has been used in adjunction to consumer price inflation for better understanding the inflationary environment.
- REPORT TITLES - Philippines Courier, Express, and Parcel (CEP) Market
- Segmental Revenue - Segmental Revenue has been triangulated or computed and presented for all the major players in the market. It refers to the courier, express, and parcel (CEP) market specific revenue earned by the company, over the base year of study, in the geography studied (country or region as per the scope of report). It is computed through the study and analysis of major parameters like financials, service portfolio, employee strength, fleet size, investments, number of countries present in, major economies of concern, etc. that have been reported by the company in its annual reports, webpage. For companies having scarce financial disclosures, paid databases like D&B Hoovers, Dow Jones Factiva have been resorted to and verified through industry/expert interactions.
- Transport and Storage Sector GDP - Value and growth of Transport and Storage Sector GDP has a direct relation to the freight and logistics market size. Hence, this variable has been studied and presented over the review period, in value terms (USD) and as share % of total GDP, in this industry trend. The data has been supported by concise and relevant commentary around the investments, developments, and current market scenario.
- Trends in E-Commerce Industry - Enhanced internet connectivity and boom in smartphone penetration, coupled with increasing disposable incomes, has led to a phenomenal growth in the e-commerce market globally. Online shoppers require fast and efficient delivery of their orders leading to an increase in the demand for logistics services especially e-commerce fulfilment services. Hence, the Gross Merchandise Value (GMV), historial and projected growth, breakup of major commodity groups in e-commerce industry for the studied geography (country or region as per scope of the report) have been analysed and presented in this industry trend.
- Trends in Manufacturing Industry - Manufacturing industry involves the transformation of raw materials into finished products, while logistics industry ensures the efficient flow of raw materials to the factory, and the transport of manufactured products to the distributors & consumers. Demand-Supply of both industries are highly cross-linked and critical for a seamless supply chain. Hence, the Gross Value Added (GVA), breakup of GVA into major manufacturing sectors, and growth of manufacturing industry over the review period have been analysed and presented, in this industry trend.
- Wholesale and Retail Trade (Offline) - This end user industry segment captures the external (outsourced) logistics expenditure incurred by the wholesalers and retailers, through offline sales channel, on Courier, Express, and Parcel (CEP) services. The end user players considered are the establishments primarily engaged in wholesaling or retailing merchandise, generally without transformation, and rendering services incidental to the sale of merchandise. Logistics Service Providers (LSPs) plays a crucial role in the reliable movement of supplies to and finished products from production houses to the distributors and finally to the end customer covering activites like material sourcing, transportation, order fulfillment, warehousing & storage, demand forecasting, inventory management etc.
- TITLES - Europe Domestic Courier Market
| Keyword | Definition |
|---|---|
| Axle Load | The axle load refers to the total load (weight) bearing on the roadway through wheels connected to a given axle. Across the globe, there are systems in place to ensure axle load monitoring, wherein surpassing the defined limits set by the concerned regulatory authority can lead to penalty/fine. For transportation of goods via road this can be an important determinant of costs as knowledge about the axle load limits can be used to (i) load the vehicle optimally for maximizing profits (ii) avoid exceeding the same and hence the probable fines associated (iii) avoid wear and tear of the vehicle (iv) avoid damage to pavement resulting in noticeable public maintenance and repair costs (v) achieve better turnaround time. |
| Back Haul | Backhaul is the return movement of a transport vehicle from its original destination to its original point of departure, and can include full, partial, or empty truck loads (all or part of the way) depending on the visibility of the local freight ecosystem. In this regard, transportation of empty containers to the point of origin, known as deadheading is also a significant factor, considering the supply/container shortages across the geographies, resulting in cost escalation and under optimized profit potential attainment. Generally, the carriers offer discounts on the backhaul, to secure freight for the trip. |
| Bill of Lading (BOL) | A bill of lading is a legal contract document issued by a carrier to a shipper to acknowledge reception of their cargo, and is evidence for the contract of carriage between the two parties. Broadly it details the (i) type, quantity, and other specifications of the goods being carried (ii) destination, and terms & conditions of the shipment (iii) carrier and drivers with all the necessary information to process the shipment, which can be used for insurance and customs clearance purposes (iv) assurance that the consignment is damage-free and ready to be shipped to the consignee. In this regard, a house bill of lading (HBL) is a document issued by a freight forwarder or a non-vessel operating common carrier (NVOCC) to acknowledge receipt of items for shipment (to a shipper). If shipments from several shippers are involved a master bill of lading (MBL) might be involved which is a consolidated version of the same for all the shipments being taken care of by the carrier (to a common destination) and might be issued by the carrier to the freight forwarder or the shipper (depending on who books the transport). |
| Bunkering | Bunkering is the process of supplying fuel to power the propulsion system of a ship. It includes the logistics of loading and distributing the fuel among available shipboard tanks. In this regard, (i) Bunker fuel is technically any type of fuel oil used aboard ships. It gets its name from the containers on ships and in ports that it is stored in; in the days of steam they were coal bunkers but now they are bunker-fuel tanks, (ii) Bunker refers to the spaces (Tank) on board a vessel to store fuel, (iii) Bunker trader refers to a person dealing in trade of bunker (fuel), (iv) Bunker call is made when a cargo ship anchors or berths in a port to take on bunker oil or supplies, (v) Bunkering service is the supply of a requested quality and quantity of bunkers to a ship. Bunkering is signficant from point of view of freight rates applicable to the shipper as Bunker Contribution (BUC)/ Fuel Adjustment Factor (FAF)/ Bunker Adjustment Factor (BAF) are applied by shipping lines to offset the effect of fluctuations in the cost of bunkers. |
| Cabotage | Transport by a vehicle registered in a country, performed on the national territory of another country. Cabotage law may restrict domestic cargo traffic to be carried in its own nationally registered, and sometimes built and crewed vehicles, though regulations vary across industries/commodity groups/countries and sometimes specify maximum allowable percentage of cabotage that can be serviced by foreign registered fleet. |
| C-commerce | Collaborative commerce (also known as C-commerce), (i) describes electronically enabled business interactions among an enterprise’s internal personnel, business partners and customers throughout a trading community (industry, industry segment, supply chain or supply chain segment); (ii) is the optimization of supply and distribution channels to capitalize on the global economy by using new technology efficiently. Advantages of C-commerce, to detail few include (i) maximization of organization's efficiency and profitability (ii) technology integration with physical channels to allow companies to work together (iii) increased information exchange such as inventory and product specifications, using the web as an intermediary (iv) increased competitiveness by reaching a broader audience. Examples of C-commerce, also known as peer-to-peer commerce, include (i) companies that allow consumers to rent things from each other, or marketplaces, such as Meta (formerly Facebook) Marketplace, that allow the sale of used goods; (ii) DoorDash teamed up with many national brands, such as McDonald’s and Chipotle, to offer fast food delivery, building their business model on c-commerce. They have since expanded their delivery service from restaurants to retailers and even offer 'fleets' of drivers to businesses. |
| Courier | A business/company that delivers packages/parcels/shipments (upto 70 kgs) including quick door to door pickup and delivery service for goods or documents, domestically or internationally, on a commercial contract basis. Example, DHL Group, FedEx, United Parcel Service of America, Inc., USPS, International Distributions Services, J&T Express, SF Express among several others |
| Cross docking | Cross docking is a practice in logistics management that includes unloading incoming delivery vehicles and loading the materials directly into outbound delivery vehicles, omitting traditional warehouse logistical practices and saving time and money. It requires close synchronization of both inbound and outbound movements. It is highly significant in reduction of costs pertaining to warehousing & storage (and the associated Value Added Services). |
| Cross Trade | International transport between two different countries performed by a vehicle registered in a third country. A third country is a country other than the country of loading/embarkation and the country of unloading/disembarkation. Cross Trade law may restrict international cargo traffic to be carried by respective country's registered vehicles, and sometimes built and crewed vehicles, though regulations vary across industries/commodity groups/countries and sometimes specify maximum allowable percentage of cross trade that can be serviced by foreign registered fleet. |
| Customs Clearance | The process of declaring and clearing cargoes through customs. It includes the procedures involved in getting cargo released by Customs through designated formalities such as presenting import license/permit, payment of import duties and other required documentations by the nature of the cargo. In this regard, a customs broker is a person or company licensed by the respective department of the country to act on behalf of freight importers and exporters. |
| Dangerous Goods | Dangerous goods (or hazardous materials or HAZMAT) include flammable liquids/solids, gases (compressed, liquified, dissolved under pressure), corrosives, oxidising substances, explosive substances and articles, substances which on contact with water emit flammable gasses, organic peroxides, toxic substances, infectious substances, radioactive materials, miscellaneous dangerous goods and articles. |
| First mile Delivery | First mile delivery refers to the (i) first stage of the freight/shipment/cargo/courier transportation (ii) the transportation of goods from a merchant’s premises or warehouse to the next fulfillment centre/warehouse/hub from where the goods are forwarded (iii) shipping goods from local distribution centers to stores (For retailers) (iv) transportation of finished goods from a plant or a factory to a distribution center (For manufacturers), (v) pick up of goods from the end-customer’s home or store followed by movement to a warehouse or storage location (movers and packers), (vi) process where goods are picked up from a retailer and then transferred to third-party logistics providers or courier service providers to be delivered to the end-consumer (e-commerce). Once the package reaches the next warehouse or the courier’s hub, it is then sorted and transported further until it reaches the customer’s doorstep. Example, if one chooses UPS as a courier, first-mile delivery will be the product being delivered from manufacturer's/retailer's warehouse to the UPS’s warehouse/ fulfilment centre. |
| Last Mile Delivery | Last mile delivery refers to the very last step of the delivery process when a parcel is moved from a transportation hub (warehouse or a distribution center or fulfillment centre) to its final destination, which usually is a personal residence/retail store/ business, or parcel locker. It accounts for around half of the total cost involved in entire process of first mile, middle mile, and last mile delivery, though it can vary shipment to shipment, based on commodity, business model and similar factors. |
| Milkrun | A Milk Run is a delivery method used to transport mixed loads from various suppliers to one customer, using lean management principles applied to logistics. Instead of each supplier sending a truck every week to meet the needs of one customer, one truck (or vehicle) visits the suppliers to pick up the loads for that customer. This method of transport got its name from the dairy industry practice, where one tanker used to collect milk from several dairy farms for delivery to a milk processing company. A milk run can be a more efficient way to handle logistics but require proper planning. If the route involves products from different companies, there is need for an agreement about cost-sharing and other aspects of the cooperative delivery arrangement. Once the group settles these issues, this delivery method can save time and money for everyone by pooling operation costs and resources. |
| Multi country consolidation | Multi-Country Consolidation (MCC) is a cost-effective solution that consolidates one's cargo from different countries of origin to build Full Container Loads (FCL). MCC is most suitable for companies that import light volumes of goods from multiple countries but want to take advantage of the more economic FCL freight rates. Apart from costing some of the other advantages include (i) flexibility to choose suppliers from a wider range of origin countries without worrying about the logistics to final destination from each origin, (ii) ability to pick the most suitable suppliers from many different countries for one's business operations. The increase in one's sourcing options by MCC provides the kind of flexibility needed in competitive global markets. |
| Q-commerce | Q-commerce, also referred to as quick commerce, is a type of e-commerce where emphasis is on quick deliveries, typically in less than an hour. The companies providing Q-Commerce services might have vertically intergrated model or might be using third party delivery platforms (outsourced logistics). It has advantages like (i) competitve USP, (ii) potential to earn greater profit margins, (iii) better customer experience, (iv) guaranteed availability of products, (v) traceability, and (vi) scaleability. |
| ReverseLogistics | Reverse logistics is a type of supply chain management that moves goods from customers back to the sellers or manufacturers and may involve ciruclar economy principles (3Rs) viz. recycling, reuse (repurposing, reselling), reducing or repairing. In this regard, reverse commerce (or Recommerce) is the selling of previously owned items through physical or online marketplaces/distribution channels to buyers who reuse, recycle or resell them. |


Research Methodology
Mordor Intelligence follows a four-step methodology in all our reports.
- Step-1: Identify Key Variables: In order to build a robust forecasting methodology, the variables and factors identified in Step-1 are tested against available historical market numbers. Through an iterative process, the variables required for market forecast are set and the model is built on the basis of these variables.
- Step-2: Build a Market Model: Market-size estimations for the forecast years are in nominal terms. Inflation is considered to be a part of the pricing, and the average selling price (ASP) is varying throughout the forecast period for each country
- Step-3: Validate and Finalize: In this important step, all market numbers, variables and analyst calls are validated through an extensive network of primary research experts from the market studied. The respondents are selected across levels and functions to generate a holistic picture of the market studied.
- Step-4: Research Outputs: Syndicated Reports, Custom Consulting Assignments, Databases & Subscription Platforms


