Nigeria Courier, Express, And Parcel (CEP) Market Size and Share
Market Overview
| Study Period | 2018 - 2031 |
|---|---|
| Forecast Data Period | 2026 - 2031 |
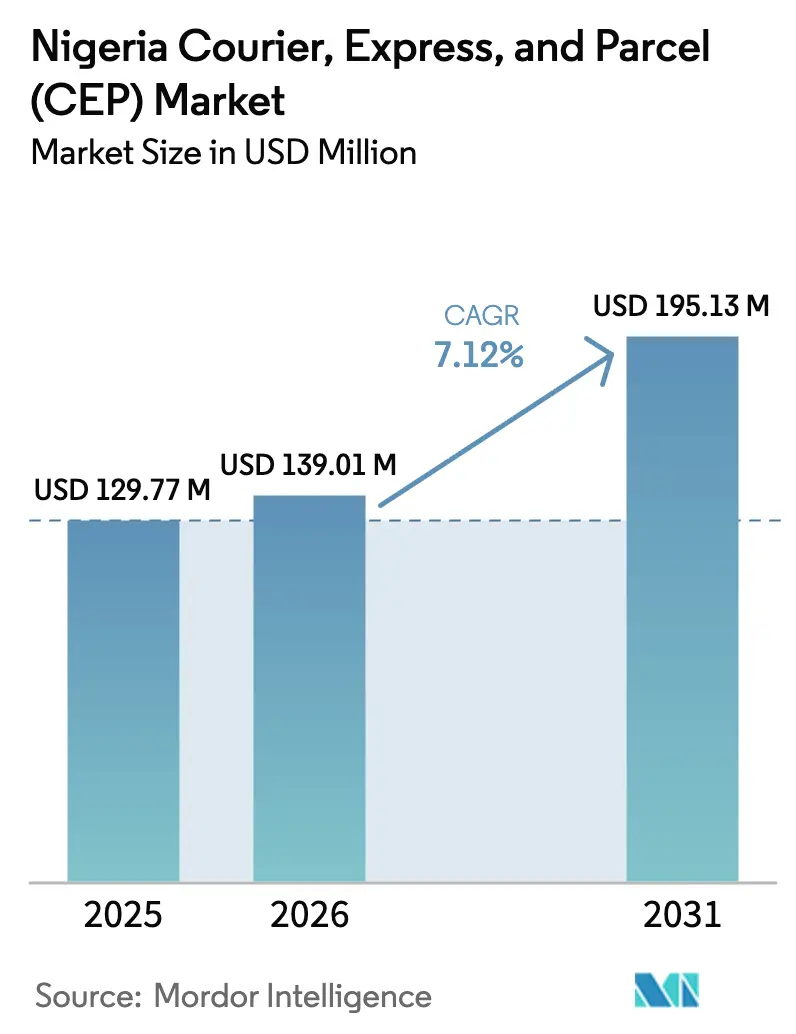
| Base Year Market Size (2025) | USD 129.77 Million |
| Market Size (2026) | USD 139.01 Million |
| Market Size (2031) | USD 195.13 Million |
| Growth Rate (2026 - 2031) | 7.12% CAGR |
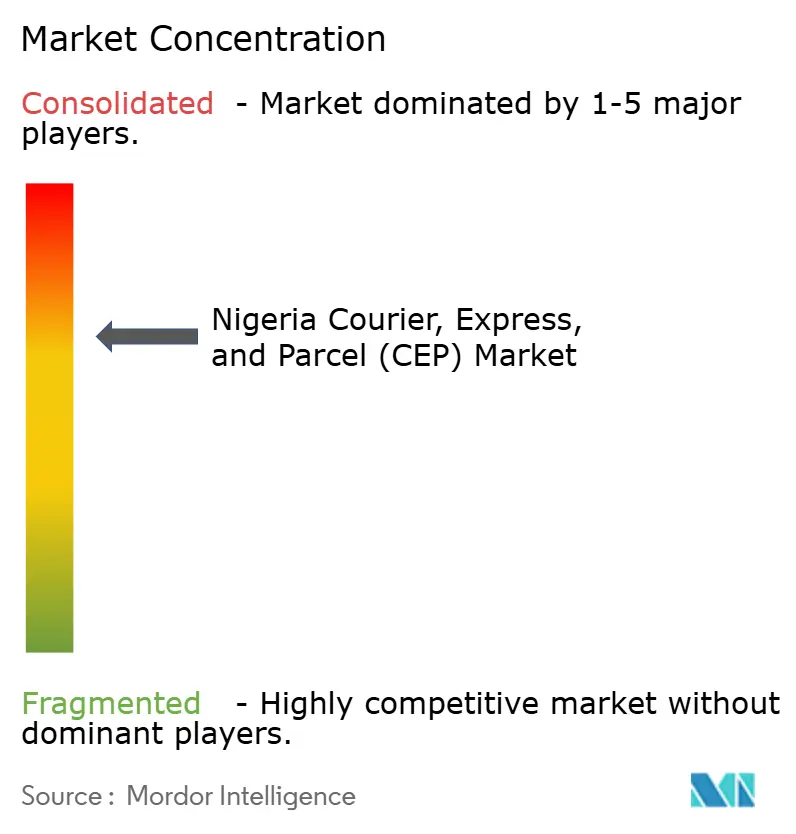
| Market Concentration | Medium |
Major Players *Disclaimer: Major Players sorted in no particular order Image © Mordor Intelligence. Reuse requires attribution under CC BY 4.0. | |
Nigeria Courier, Express, And Parcel (CEP) Market Analysis by Mordor Intelligence
The Nigeria courier, express, and parcel (CEP) market size was valued at USD 129.77 million in 2025 and estimated to grow from USD 139.01 million in 2026 to reach USD 195.13 million by 2031, at a CAGR of 7.12% during the forecast period (2026-2031). Rising internet penetration of 55% in 2024, a population of 223 million with a median age of 18.6 years, and the expansion of e-commerce platforms are widening the addressable customer base and lifting parcel volumes nationwide. Cross-border activity is accelerating because the African Continental Free Trade Area (AfCFTA) Digital Trade Protocol reduces trade costs and shortens customs processes, encouraging international shippers to route higher flows through Nigerian gateways. Global integrators have set new speed benchmarks, while technology-enabled local firms are building micro-fulfillment hubs to shorten delivery cycles and win premium customers. At the same time, fuel-price volatility and deteriorating road infrastructure are inflating operating costs, pushing smaller players toward consolidation or partnership models to remain competitive.
Key Report Takeaways
- By destination, domestic parcels led with 64.02% revenue share in 2025; international shipments are projected to grow at a 7.45% CAGR between 2026-2031.
- By speed of delivery, non-express accounted for 72.05% of the Nigeria courier, express, and parcel (CEP) market share in 2025, while express services are advancing at an 8.03% CAGR between 2026-2031.
- By model, the business-to-consumer (B2C) segment captured 58.10% share of the Nigeria courier, express, and parcel (CEP) market size in 2025; business-to-business (B2B) transactions are forecast to expand at a 3.60% CAGR between 2026-2031.
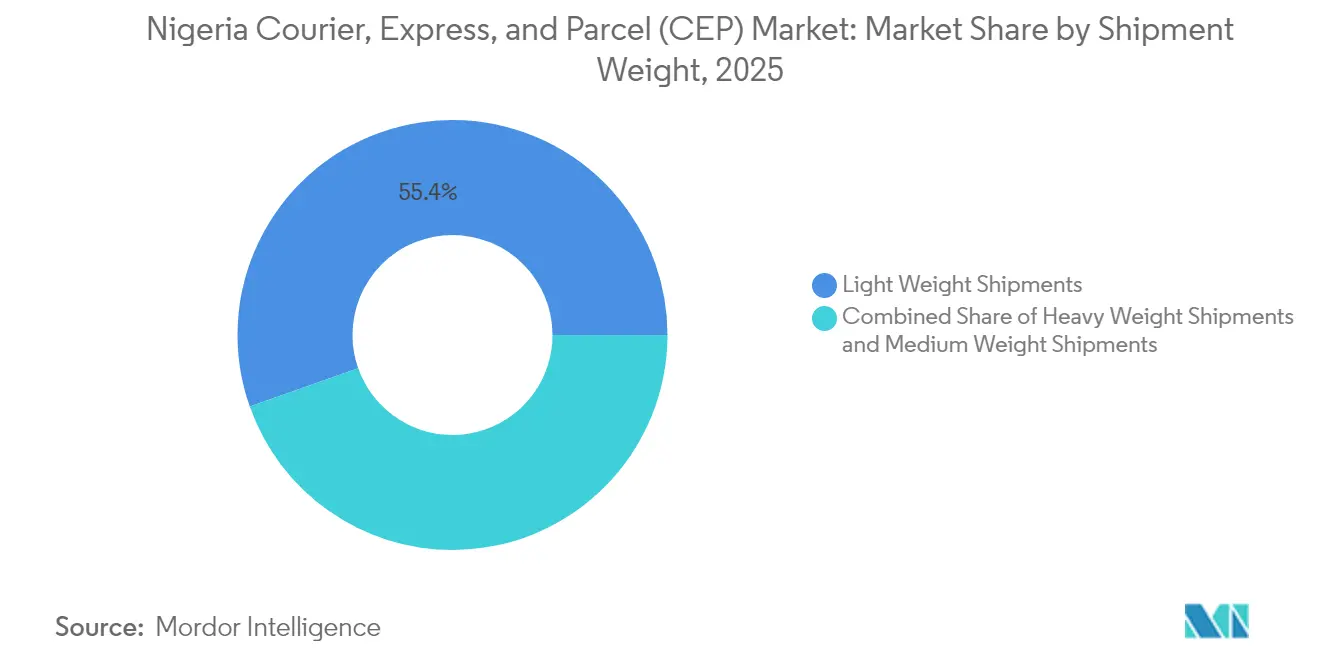
- By shipment weight, lightweight parcels held 55.40% of the revenue share in 2025, and heavyweight consignments are growing at a 6.32% CAGR between 2026-2031.
- By mode of transport, road maintained a 49.10% share in 2025; air transport is the fastest growing mode with a 6.08% CAGR between 2026-2031.
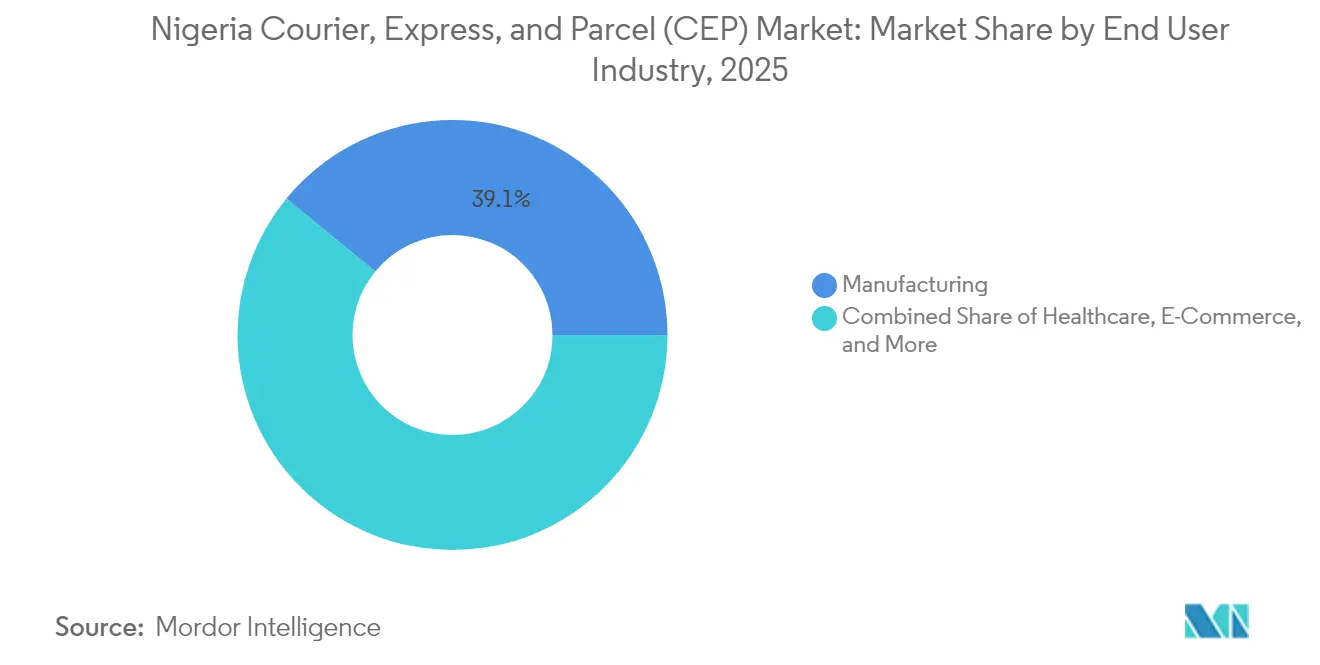
- By end user industry, manufacturing led with 39.05% revenue share in 2025, whereas e-commerce is the fastest growing vertical at an 7.78% CAGR between 2026-2031.
Note: Market size and forecast figures in this report are generated using Mordor Intelligence’s proprietary estimation framework, updated with the latest available data and insights as of 2026.
Nigeria Courier, Express, And Parcel (CEP) Market Trends and Insights
Drivers Impact Analysis*
| Driver | (~) % Impact on CAGR Forecast | Geographic Relevance | Impact Timeline |
|---|---|---|---|
| Surge in e-commerce transaction volumes | +1.8% | National, concentrated in Lagos, Abuja, Port Harcourt | Short term (≤ 2 years) |
| Expansion of organized retail and flash-sale events | +1.2% | Urban centers with retail concentration | Medium term (2-4 years) |
| Network upgrades by global integrators raising service benchmarks | +0.9% | Major cities with international connectivity | Medium term (2-4 years) |
| AfCFTA digital-trade protocol unlocking cross-border parcels | +1.5% | Border states and commercial hubs | Long term (≥ 4 years) |
| Micro-fulfillment hubs enabling same-day delivery economics | +0.8% | Lagos, Abuja metropolitan areas | Short term (≤ 2 years) |
| Growth of temperature-controlled pharma distribution | +0.4% | National, with healthcare infrastructure focus | Long term (≥ 4 years) |
| Source: Mordor Intelligence | |||


Surge in E-Commerce Transaction Volumes
E-commerce orders grew 22% year on year in Q1 2025, and 58% of total orders now originate from secondary cities, forcing operators to expand last-mile reach beyond Lagos and Abuja[1]Jumia Investor Relations, “Jumia Reports First Quarter 2025 Results,” jumia.com. Platform-run logistics such as “Jumia Delivery” launched in May 2025 illustrate how retailers internalize distribution to control the customer experience. Mobile payments already support most online purchases and are integrating with courier apps to pare cash-on-delivery risks. Cross-border sales from Temu and Shein, both new in Nigeria since November 2024, add international parcel volume that challenges local rivals on price and lead time. These shifts create a sustained flow of light parcels, which remain the dominant weight class, and raise expectations for end-to-end tracking and next-day drop-offs.
Expansion of Organized Retail and Flash-Sale Events
Black Friday, Ramadan, and back-to-school campaigns now generate up to five times normal weekly volumes, testing network flexibility and asset scalability across the Nigeria courier, express, and parcel (CEP) market. OmniRetail’s digital wholesale platform links 200 manufacturers with 140,000 neighborhood stores, showing how formal retail upgrades foster B2B parcel flows on predictable routes. Flash-sale mechanics require inventory turnover within 48 hours, prompting couriers to invest in micro-fulfillment hubs that stage fast-moving stock closer to consumers. Third-party providers such as Kwikpik offer warehousing-as-a-service to help small sellers preload inventory near demand centers and cut intra-city travel time[2]Kwikpik, “Warehousing as a Service,” kwikpik.io. These models reduce per-parcel costs and support premium delivery promises during seasonal peaks.
Network Upgrades by Global Integrators Raising Service Benchmarks
UPS added more than 200 weekly flights connecting Asia Pacific to Lagos via Sharjah in October 2024, shortening transit to two business days and setting new customer expectations. FedEx now markets three speed-tier products into Nigeria, including International Priority at 1-3 days, creating a differential that local providers must match through alliances or capital spending. The resulting uplift in service quality positions express deliveries as a premium but attainable option for high-value and time-sensitive goods. Domestic players respond by digitizing consignment management and partnering with airlines such as GIG Aviation, which acquired two ATR 72 freighters in March 2025 to add regional lift capacity. The race to improve reliability is reshaping network design and pricing strategies.
AfCFTA Digital-Trade Protocol Unlocking Cross-Border Parcels
Nigeria ratified the AfCFTA Digital Trade Protocol, committing to paperless trade documents, mutual recognition of electronic signatures, and integration with the Pan-African Payment and Settlement System (PAPSS)[3]AfricanLII, “Protocol on Digital Trade,” africanlii.org. Studies estimate Nigeria’s GDP could rise 12.8% from lower trade frictions, while parcel operators may see customs clearance times fall by days as electronic invoices replace paper forms. SMEs gain from 15% lower transaction costs, stimulating incremental cross-border flows. Implementation depends on harmonizing customs, tax, and standards regulations across ministries; but once aligned, the protocol should anchor long-term growth in international volumes.
Restraints Impact Analysis*
| Restraint | (~) % Impact on CAGR Forecast | Geographic Relevance | Impact Timeline |
|---|---|---|---|
| Deteriorating road infrastructure inflating last-mile costs | -1.4% | National, acute in secondary cities and rural areas | Medium term (2-4 years) |
| Customs and inspection bottlenecks delaying clearance | -0.8% | Port cities and border crossings | Short term (≤ 2 years) |
| Cash-on-delivery fraud and costly reverse logistics | -0.6% | Urban areas with high e-commerce penetration | Short term (≤ 2 years) |
| Fuel-price volatility post-subsidy removal | -1.1% | National impact on all transport modes | Short term (≤ 2 years) |
| Source: Mordor Intelligence | |||
Deteriorating Road Infrastructure Inflating Last-Mile Costs
Only 60,000 km of Nigeria’s 195,000 km roads are paved; heavy rains wash out many rural sections, and potholes slow urban travel, adding maintenance expense and trip time for vans and bikes. Security risks after dusk compel couriers to schedule most inter-state moves by day, compressing delivery windows and requiring larger fleets to clear daily backlogs. The World Bank approved USD 500 million in December 2024 to rehabilitate 6,500 km of rural routes, but benefits will not materialize until at least 2027[4]World Bank, “Nigeria to Enhance Road Infrastructure,” worldbank.org. Until then, operators absorb higher fuel and repair costs and sometimes levy surcharges to out-of-city customers.
Fuel-Price Volatility Post-Subsidy Removal
Petrol sold above NGN 1,000 (USD 1.11) per liter in 2024, compared with subsidized levels below NGN 200 (USD 0.22) previously, lifting fleet operating costs by more than 150%. Drivers queue for hours during supply shortages, delaying pick-ups and drop-offs. Some small couriers have exited the market, unable to fund working-capital gaps for fuel purchases. Firms with larger balance sheets are transitioning part of the urban fleet to electric motorcycles to hedge cost swings, but charging infrastructure remains limited.
*Our forecasts treat driver/restraint impacts as directional, not additive. The impact forecasts reflect baseline growth, mix effects, and variable interactions.
Segment Analysis
By End User Industry: E-Commerce Surges Ahead
Manufacturing commands a 39.05% share in 2025 because factories distribute inputs and finished goods across a national footprint. These shipments are often scheduled, bulkier, and heavier, aligning with non-express road solutions. E-commerce, in contrast, is growing at 7.78% CAGR between 2026-2031 as consumers embrace online marketplaces and social-commerce channels. Daily volume surges stress pick-and-pack operations and favor lightweight express models.
Financial services maintain document flows—especially legal contracts and debit cards—yet digitization is gradually replacing paper. Healthcare presents an emerging opportunity as pharmaceutical wholesalers require cold-chain compliance, encouraging investment in insulated packaging and temperature tracking. Each vertical’s unique service demands compel couriers to segment fleets and technology stacks, deepening specialization within the Nigeria courier, express, and parcel (CEP) industry.


By Destination: International Volumes Accelerate
International shipments are growing at a 7.45% CAGR between 2026-2031 as AfCFTA reforms and upgraded airline capacity shorten door-to-door cycles. Although domestic traffic holds 64.02% of the Nigeria courier, express, and parcel (CEP) market share in 2025, e-sellers are increasingly sourcing from global suppliers and fulfilling overseas orders, lifting outbound flows. The Nigeria courier, express, and parcel (CEP) market benefits when UPS and other carriers cut Asia-to-Nigeria transit times to two days, prompting exporters to route more time-sensitive goods through Lagos. Local operators forge interline agreements to capture hand-off revenue rather than lose business outright.
Customs is adopting electronic cargo tracking notes and a National Single Window to curb fraud and speed clearance, increasing transparency for shippers. These measures narrow the perceived service gap between domestic and international deliveries. However, additional compliance documentation can be costly for small players. Over the forecast horizon, the Nigeria courier, express, and parcel (CEP) market size for cross-border parcels is projected to rise steadily as trade protocols mature and consumer confidence in foreign e-commerce grows.
By Speed of Delivery: Express Services Capture Premium Demand
Express parcels are expanding at an 8.03% CAGR between 2026-2031, outpacing standard deliveries despite accounting for just 27.95% of the 2025 value. Global integrators’ speed guarantees spur customers to upgrade service levels for fashion, electronics, and high-value documents. Same-day propositions in Lagos and Abuja are now feasible through micro-fulfillment hubs and dense rider networks, carving a new niche within the express tier. Non-express remains price leader, but service expectations are drifting upward as consumers discover that incremental fees can cut wait times by days.
Fuel volatility and poor roads raise costs across both tiers, yet express operators can better pass through surcharges because urgency outweighs price sensitivity. Local couriers are co-loading non-express freight during off-peak hours to maximize vehicle utilization and protect margins. By 2031, the Nigeria courier, express, and parcel (CEP) market size attached to express services is forecast to account for a higher share of total revenue than volume, underscoring the premium’s resilience in a cost-inflated environment.
By Shipment Weight: Light Parcels Dominate but Heavy Parcels Rise
Lightweight parcels hold 55.40% share in 2025 because electronics, apparel, and beauty items—core e-commerce categories—are compact. Moto-couriers zip through congested streets and unpaved alleys, minimizing delays. Meanwhile, industrial recovery is lifting heavyweight parcels traffic at a 6.32% CAGR between 2026-2031 as manufacturers ship machinery parts and finished goods statewide. These heavier loads demand specialized lift-gate trucks and increase exposure to fuel inflation, but yield higher per-item revenue.
Medium-weight consignments—including small appliances and bundled consumer packs—occupy a middle path in capacity planning. Operators deploy load-balancing algorithms that mix sizes to maintain truck fill rates and avoid costly empty miles. Optimizing vehicle mix amid fluctuating demand remains a core challenge that the Nigeria courier, express, and parcel (CEP) market must solve for cost control.
By Mode of Transport: Road Dominance Faces Growing Air Demand
Road carries 49.10% of 2025 consignments thanks to dense national highway coverage and flexible scheduling. Nevertheless, air transport is climbing at a 6.08% CAGR between 2026-2031 as shippers seek speed and reliability for high-value goods. GIG Aviation’s ATR 72 acquisition added regional lift in March 2025, signaling private capital’s confidence in the segment. International air routes run frequent cargo flights from Lagos and Abuja, dovetailing with express service expansion.
Poor road conditions and security incidents are nudging some inter-city shippers toward domestic air lanes despite price premiums. Yet limited freighter slots outside key airports constrain scalability. In response, integrated carriers promote multi-modal offerings—air for trunk routes, road for last mile—to optimize cost-to-service ratios in the Nigeria courier, express, and parcel (CEP) market.
By Model: B2C Retains Lead While B2B Optimizes
B2C parcels comprise 58.10% of 2025 flows, reflecting rapid consumer adoption of online shopping. Young, mobile-first customers value doorstep delivery, even in secondary cities, pushing couriers to widen geographic reach. Cash-on-delivery still drives a material share of transactions, elevating fraud and reverse-logistics expenses. Platforms have responded with escrow-style payment options to curb failed drops, improving courier productivity.
B2B volumes grow at a 3.60% CAGR between 2026-2031 as firms implement demand-planning tools and consolidate orders into fewer, larger shipments. Digital wholesalers such as OmniRetail showcase how synchronized inventory cycles lower total parcel counts yet raise average weight per consignment, shifting resource needs from bikes to vans. Over time, data-rich transaction histories enable predictive routing and dynamic pricing, enhancing efficiency across the Nigeria courier, express, and parcel (CEP) industry.
Geography Analysis
Nigeria’s commercial axis stretching from Lagos through Ibadan, Abuja, and Kano generates the bulk of parcels, underpinned by high population density and consumer spending. Yet Jumia reported that 58% of Q1 2025 orders came from up-country zones, up from 50% a year earlier, underscoring the diffusion of parcel demand into secondary cities. Extending networks into these markets requires tackling bad roads, limited addressing systems, and sporadic power.
Spiraling petrol costs add geographic cost differentials: long-haul lanes such as Lagos-Kano now consume larger budget shares, pushing some shippers to stage goods closer to end markets. Rail revitalization programs are discussed but remain years from operation. The World Bank-funded rural road upgrade pledges to connect four million residents over the medium term, potentially unlocking new catchment areas for the Nigeria courier, express, and parcel (CEP) market.
Internationally, Lagos’s Murtala Muhammed International Airport and Port Harcourt’s Onne Port anchor inbound flows. AfCFTA reforms promise smoother transit across Benin, Niger, and Cameroon borders once Nigeria’s Single Window system fully interoperates. Implementation of electronic tracking notes for cargo in Q2 2025 should deter false declarations and raise throughput predictability. As these reforms converge, international shipments will continue to outpace domestic growth, enlarging the Nigeria courier, express, and parcel (CEP) market size tied to cross-border trade.
Competitive Landscape
Significant operators vie for customers, making the market moderately consolidated and price-sensitive. DHL, FedEx, and UPS dominate premium express corridors, leveraging global air networks and sophisticated tracking. Local champion GIG Logistics uses a hub-and-spoke model with 100+ service centers, while Red Star Express is upgrading training academies to sharpen service quality as of September 2025.
Partnerships blur competitive lines: UPS leverages Jumia’s last-mile fleet under an asset-light agreement, expanding reach without duplicating infrastructure. Technology newcomers such as Kwikpik and Renda integrate APIs for on-demand pick-ups, pushing incumbents to digitize booking and invoicing workflows. Compliance mandates from the Federal Inland Revenue Service require real-time e-invoicing by December 2025, which may push small couriers to merge or exit if they cannot fund system upgrades.
Fuel volatility accelerates fleet rationalization: operators hedge with electric bikes in urban cores and higher payload trucks on trunk lanes. Global integrators enjoy bulk-fuel contracts and aircraft hedging programs, gaining cost resilience. Domestic players counter with hyper-local knowledge and flexible pricing. The Nigeria courier, express, and parcel (CEP) market therefore combines intense tactical competition with strategic collaboration, as firms align strengths to cover capability gaps and share investment risks.
Nigeria Courier, Express, And Parcel (CEP) Industry Leaders
DHL Group
Nipost
United Parcel Service of America, Inc. (UPS)
Red Star Express PLC
CMA CGM Group (including CEVA Logistics)
- *Disclaimer: Major Players sorted in no particular order

Recent Industry Developments
- September 2025: Red Star Express renovated its training center to expand employee upskilling resources.
- August 2025: UPS introduced the UPS Healthcare® Lablink digital dashboard, giving laboratories self-service tracking and label-printing tools at pick-up points.
- April 2025: NIPOST launched a modernization drive aimed at upgrading technology and service standards nationwide.
- April 2025: Chinese e-commerce platform Temu signed an MoU with DHL to enhance cross-border logistics in Nigeria and other key markets.


Nigeria Courier, Express, And Parcel (CEP) Market Report Scope
Domestic, International are covered as segments by Destination. Express, Non-Express are covered as segments by Speed Of Delivery. Business-to-Business (B2B), Business-to-Consumer (B2C), Consumer-to-Consumer (C2C) are covered as segments by Model. Heavy Weight Shipments, Light Weight Shipments, Medium Weight Shipments are covered as segments by Shipment Weight. Air, Road, Others are covered as segments by Mode Of Transport. E-Commerce, Financial Services (BFSI), Healthcare, Manufacturing, Primary Industry, Wholesale and Retail Trade (Offline), Others are covered as segments by End User Industry.| Domestic |
| International |
| Express |
| Non-Express |
| Business-to-Business (B2B) |
| Business-to-Consumer (B2C) |
| Consumer-to-Consumer (C2C) |
| Heavy Weight Shipments |
| Light Weight Shipments |
| Medium Weight Shipments |
| Air |
| Road |
| Others |
| E-Commerce |
| Financial Services (BFSI) |
| Healthcare |
| Manufacturing |
| Primary Industry |
| Wholesale and Retail Trade (Offline) |
| Others |
| Destination | Domestic |
| International | |
| Speed of Delivery | Express |
| Non-Express | |
| Model | Business-to-Business (B2B) |
| Business-to-Consumer (B2C) | |
| Consumer-to-Consumer (C2C) | |
| Shipment Weight | Heavy Weight Shipments |
| Light Weight Shipments | |
| Medium Weight Shipments | |
| Mode of Transport | Air |
| Road | |
| Others | |
| End User Industry | E-Commerce |
| Financial Services (BFSI) | |
| Healthcare | |
| Manufacturing | |
| Primary Industry | |
| Wholesale and Retail Trade (Offline) | |
| Others |


Market Definition
- Courier, Express, and Parcel - The Courier, Express, and Parcel services, often called as CEP Market, refers to the logistics and postal service providers which specialize in moving small goods (parcels/packages). It captures the overall market size (USD) and market volume (number of parcels) of (1) the shipments/parcels/packages which are under 70kgs/ 154lbs weight, (2) Business Customer packages viz. Business-to-Business (B2B) & Business-to-Consumer (B2C) as well as private customer packages (C2C), (3) non-express parcel delivery services (Standard and Deferred) as well as express parcel delivery services (Day-Definite-Express and Time-Definite-Express), (4) domestic as well as international shipments.
- Demographics - To analyse total addressable market demand, population growth & forecasts have been studied and presented in this industry trend. It represents population distribution across categories like gender (male/female), development area (urban/rural), major cities among other key parameters like population density and final consumption expenditure (growth and share % of GDP). This data has been used for assessing the fluctations in demand & consumption expenditure, and the major hotspots (cities) of potential demand.
- Domestic Courier Market - Domestic Courier Market refers to the CEP shipments wherein the origin and destination is within the boundary of the geography studied (country or region as per the scope of report). It captures the market size (USD) and market volume (number of parcels) of (1) the shipments/parcels/packages which are under 70kgs/ 154lbs weight, including light weight shipments, medium weight shipments and heavy weight shipments (2) Business Customer packages viz. Business-to-Business (B2B) & Business-to-Consumer (B2C) as well as private customer packages (C2C), (3) non-express parcel delivery services (Standard and Deferred) as well as express parcel delivery services (Day-Definite-Express and Time-Definite-Express).
- E-Commerce - This end user industry segment captures the external (outsourced) logistics expenditure incurred by the e-tailers, through online sales channel, on Courier, Express, and Parcel (CEP) services. The scope includes (i) the supply chain of a company's online customer orders being fulfilled, (ii) the process of getting a product from the point of manufacturing to the point at which it is delivered to consumers. It involves managing inventory (deferred as well as time critical), shipping, and distribution.
- Export Trends and Import Trends - Overall logistics performance of an economy is positively and significantly (statistically) correlated to its trade performance (exports and imports). Hence, in this industry trend, total value of trade, major commodities/ commodity groups and the major trade partners, for the studied geography (country or region as per the scope of report) have been analysed alongside the impact of major trade/logistics infrastructure investments & regulatory environment.
- Financial Services (BFSI) - This end user industry segment captures the external (outsourced) logistics expenditure incurred by the BFSI players, on Courier, Express, and Parcel (CEP) services. CEP is important to the financial services industry in shipping of confidential documents and files. The establishments in this sector are engaged in (i) financial transactions (that is, transactions involving the creation, liquidation, or change in ownership of financial assets) or in facilitating financial transactions, (ii) financial intermediation, (iii) the pooling of risk by underwriting annuities and insurance, (iv) providing specialized services that facilitate or support financial intermediation, insurance and employee benefit programs, and (v) monetary control - the monetary authorities.
- Fuel Price - Fuel price spikes can cause delays and diruption for logistics service providers (LSPs), while drops in the same can result in higher short-term profitability and increased market rivalry to offer consumers with the best deals. Hence, the fuel price variations have been studied over the review period and presented along with the causes as well as market impacts.
- GDP Distribution by Economic Activity - Nominal Gross Domestic Product and distribution of the same, across major economic sectors in the geography studied (country or region as per scope of the report) have been studied and presented in this industry trend. As GDP is positively related to the profitability and growth of logistics industry, this data has been used in adjunction to the input-output tables/ supply-use tables for analyzing the potential major contributing sectors towards the logistics demand.
- GDP Growth by Economic Activity - Growth of Nominal Gross Domestic Product across major economic sectors, for the geography studied (country or region as per scope of the report) have been presented in this industry trend. This data has been utilized for assessing the growth of logistics demand from all the market end users (economic sectors considered here).
- Healthcare - This end user industry segment captures the external (outsourced) logistics expenditure incurred by the Healthcare players (Hospitals, clinics, mrdical centres) , on Courier, Express, and Parcel (CEP) services. The scope includes CEP services involved in the defrerred as well time critical movement of medical goods & supplies (surgical supplies and instruments, including gloves, masks, syringes, equipment). The establishments in this sector (i) include the ones providing medical care exclusively (ii) deliver services by trained professionals (iii) involve processes, including labor inputs of health practitioners with the requisite expertise (iv) are defined based on the educational degree held by the practitioners included in the industry.
- Inflation - Variations in both Wholesale Price Inflation (YoY change in producer price index) and Consumer Price Inflation have been presented in this industry trend. This data has been used to assess the inflationary environment as it plays a vital role in smooth functioning of the supply chain, directly impacting the logistics operational cost components e.g., pricing of tyres, driver wages & benefits, energy/fuel prices, maintenace costs, toll charges, warehousing rents, custom brokerage, forwarding rates, courier rates etc. hence impacting the overall freight and logistics market.
- Infrastructure - As infrastructure plays a vital role in an economy's logistics performance, variables like length of roads, distribution of road length by surface category (paved v/s unpaved), distribution of road length by road classification (expressways v/s highways v/s other roads), rail length, volume of containers handled by major ports and tonnage handled by major airports have been analysed and presented in this industry trend.
- International Express Service Market - International Express Service Market refers to the CEP shipments wherein the origin or destination is not within the boundary of the geography studied (country or region as per the scope of report). It captures the market size (USD) and market volume (number of parcels) of (1) the shipments/parcels/packages which are under 70kgs/ 154lbs weight, including light weight shipments, medium weight shipments and heavy weight shipments (ii) Inter-Region as well as Intra-Region Shipments
- Key Industry Trends - The report section named "Key Industry Trends" include all the key variables/parameters studied to better analyze the market size estimates and forecasts. All the trends have been presented in the form of data points (time series or latest available data points) along with analysis of the paramter in the form of concise market relevant commentary, for the geography studied (country or region as per the scope of report).
- Key Strategic Moves - The action taken by a company to differentiate from its competitor or used as a general strategy is referred to as a key strategic move (KSM). This includes (1) Agreements (2) Expansions (3) Financial Restructuring (4) Mergers and Acquisitions (5) Partnerships, and (6) Product Innovations. Key players (Logistics Service Providers, LSPs) in the market have been shortlisted, their KSM have been studied and presented in this section.
- Logistics Performance - Logistics Performance and Logistics Costs are the backbone of trade, and influences trade costs, making countries compete globally. Logistics performance is influenced by market wide adopted supply chain management strategies, government services, investments & policies, fuel/ energy costs, inflationary environment etc. Hence, in this industry trend, the logistics performance of the geography studied (country/ region as per the scope of report) has been analysed and presented over the review period.
- Manufacturing - This end user industry segment captures the external (outsourced) logistics expenditure incurred by the Manufacturing industry (including Hi-Tech/Technology) players, on Courier, Express, and Parcel (CEP) services. The end user players considered are the establishments primarily engaged in the chemical, mechanical or physical transformation of materials or substances into new products. Logistics Service Providers (LSPs) play a crucial role in maintaining a smooth flow of raw materials across the supply chain, enabling timely delivery of finished goods to distributors or end customers and storing & supplying the raw materials to clients for just-in-time manufacturing.
- Other End Users - Other end user segment captures the external (outsourced) logistics expenditure incurred by the construction, real estate, educational services, and professional services (administrative, waste management, legal, architectural, engineering, design, consulting, scientific R&D), on Courier, Express, and Parcel (CEP) services. Logistics Service Providers (LSPs) plays a crucial role in the reliable movement of time critical supplies and documents to/from these industries such as transporting any equipment or resources required, shipping confidential documents and files.
- Primary Industry - This end user industry segment captures the external (outsourced) logistics expenditure incurred by the AFF (Agriculture, Fishing, and Forestry) and Extraction indsutry (Oil &Gas, Quarrying and Mining) players, on Courier, Express, and Parcel (CEP) services. The end user players considered are the establishments (i) primarily engaged in growing crops, raising animals, harvesting timber, harvesting fish & other animals from their natural habitats and providing related support activities; (ii) that extract naturally occurring mineral solids, such as coal and ores; liquid minerals, such as crude petroleum; and gases, such as natural gas. Herein, Logistics Service Providers (LSPs) (i) play a crucial role in acquisition, storage, handling, transportation, and distribution activities for the optimal & continuous flow of inputs (seeds, pesticides, fertilizers, equipment, and water) from manufacturers or suppliers to the producers and smooth flow of output (produce, agro-goods) to distributors/ consumers; (ii) cover entire phases from upstream to downstream and play a crucial role in the transportation of machinery, drilling equipments, extracted minerals, crude oil & natural gas and refined/ processed products from one place to another. This includes both termperature controlled and non-temperature controlled logistics, as and when required according to the shelf life of goods being transported or stored.
- Producer Price Inflation - It indicates inflation from viewpoint of the producers viz. the average selling price received for their output over a period of time. Annual change (YoY) of producer price index is reported as wholesale price inflation in the "Inflation" industry trend. As WPI captures dynamic price movements in most comprehensive way, it is widely used by governments, banks, industry, business circles and is deemed important in formulation of trade, fiscal and other economic policies. The data has been used in adjunction to consumer price inflation for better understanding the inflationary environment.
- Segmental Revenue - Segmental Revenue has been triangulated or computed and presented for all the major players in the market. It refers to the courier, express, and parcel (CEP) market specific revenue earned by the company, over the base year of study, in the geography studied (country or region as per the scope of report). It is computed through the study and analysis of major parameters like financials, service portfolio, employee strength, fleet size, investments, number of countries present in, major economies of concern, etc. that have been reported by the company in its annual reports, webpage. For companies having scarce financial disclosures, paid databases like D&B Hoovers, Dow Jones Factiva have been resorted to and verified through industry/expert interactions.
- Transport and Storage Sector GDP - Value and growth of Transport and Storage Sector GDP has a direct relation to the freight and logistics market size. Hence, this variable has been studied and presented over the review period, in value terms (USD) and as share % of total GDP, in this industry trend. The data has been supported by concise and relevant commentary around the investments, developments, and current market scenario.
- Trends in E-Commerce Industry - Enhanced internet connectivity and boom in smartphone penetration, coupled with increasing disposable incomes, has led to a phenomenal growth in the e-commerce market globally. Online shoppers require fast and efficient delivery of their orders leading to an increase in the demand for logistics services especially e-commerce fulfilment services. Hence, the Gross Merchandise Value (GMV), historial and projected growth, breakup of major commodity groups in e-commerce industry for the studied geography (country or region as per scope of the report) have been analysed and presented in this industry trend.
- Trends in Manufacturing Industry - Manufacturing industry involves the transformation of raw materials into finished products, while logistics industry ensures the efficient flow of raw materials to the factory, and the transport of manufactured products to the distributors & consumers. Demand-Supply of both industries are highly cross-linked and critical for a seamless supply chain. Hence, the Gross Value Added (GVA), breakup of GVA into major manufacturing sectors, and growth of manufacturing industry over the review period have been analysed and presented, in this industry trend.
- Wholesale and Retail Trade (Offline) - This end user industry segment captures the external (outsourced) logistics expenditure incurred by the wholesalers and retailers, through offline sales channel, on Courier, Express, and Parcel (CEP) services. The end user players considered are the establishments primarily engaged in wholesaling or retailing merchandise, generally without transformation, and rendering services incidental to the sale of merchandise. Logistics Service Providers (LSPs) plays a crucial role in the reliable movement of supplies to and finished products from production houses to the distributors and finally to the end customer covering activites like material sourcing, transportation, order fulfillment, warehousing & storage, demand forecasting, inventory management etc.
| Keyword | Definition |
|---|---|
| Axle Load | The axle load refers to the total load (weight) bearing on the roadway through wheels connected to a given axle. Across the globe, there are systems in place to ensure axle load monitoring, wherein surpassing the defined limits set by the concerned regulatory authority can lead to penalty/fine. For transportation of goods via road this can be an important determinant of costs as knowledge about the axle load limits can be used to (i) load the vehicle optimally for maximizing profits (ii) avoid exceeding the same and hence the probable fines associated (iii) avoid wear and tear of the vehicle (iv) avoid damage to pavement resulting in noticeable public maintenance and repair costs (v) achieve better turnaround time. |
| Back Haul | Backhaul is the return movement of a transport vehicle from its original destination to its original point of departure, and can include full, partial, or empty truck loads (all or part of the way) depending on the visibility of the local freight ecosystem. In this regard, transportation of empty containers to the point of origin, known as deadheading is also a significant factor, considering the supply/container shortages across the geographies, resulting in cost escalation and under optimized profit potential attainment. Generally, the carriers offer discounts on the backhaul, to secure freight for the trip. |
| Bill of Lading (BOL) | A bill of lading is a legal contract document issued by a carrier to a shipper to acknowledge reception of their cargo, and is evidence for the contract of carriage between the two parties. Broadly it details the (i) type, quantity, and other specifications of the goods being carried (ii) destination, and terms & conditions of the shipment (iii) carrier and drivers with all the necessary information to process the shipment, which can be used for insurance and customs clearance purposes (iv) assurance that the consignment is damage-free and ready to be shipped to the consignee. In this regard, a house bill of lading (HBL) is a document issued by a freight forwarder or a non-vessel operating common carrier (NVOCC) to acknowledge receipt of items for shipment (to a shipper). If shipments from several shippers are involved a master bill of lading (MBL) might be involved which is a consolidated version of the same for all the shipments being taken care of by the carrier (to a common destination) and might be issued by the carrier to the freight forwarder or the shipper (depending on who books the transport). |
| Bunkering | Bunkering is the process of supplying fuel to power the propulsion system of a ship. It includes the logistics of loading and distributing the fuel among available shipboard tanks. In this regard, (i) Bunker fuel is technically any type of fuel oil used aboard ships. It gets its name from the containers on ships and in ports that it is stored in; in the days of steam they were coal bunkers but now they are bunker-fuel tanks, (ii) Bunker refers to the spaces (Tank) on board a vessel to store fuel, (iii) Bunker trader refers to a person dealing in trade of bunker (fuel), (iv) Bunker call is made when a cargo ship anchors or berths in a port to take on bunker oil or supplies, (v) Bunkering service is the supply of a requested quality and quantity of bunkers to a ship. Bunkering is signficant from point of view of freight rates applicable to the shipper as Bunker Contribution (BUC)/ Fuel Adjustment Factor (FAF)/ Bunker Adjustment Factor (BAF) are applied by shipping lines to offset the effect of fluctuations in the cost of bunkers. |
| Cabotage | Transport by a vehicle registered in a country, performed on the national territory of another country. Cabotage law may restrict domestic cargo traffic to be carried in its own nationally registered, and sometimes built and crewed vehicles, though regulations vary across industries/commodity groups/countries and sometimes specify maximum allowable percentage of cabotage that can be serviced by foreign registered fleet. |
| C-commerce | Collaborative commerce (also known as C-commerce), (i) describes electronically enabled business interactions among an enterprise’s internal personnel, business partners and customers throughout a trading community (industry, industry segment, supply chain or supply chain segment); (ii) is the optimization of supply and distribution channels to capitalize on the global economy by using new technology efficiently. Advantages of C-commerce, to detail few include (i) maximization of organization's efficiency and profitability (ii) technology integration with physical channels to allow companies to work together (iii) increased information exchange such as inventory and product specifications, using the web as an intermediary (iv) increased competitiveness by reaching a broader audience. Examples of C-commerce, also known as peer-to-peer commerce, include (i) companies that allow consumers to rent things from each other, or marketplaces, such as Meta (formerly Facebook) Marketplace, that allow the sale of used goods; (ii) DoorDash teamed up with many national brands, such as McDonald’s and Chipotle, to offer fast food delivery, building their business model on c-commerce. They have since expanded their delivery service from restaurants to retailers and even offer 'fleets' of drivers to businesses. |
| Courier | A business/company that delivers packages/parcels/shipments (upto 70 kgs) including quick door to door pickup and delivery service for goods or documents, domestically or internationally, on a commercial contract basis. Example, DHL Group, FedEx, United Parcel Service of America, Inc., USPS, International Distributions Services, J&T Express, SF Express among several others |
| Cross docking | Cross docking is a practice in logistics management that includes unloading incoming delivery vehicles and loading the materials directly into outbound delivery vehicles, omitting traditional warehouse logistical practices and saving time and money. It requires close synchronization of both inbound and outbound movements. It is highly significant in reduction of costs pertaining to warehousing & storage (and the associated Value Added Services). |
| Cross Trade | International transport between two different countries performed by a vehicle registered in a third country. A third country is a country other than the country of loading/embarkation and the country of unloading/disembarkation. Cross Trade law may restrict international cargo traffic to be carried by respective country's registered vehicles, and sometimes built and crewed vehicles, though regulations vary across industries/commodity groups/countries and sometimes specify maximum allowable percentage of cross trade that can be serviced by foreign registered fleet. |
| Customs Clearance | The process of declaring and clearing cargoes through customs. It includes the procedures involved in getting cargo released by Customs through designated formalities such as presenting import license/permit, payment of import duties and other required documentations by the nature of the cargo. In this regard, a customs broker is a person or company licensed by the respective department of the country to act on behalf of freight importers and exporters. |
| Dangerous Goods | Dangerous goods (or hazardous materials or HAZMAT) include flammable liquids/solids, gases (compressed, liquified, dissolved under pressure), corrosives, oxidising substances, explosive substances and articles, substances which on contact with water emit flammable gasses, organic peroxides, toxic substances, infectious substances, radioactive materials, miscellaneous dangerous goods and articles. |
| First mile Delivery | First mile delivery refers to the (i) first stage of the freight/shipment/cargo/courier transportation (ii) the transportation of goods from a merchant’s premises or warehouse to the next fulfillment centre/warehouse/hub from where the goods are forwarded (iii) shipping goods from local distribution centers to stores (For retailers) (iv) transportation of finished goods from a plant or a factory to a distribution center (For manufacturers), (v) pick up of goods from the end-customer’s home or store followed by movement to a warehouse or storage location (movers and packers), (vi) process where goods are picked up from a retailer and then transferred to third-party logistics providers or courier service providers to be delivered to the end-consumer (e-commerce). Once the package reaches the next warehouse or the courier’s hub, it is then sorted and transported further until it reaches the customer’s doorstep. Example, if one chooses UPS as a courier, first-mile delivery will be the product being delivered from manufacturer's/retailer's warehouse to the UPS’s warehouse/ fulfilment centre. |
| Last Mile Delivery | Last mile delivery refers to the very last step of the delivery process when a parcel is moved from a transportation hub (warehouse or a distribution center or fulfillment centre) to its final destination, which usually is a personal residence/retail store/ business, or parcel locker. It accounts for around half of the total cost involved in entire process of first mile, middle mile, and last mile delivery, though it can vary shipment to shipment, based on commodity, business model and similar factors. |
| Milkrun | A Milk Run is a delivery method used to transport mixed loads from various suppliers to one customer, using lean management principles applied to logistics. Instead of each supplier sending a truck every week to meet the needs of one customer, one truck (or vehicle) visits the suppliers to pick up the loads for that customer. This method of transport got its name from the dairy industry practice, where one tanker used to collect milk from several dairy farms for delivery to a milk processing company. A milk run can be a more efficient way to handle logistics but require proper planning. If the route involves products from different companies, there is need for an agreement about cost-sharing and other aspects of the cooperative delivery arrangement. Once the group settles these issues, this delivery method can save time and money for everyone by pooling operation costs and resources. |
| Multi country consolidation | Multi-Country Consolidation (MCC) is a cost-effective solution that consolidates one's cargo from different countries of origin to build Full Container Loads (FCL). MCC is most suitable for companies that import light volumes of goods from multiple countries but want to take advantage of the more economic FCL freight rates. Apart from costing some of the other advantages include (i) flexibility to choose suppliers from a wider range of origin countries without worrying about the logistics to final destination from each origin, (ii) ability to pick the most suitable suppliers from many different countries for one's business operations. The increase in one's sourcing options by MCC provides the kind of flexibility needed in competitive global markets. |
| Q-commerce | Q-commerce, also referred to as quick commerce, is a type of e-commerce where emphasis is on quick deliveries, typically in less than an hour. The companies providing Q-Commerce services might have vertically intergrated model or might be using third party delivery platforms (outsourced logistics). It has advantages like (i) competitve USP, (ii) potential to earn greater profit margins, (iii) better customer experience, (iv) guaranteed availability of products, (v) traceability, and (vi) scaleability. |
| ReverseLogistics | Reverse logistics is a type of supply chain management that moves goods from customers back to the sellers or manufacturers and may involve ciruclar economy principles (3Rs) viz. recycling, reuse (repurposing, reselling), reducing or repairing. In this regard, reverse commerce (or Recommerce) is the selling of previously owned items through physical or online marketplaces/distribution channels to buyers who reuse, recycle or resell them. |


Research Methodology
Mordor Intelligence follows a four-step methodology in all our reports.
- Step-1: Identify Key Variables: In order to build a robust forecasting methodology, the variables and factors identified in Step-1 are tested against available historical market numbers. Through an iterative process, the variables required for market forecast are set and the model is built on the basis of these variables.
- Step-2: Build a Market Model: Market-size estimations for the forecast years are in nominal terms. Inflation is considered to be a part of the pricing, and the average selling price (ASP) is varying throughout the forecast period for each country
- Step-3: Validate and Finalize: In this important step, all market numbers, variables and analyst calls are validated through an extensive network of primary research experts from the market studied. The respondents are selected across levels and functions to generate a holistic picture of the market studied.
- Step-4: Research Outputs: Syndicated Reports, Custom Consulting Assignments, Databases & Subscription Platforms


