PFAS-Free Food Packaging Market Size and Share
Market Overview
| Study Period | 2019 - 2030 |
|---|---|
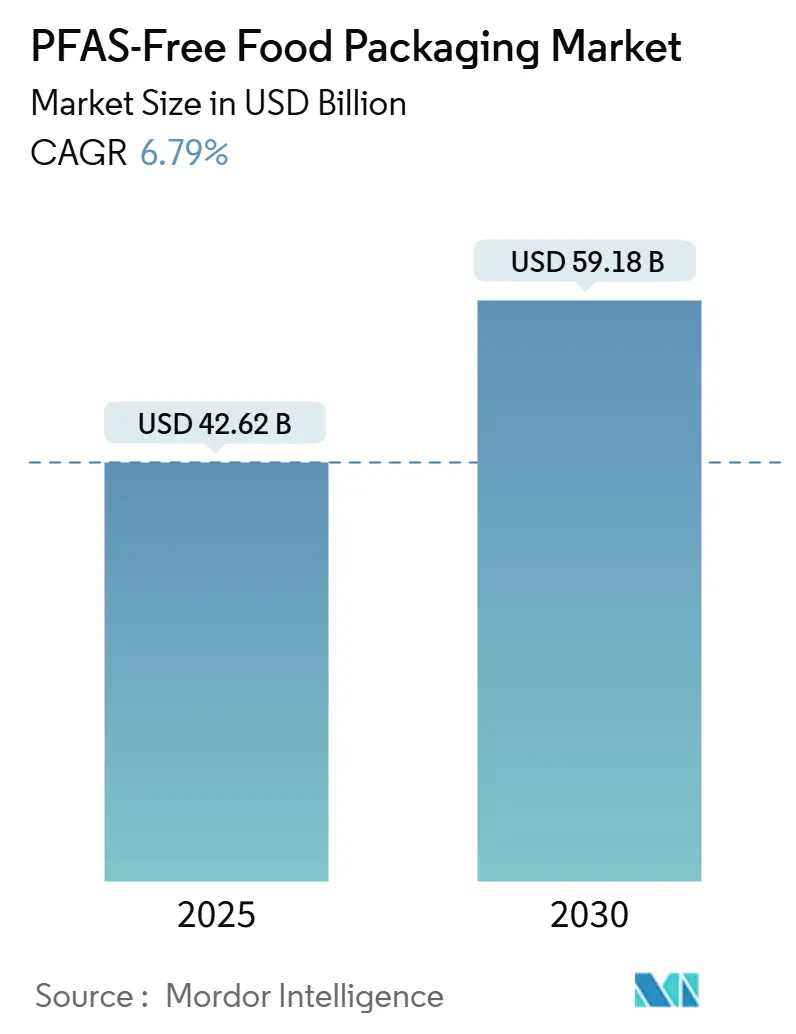
| Market Size (2025) | USD 42.62 Billion |
| Market Size (2030) | USD 59.18 Billion |
| Growth Rate (2025 - 2030) | 6.79% CAGR |
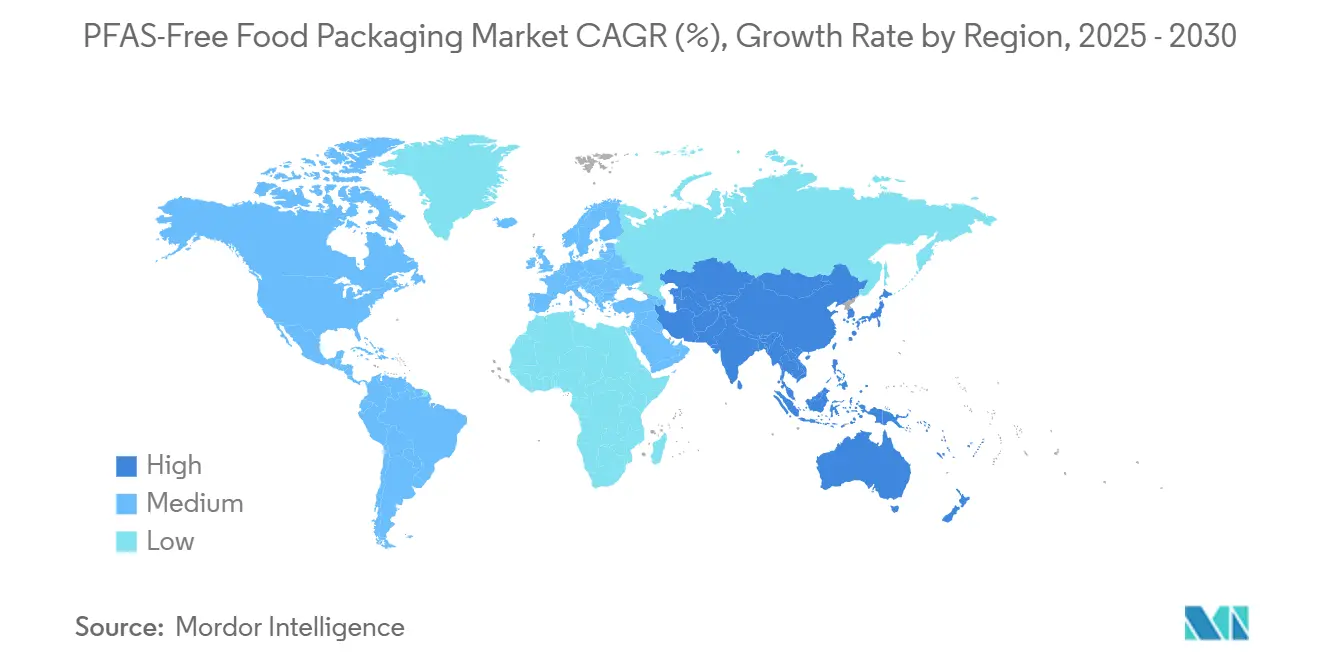
| Fastest Growing Market | Asia Pacific |
| Largest Market | North America |
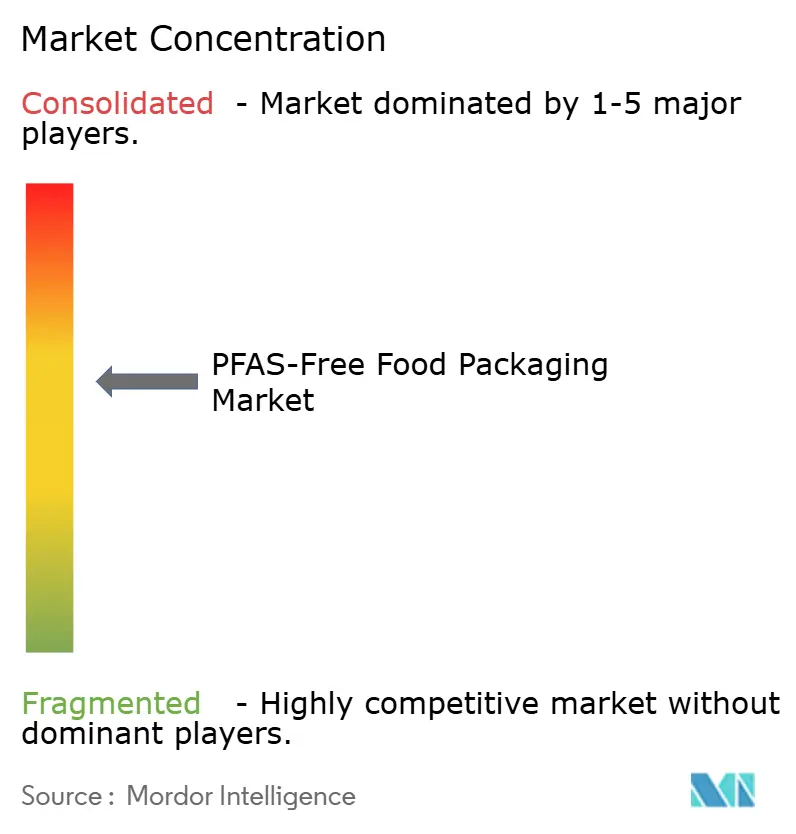
| Market Concentration | Medium |
Major Players *Disclaimer: Major Players sorted in no particular order Image © Mordor Intelligence. Reuse requires attribution under CC BY 4.0. | |
PFAS-Free Food Packaging Market Analysis by Mordor Intelligence
The PFAS-free food packaging market size is valued at USD 42.62 billion in 2025 and is projected to reach USD 59.18 billion by 2030, advancing at a 6.79% CAGR. Heightened regulatory scrutiny, corporate sustainability mandates, and rapidly evolving barrier-coating technologies are driving rapid shifts away from fluorinated chemistries toward safer materials across the global food value chain. Accelerated state and regional bans, as well as quick-service restaurant (QSR) procurement timelines, and breakthrough aqueous and bio-based coatings underpin demand momentum, even as cost premiums and performance gaps in extreme use cases temper short-term uptake. Competitive intensity is rising as incumbent fiber converters, chemical companies, and biopolymer innovators jockey for scale, intellectual property advantage, and preferred supplier status under multi-year packaging contracts in North America, Europe, and increasingly the Asia-Pacific, where molded-fiber capacity is scaling.
Key Report Takeaways
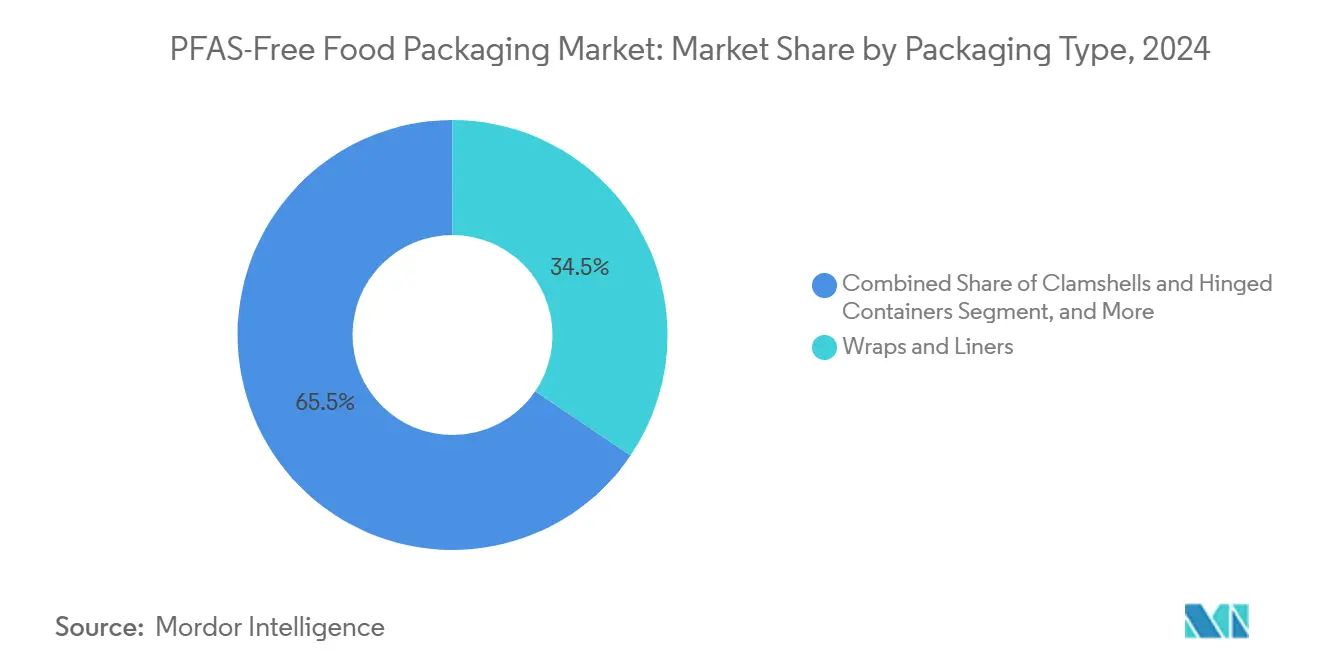
- By packaging type, the wraps and liners segment captured 34.47% of the PFAS-Free Food Packaging Market revenue share in 2024.
- By material type, the PFAS-Free Food Packaging Market size for bioplastics is projected to grow at an 8.59% CAGR between 2025–2030.
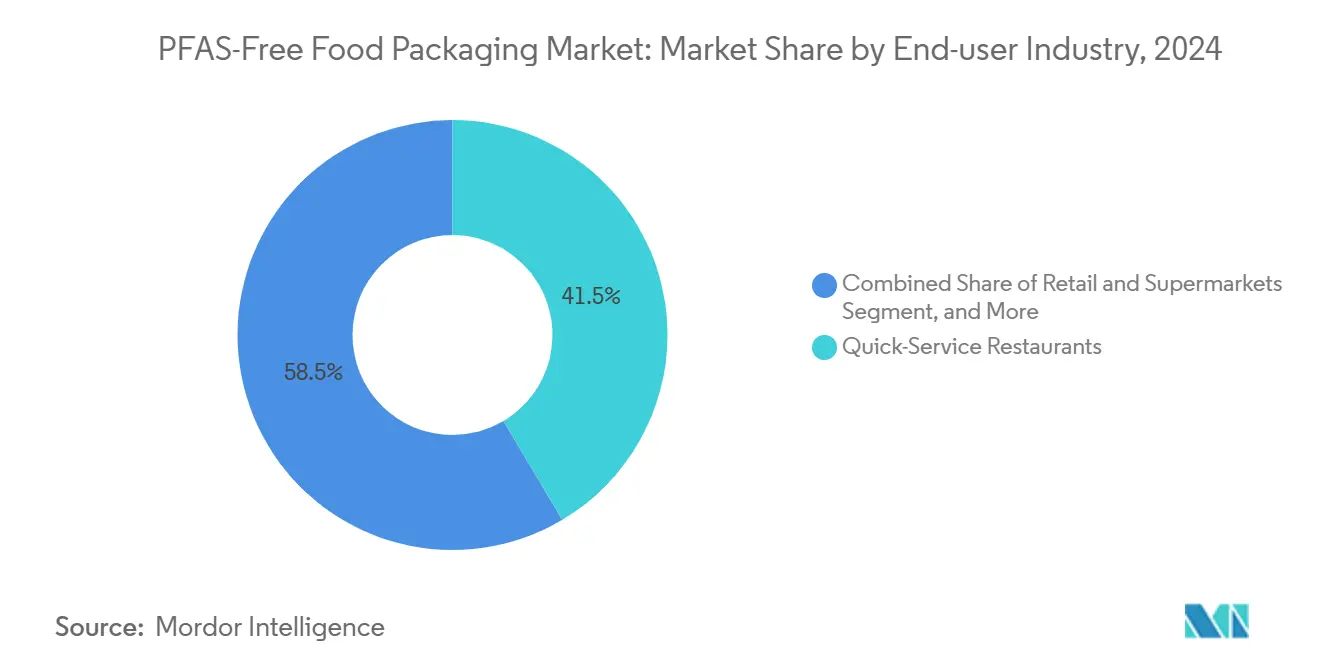
- By end-user industry, the quick-service restaurants segment captured 41.47% of the PFAS-Free Food Packaging Market share in 2024.
- By geography, the PFAS-Free Food Packaging Market size for Asia-Pacific is projected to grow at an 8.27% CAGR between 2025–2030.
Global PFAS-Free Food Packaging Market Trends and Insights
Drivers Impact Analysis*
| Driver | (~) % Impact on CAGR Forecast | Geographic Relevance | Impact Timeline |
|---|---|---|---|
| Stricter global and state-level PFAS bans | +1.8% | Global, early in North America and Europe | Short term (≤ 2 years) |
| Major QSR chain PFAS-free procurement mandates | +1.5% | Global, concentrated in North America and Europe | Medium term (2-4 years) |
| Breakthrough aqueous or bio-based barrier coatings | +1.2% | Global, with R&D hubs in North America and Europe | Medium term (2-4 years) |
| Scale-up of Asia-Pacific molded-fiber capacity | +1.0% | Asia-Pacific core, spill-over to global supply chains | Long term (≥ 4 years) |
| Total-organic-fluorine third-party certification uptake | +0.8% | North America and Europe, expanding to Asia-Pacific | Medium term (2-4 years) |
| Corporate Scope-3 decarbonization targets | +0.7% | Global, led by multinationals | Long term (≥ 4 years) |
| Source: Mordor Intelligence | |||
Stricter global and state-level PFAS bans
Rapid regulatory escalation is delivering an irreversible push away from fluorinated chemistries. The European Union’s Packaging and Packaging Waste Regulation set total-organic-fluorine limits below 100 ppm in 2024, while California’s Assembly Bill 1200 outlawed PFAS in food packaging one year earlier. Parallel prohibitions in New York and Washington, plus the U.S. EPA proposal to cap PFOS and PFOA in drinking water, weave compliance into a cross-sector public-health narrative. Companies are responding with single, global PFAS-free specifications to avoid region-specific SKUs, thereby turning early compliance into a competitive advantage.
Major QSR chain PFAS-free procurement mandates
Corporate mandates now amplify legal pressure. McDonald’s vowed to eliminate PFAS globally by 2025; Subway, Chipotle, and Wendy’s followed, collectively reshaping packaging supply worth billions of units annually. Supplier contracts include verification clauses that cascade through converters, pulp mills, and coating formulators, while franchisees must quickly retrofit their operations. Competitive branding leverages the visibility of PFAS-free credentials as a customer-facing differentiation, further accelerating adoption.
Breakthrough aqueous or bio-based barrier coatings
Technology progress is closing performance gaps that once favored PFAS. Water-based systems such as Archroma’s Cartaseal enable grease and moisture resistance for fry sleeves and burger wraps without fluorine and have received food-contact approvals in multiple jurisdictions. Protein-based and polysaccharide coatings from startups like Xampla convert agricultural waste into functional barriers validated in in-market pilots with leading QSRs. As scale grows, material cost curves become more favorable, broadening the addressable applications beyond premium niches.
Scale-up of Asia-Pacific molded-fiber capacity
Asia-Pacific is becoming the cost-efficient engine room for global PFAS-free supply. Malaysia’s G-COVE plant, for example, adds over 100,000 tons of fiber packaging per year and exports to U.S. and EU buyers, aligning with PFAS restrictions. Chinese capacity surged 40% in 2024 as domestic delivery giants shifted to molded fiber. Technology transfers from European OEMs are tightening quality tolerances, helping Asian output meet stringent U.S. and EU absorption specs, and easing price premiums for cost-sensitive operators worldwide.
Restraints Impact Analysis*
| Restraint | (~) % Impact on CAGR Forecast | Geographic Relevance | Impact Timeline |
|---|---|---|---|
| 15-30% cost premium of PFAS-free options | -1.2% | Global, pronounced in price-sensitive markets | Short term (≤ 2 years) |
| Performance gaps in high-humidity or hot-grease use | -0.8% | Global, concentrated in QSR and institutional segments | Medium term (2-4 years) |
| Bio-barrier raw-material supply volatility | -0.6% | Global, tied to agricultural regions | Medium term (2-4 years) |
| Recycling-stream contamination risk | -0.4% | North America and Europe, extending to regions with advanced waste systems | Long term (≥ 4 years) |
| Source: Mordor Intelligence | |||
15-30% cost premium of PFAS-free options
Current PFAS-free substrates often carry double-digit mark-ups versus legacy coatings as specialty resins, modified production lines, and lower plant utilization drive higher unit costs. Independent restaurants and institutional caterers facing thin margins therefore delay full conversion, while large chains negotiate volume rebates or cost-sharing arrangements with converters. As capacity ramps up and formulations mature, analysts anticipate narrowing price differentials; however, near-term premiums remain a headwind for the PFAS-free food packaging market.
Performance gaps in high-humidity or hot-grease use
For fries, pizza boxes, and microwavable containers, existing bio-barrier systems achieve only 70-85% of PFAS grease resistance under extended contact and elevated temperature tests.[1]Food Packaging Forum, “PFAS in Food Packaging,” foodpackagingforum.org Failures risk pack integrity and brand liability. Chemical innovators are trialing hybrid clay-protein laminates and nano-cellulose layers, but qualification cycles remain lengthy. Until robust drop-in replacements emerge, converters must deploy multilayer approaches that add complexity and cost, tempering immediate uptake for the PFAS-free food packaging industry.
*Our forecasts treat driver/restraint impacts as directional, not additive. The impact forecasts reflect baseline growth, mix effects, and variable interactions.
Segment Analysis
By Packaging Type: functional wraps dominate volume while rigid containers fuel future growth
Wraps and liners accounted for 34.47% of the 2024 demand in the PFAS-free food packaging market, reflecting high-turnover items such as sandwich wraps, bakery sheets, and tray liners that achieve necessary functionality with cost-effective fiber substrates. The clamshells and hinged-container cohort is expanding at an 8.27% CAGR as aggregators, ghost kitchens, and platform-based delivery rely on grease-resistant molded fiber or coated paperboard to protect hot entrees during multi-stop journeys.
Plates, bowls, and trays maintain steady institutional demand, while cups and lids prompt material scientists to develop multilayer bio-polymer films that can withstand steam and direct contact with 80 °C beverages. Bags and pouches remain a niche market in overall volume but are critical for fresh-produce aisles and frozen entrees that require low-temperature flex-crack performance.


By Material Type: paper and paperboard remain anchor materials while bioplastics accelerate
Paper-based substrates retained a 45.56% share during 2024. Pulp pricing stability and existing press equipment make fiber the default for operators pursuing rapid PFAS elimination. Meanwhile, bioplastics such as polyhydroxyalkanoates (PHAs) and polylactic acid (PLA) composites are on an 8.59% CAGR trajectory, targeting cases where high barrier and clarity trump cost.
Molded fiber is scaling through Asia-Pacific mega-plants that leverage lower labor inputs, ensuring cost competitiveness for food-service trays and bowls. Cellulose films cater to deli windows that require transparency, while wax-coated papers persist where bake-in performance offsets recyclability trade-offs, particularly in the pastry and confectionery segments.
By End-user Industry: QSR leadership extends retail momentum
The PFAS-free food packaging market saw QSRs account for 41.47% share in 2024, as global chains roll out corporate policies that specify sub-100 ppm total organic fluorine thresholds. Retail and supermarkets, while smaller, are outpacing growth at 8.67% CAGR as grocery merchandisers transition bakery boxes, meat trays, and salad bar containers to ensure compliance with impending local bans.
Cafes and bakeries prefer visually appealing molded fiber or print-ready barrier papers to signal eco-commitment. Institutional catering, spanning corporate cafeterias to schools, balances cost pressures against tender requirements that increasingly reference PFAS-free criteria. Frozen-meal producers test high-temperature bio-coatings able to survive 700-W microwaving without delamination.
Geography Analysis
North America accounted for 36.73% of global revenue in 2024, driven by bans in California, New York, and Washington, as well as voluntary FDA phase-out guidance that prompted brand owners to align their supply across states. The PFAS-free food packaging market size in the region is forecast to expand steadily as smaller chains follow trend-setters and private-label grocery lines convert deli and bakery formats. Cross-border harmonization with Canadian toxic-substances legislation simplifies supplier logistics, while Mexican converters co-produce PFAS-free wraps for both domestic diners and U.S. franchises operating in the country.
The Asia-Pacific region is expected to show the fastest growth, with an 8.27% CAGR through 2030. Massive molded-fiber line installations in China, Malaysia, and Vietnam underpin export volume, narrowing delivered-cost gaps for U.S. and European buyers. Domestic opportunities are equally compelling; Southeast Asian food-delivery volumes surged, and governments are now drafting PFAS limits to curb landfill and wastewater contamination. Japan and South Korea adopt stricter chemical-safety laws, which naturally align with PFAS-free solutions, whereas India’s vibrant street-food scene and emerging QSR chains present a price-sensitive yet high-growth frontier.
Europe leverages a unified PPWR framework that standardizes PFAS caps, thereby creating predictable demand signals.[2]European Food Safety Authority, “Perfluoroalkyl Substances (PFAS),” efsa.europa.eu Germany’s discounter giants and France’s fast-casual bakeries switched to water-based grease barriers early, driving volume for in-region mills. The United Kingdom follows similar rules post-Brexit, with its Environment Act powers accelerating PFAS phase-outs. Southern European nations like Italy and Spain, with robust fresh-produce export industries, increasingly require PFAS-free liners to retain EU market access, reinforcing conversion downstream in agricultural packaging operations.

Competitive Landscape
Competition is moderate with a blend of multi-regional incumbents and agile specialists. Huhtamaki, Stora Enso, and Graphic Packaging are repositioning their paperboard mills toward water-based or protein-coated output lines to defend volumes. Specialty innovators such as Footprint and Billerud focus exclusively on PFAS-free architectures, commanding margins with IP-protected fiber forming and barrier chemistries. Chemical suppliers, notably Archroma, AkzoNobel, and Kemira, monetize licensing and resin sales by embedding their solutions into converter processes.
Strategic alliances form the backbone of technology deployment. Huhtamaki’s alliance with Xampla aims to rapidly industrialize plant-protein coating capabilities.[3]Huhtamaki, “Huhtamaki and Xampla Partner to Develop Innovative PFAS-Free Food Packaging,” huhtamaki.com Stora Enso plowed EUR 50 million (USD 55 million) into its Oulu mill upgrade to scale aqueous coating lines. Eastman Chemical aligned with Sealed Air to deliver bio-film variants through 2030, tapping Eastman’s molecular-recycling feedstock for lower-carbon inputs. Acquisition moves, such as Mondi’s 25% stake in traceless materials for EUR 12 million (USD 13.2 million), highlight a race for patented biopolymer capacity. Early-stage funding for Xampla and B’Zeos indicates a venture appetite for game-changing coatings and seaweed-based substrates.
Incumbents pursue global contracts with QSR groups to lock multi-year supply volumes and recover capital investments quickly. Certification to TÜV Rheinland total-organic-fluorine testing becomes a prerequisite for preferred-supplier lists, further professionalizing market entry. Margins stay pressured in commodity wraps yet ascend in high-barrier clamshells where performance parity meets brand risk mitigation.
PFAS-Free Food Packaging Industry Leaders
Footprint LLC
Stora Enso Oyj
Smurfit WestRock plc
Novolex Holdings
UPM Specialty Papers
- *Disclaimer: Major Players sorted in no particular order

Recent Industry Developments
- October 2024: Huhtamaki announced a strategic partnership with Xampla to develop protein-based barrier coatings for food packaging applications, targeting commercial deployment by 2026 across multiple packaging formats.
- September 2024: Stora Enso completed a EUR 50 million (USD 55 million) investment in barrier-coating technology at its Oulu mill in Finland, expanding capacity by 40%.
- August 2024: Eastman Chemical and Sealed Air Corporation formed a joint venture to develop bio-based barrier films for food packaging, aiming for USD 100 million in revenue by 2028.
- July 2024: AkzoNobel launched its Interpon Terra coating system for food-contact metal packaging and rigid containers, after receiving FDA approval.


Global PFAS-Free Food Packaging Market Report Scope
| Wraps and Liners |
| Clamshells and Hinged Containers |
| Plates, Bowls and Trays |
| Cups and Lids |
| Bags and Pouches |
| Other Packaging Types |
| Paper and Paperboard |
| Molded Fiber/Pulp |
| Bioplastics |
| Cellulose Films |
| Clay/Wax-Coated Paper |
| Other Material Types |
| Quick-Service Restaurants |
| Retail and Supermarkets |
| Cafes and Bakeries |
| Institutional Catering |
| Frozen and Ready-Meal Producers |
| Other End-User Industries |
| North America | United States | |
| Canada | ||
| Mexico | ||
| South America | Brazil | |
| Argentina | ||
| Chile | ||
| Rest of South America | ||
| Europe | United Kingdom | |
| Germany | ||
| France | ||
| Italy | ||
| Spain | ||
| Russia | ||
| Rest of Europe | ||
| Asia-Pacific | China | |
| India | ||
| Japan | ||
| South Korea | ||
| Australia | ||
| Rest of Asia-Pacific | ||
| Middle East and Africa | Middle East | Saudi Arabia |
| United Arab Emirates | ||
| Turkey | ||
| Rest of Middle East | ||
| Africa | South Africa | |
| Nigeria | ||
| Rest of Africa | ||
| By Packaging Type | Wraps and Liners | ||
| Clamshells and Hinged Containers | |||
| Plates, Bowls and Trays | |||
| Cups and Lids | |||
| Bags and Pouches | |||
| Other Packaging Types | |||
| By Material Type | Paper and Paperboard | ||
| Molded Fiber/Pulp | |||
| Bioplastics | |||
| Cellulose Films | |||
| Clay/Wax-Coated Paper | |||
| Other Material Types | |||
| By End-user Industry | Quick-Service Restaurants | ||
| Retail and Supermarkets | |||
| Cafes and Bakeries | |||
| Institutional Catering | |||
| Frozen and Ready-Meal Producers | |||
| Other End-User Industries | |||
| By Geography | North America | United States | |
| Canada | |||
| Mexico | |||
| South America | Brazil | ||
| Argentina | |||
| Chile | |||
| Rest of South America | |||
| Europe | United Kingdom | ||
| Germany | |||
| France | |||
| Italy | |||
| Spain | |||
| Russia | |||
| Rest of Europe | |||
| Asia-Pacific | China | ||
| India | |||
| Japan | |||
| South Korea | |||
| Australia | |||
| Rest of Asia-Pacific | |||
| Middle East and Africa | Middle East | Saudi Arabia | |
| United Arab Emirates | |||
| Turkey | |||
| Rest of Middle East | |||
| Africa | South Africa | ||
| Nigeria | |||
| Rest of Africa | |||


Key Questions Answered in the Report
What size is the PFAS-free food packaging market in 2025?
It is valued at USD 42.62 billion and is forecast to reach USD 59.18 billion by 2030.
Which region leads demand for PFAS-free food packaging?
North America holds 36.73% of 2024 global revenue, driven by early bans and QSR mandates.
Which end-user category is growing fastest?
Retail and supermarkets are expanding at an 8.67% CAGR through 2030 as grocery chains phase out PFAS.
Why are PFAS-free options still more expensive?
Specialty resins, modified machinery, and lower volumes create a 15-30% cost premium until scale economies improve.
Which material segment shows the highest future growth?
Bioplastics are projected to grow at an 8.59% CAGR due to improved barrier performance and compostability.
What performance gaps remain for PFAS-free solutions?
Current coatings underperform in hot-grease, high-humidity uses, reaching only about 70-85% of legacy PFAS resistance.
Page last updated on:


