
Sustainable Foodservice Packaging Market Size and Share
Market Overview
| Study Period | 2020 - 2031 |
|---|---|
| Market Size (2026) | USD 69.7 Billion |
| Market Size (2031) | USD 93.43 Billion |
| Growth Rate (2026 - 2031) | 6.04 % |
| Fastest Growing Market | Asia Pacific |
| Largest Market | Europe |
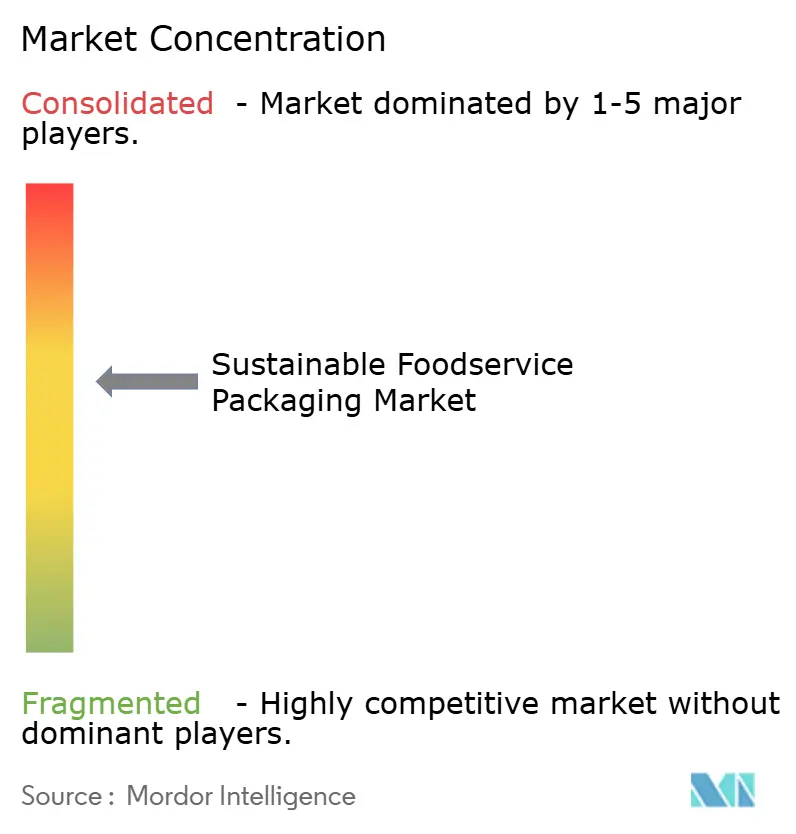
| Market Concentration | Medium |
Major Players *Disclaimer: Major Players sorted in no particular order Image © Mordor Intelligence. Reuse requires attribution under CC BY 4.0. | |
Sustainable Foodservice Packaging Market Analysis by Mordor Intelligence
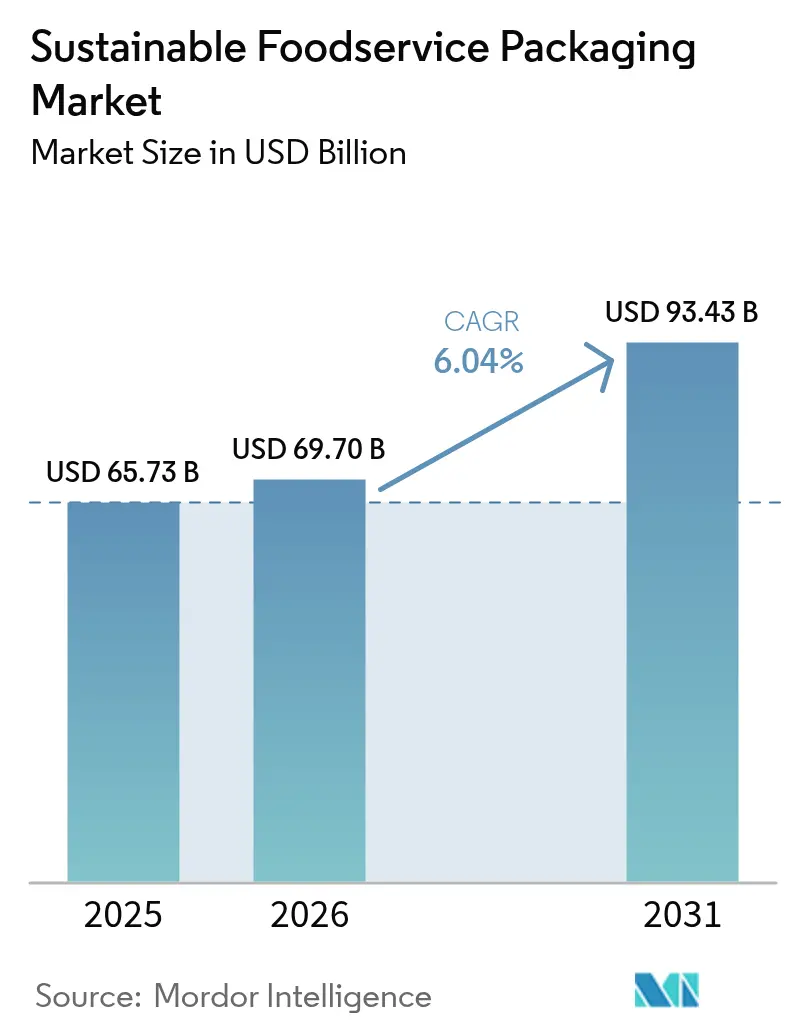
The sustainable foodservice packaging market size is expected to grow from USD 65.73 billion in 2025 to USD 69.7 billion in 2026 and is forecast to reach USD 93.43 billion by 2031 at 6.04% CAGR over 2026-2031. Regulatory bans on single-use plastics, corporate ESG mandates, and breakthroughs in bio-based barrier coatings continue to steer demand away from conventional substrates toward renewable, recyclable, and compostable solutions. Intensifying consolidation exemplified by the pending all-stock combination of Amcor and Berry Global signals a scaling race aimed at lowering the still-high price premium of eco-friendly formats through R&D synergies and purchasing leverage. Recycled paper and board retained the highest sustainable foodservice packaging market share at 41.24% in 2024, while polyhydroxyalkanoates (PHA) led growth at an 8.34% CAGR because of their certified marine biodegradability. Regionally, Europe accounted for 38.34% of 2024 revenue thanks to the EU Packaging and Packaging Waste Regulation, yet Asia-Pacific delivered the swiftest expansion at 8.32% CAGR on the back of composting-infrastructure build-outs and standardized sourcing rules among multinational foodservice chains
Key Report Takeaways
- By material type, recycled paper and board captured 40.78% of sustainable foodservice packaging market share in 2025, whereas PHA is forecast to scale at an 8.21% CAGR through 2031.
- By product type, trays and bowls commanded 37.85% of the sustainable foodservice packaging market size in 2025, with cups and lids projected to grow at 7.5% CAGR to 2031.
- By packaging format, rigid designs led with a 59.74% revenue share in 2025, while flexible formats are expected to post a 7.66% CAGR between 2026-2031.
- By end user, quick-service restaurants held 46.88% of 2025 demand, and hospitality and leisure is set to advance at a 6.98% CAGR through 2031.
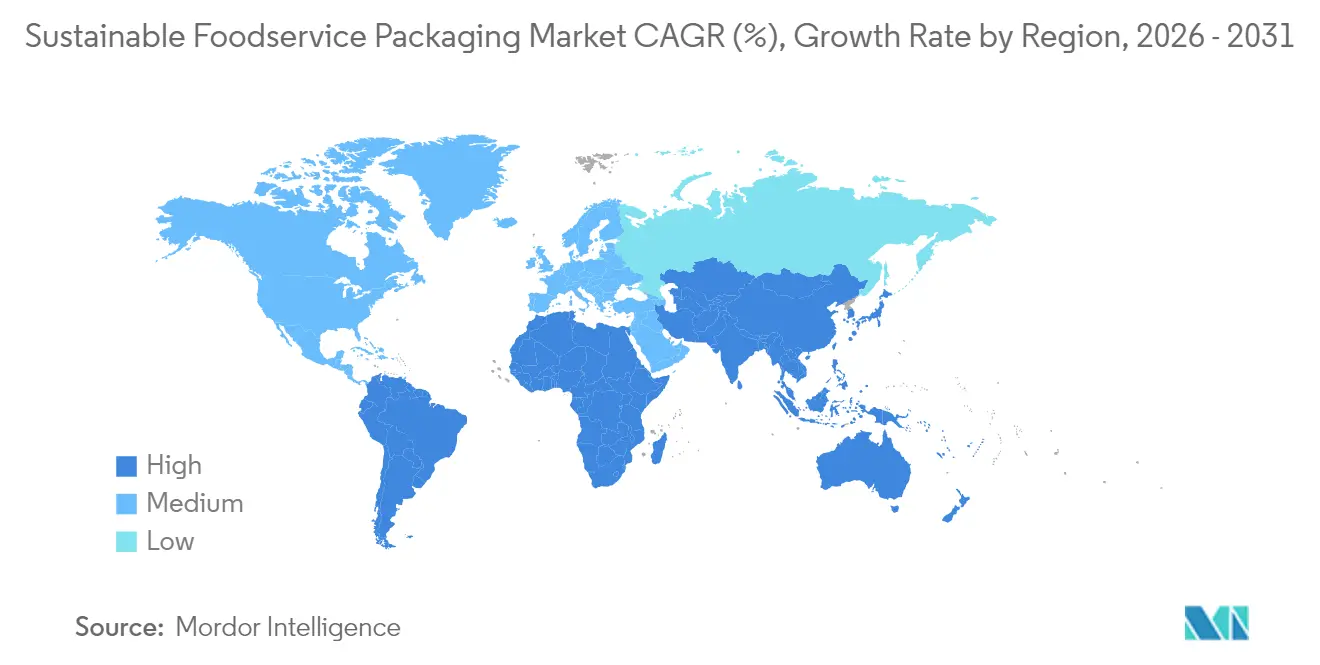
- By geography, Europe maintained a 37.92% revenue lead in 2025, and Asia-Pacific is anticipated to accelerate at an 8.18% CAGR during the forecast 2031.
Note: Market size and forecast figures in this report are generated using Mordor Intelligence’s proprietary estimation framework, updated with the latest available data and insights as of 2026.
Market Trends and Insights
Drivers Impact Analysis of Sustainable Foodservice Packaging Market*
| Driver | (~) % Impact on CAGR Forecast | Geographic Relevance | Impact Timeline |
|---|---|---|---|
| Surge in online food-ordering and delivery platforms | +1.8% | Global, with early gains in North America, Europe, APAC core | Medium term (2-4 years) |
| Stringent bans on single-use plastics and styro-foam | +2.1% | EU, North America, spill-over to APAC | Short term (≤ 2 years) |
| Corporate ESG commitments accelerating sustainable procurement | +1.5% | Global, concentrated in North America and EU | Medium term (2-4 years) |
| Advances in bio-based barrier coatings improving shelf-life | +0.9% | Global | Long term (≥ 4 years) |
| Expansion of municipal composting infrastructure in tier-1 cities | +0.7% | North America, EU, APAC core cities | Medium term (2-4 years) |
| Blockchain-enabled traceability for recycled content verification | +0.3% | Global, early adoption in EU, North America | Long term (≥ 4 years) |
| Source: Mordor Intelligence | |||
Surge in Online Food-Ordering and Delivery Platforms
Rapid rise of aggregator apps boosted take-out volumes, funneling unprecedented demand for standardized fiber-based trays, bowls, and insulated wraps that preserve product integrity during longer delivery windows. McDonald’s disclosed procurement of 1,080,710 metric tons of guest packaging in 2024, noting 86.7% progress toward 100% renewable, recycled, or certified inputs, a milestone magnified across thousands of franchise outlets. Concentrated ordering volumes give converters the scale needed to amortize investments in dry-molded fiber and PHA lines, thereby eroding the 15-40% cost premium over plastic alternatives
Stringent Bans on Single-Use Plastics and Styrofoam
California’s SB 54 and the EU Packaging Regulation impose phased reduction and recycled-content quotas, incentivizing rapid “paperization” in cutlery, straw, and foam-replacement niches. McDonald’s eliminated intentionally added PFAS from 99.5% of guest packaging by late-2024, beating statutory deadlines and illustrating first-mover supplier advantages in regulatory compliance. Paper products, exempt from some recycled-content mandates until 2030, enjoy a demand tailwind that offsets cost headwinds tied to virgin-fiber scarcity.
Corporate ESG Commitments Accelerating Sustainable Procurement
Marriott’s Serve 360 initiative, rolled out globally in 2024, stipulates that all meetings and events receive carbon-and-waste impact reports, pushing hotels toward compostable buffet ware and recyclable grab-and-go formats. Host Hotels and Resorts achieved 76% landfill diversion across major renovations in 2024, while requiring annual sustainability training for 100% of direct supplier. Such mandates create locked-in demand signals that encourage packaging converters to scale renewable capacity and introduce blockchain-backed chain-of-custody audits.
Advances in Bio-Based Barrier Coatings Improving Shelf Life
A 2024 Nature Communications study reported bio-sourced thermoplastic elastomers with tensile strength surpassing 29.7 MPa and 99% chemical recyclability, solving historical moisture and grease-resistance gaps. Starbucks and Huhtamaki piloted industrially compostable fiber cups in the U.K., confirming that the new coatings withstand condensation and ice migration comparable to polyethylene-lined cups. As patent protections lapse and licensing models mature, smaller converters gain access to these resins, broadening addressable markets for hot-fill and high-grease applications.
Restraints Impact Analysis of Sustainable Foodservice Packaging Market*
| Restraint | (~) % Impact on CAGR Forecast | Geographic Relevance | Impact Timeline |
|---|---|---|---|
| High price premium versus conventional alternatives | -1.2% | Global | Short term (≤ 2 years) |
| Functional performance gaps under high heat / grease | -0.8% | Global | Medium term (2-4 years) |
| Supply-chain volatility for agro-fiber residues | -0.6% | Global, concentrated in agricultural regions | Medium term (2-4 years) |
| Regulatory scrutiny of PFAS and other barrier chemicals | -0.4% | North America, EU | Short term (≤ 2 years) |
| Source: Mordor Intelligence | |||
High Price Premium versus Conventional Alternatives
Plant-based polymers and certified fibers often cost 15-40% more than commodity plastics, squeezing QSR margins in inflationary climates. Amcor’s planned merger with Berry Global projects USD 650 million in annual synergies aimed at trimming unit costs, a move expected to narrow price gaps within 24 months. Bulk-buying alliances between franchise chains and hospitality groups further temper premiums by guaranteeing multi-year offtake volumes.
Functional Performance Gaps under High Heat or Grease
Pizza, fried-food, and hot-beverage formats still expose material weaknesses in bio-based solutions, risking leaks and flavor migration. Starbucks is stress-testing fiber cold cups across U.K. stores, paying special attention to structural rigidity and condensation control during extended dwell times. Until barrier chemistries mature beyond pilot scale, certain niches will remain tethered to multilayer structures that complicate recycling and composting pathways.
*Our forecasts treat driver/restraint impacts as directional, not additive. The impact forecasts reflect baseline growth, mix effects, and variable interactions.
Sustainable Foodservice Packaging Market Segment Analysis
By Material Type:
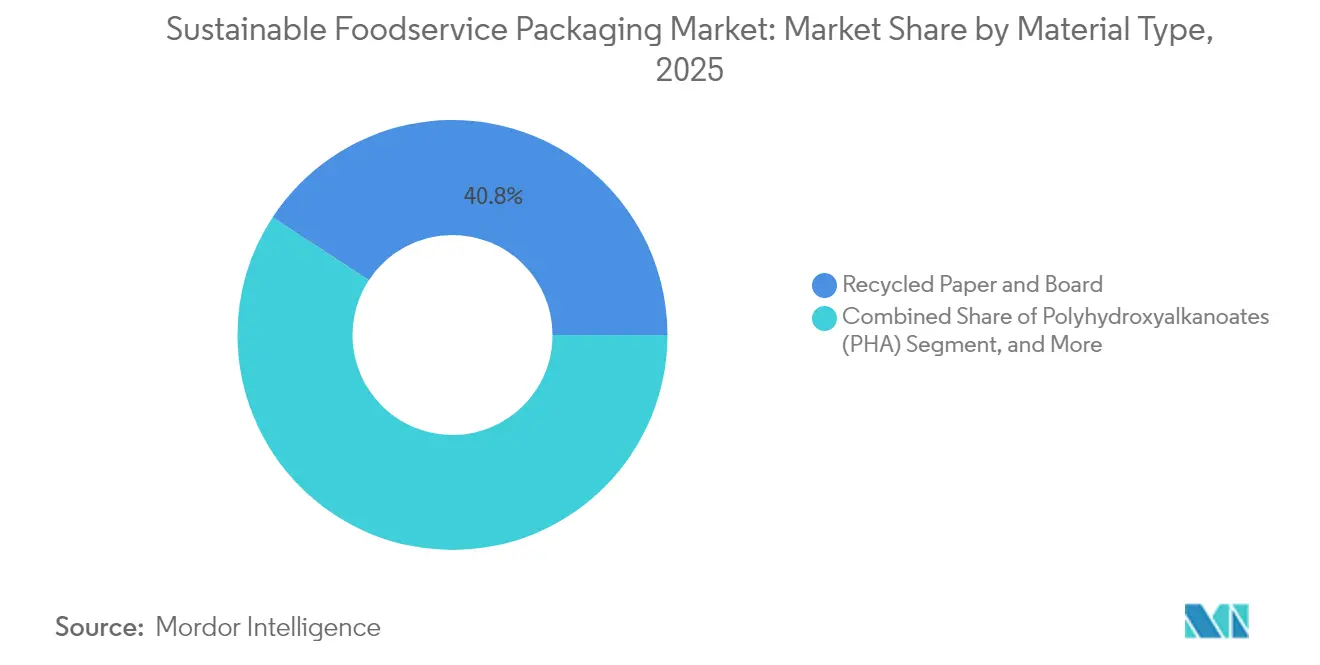
Paper Dominance Meets PHA MomentumRecycled paper and board claimed 40.78% sustainable foodservice packaging market share in 2025 on the back of mature supply chains and temporary regulatory exemptions for recycled content, locking in volume for sandwich wraps, clamshells, and salad bowls. The segment also benefits from Metsä-Amcor’s Muoto molded-fiber launch, a rigid format that pairs high-barrier film with fiber shells to achieve over 80% recyclability scores. Polyhydroxyalkanoates, while commanding a smaller base, are forecast to outpace all rivals at an 8.21% CAGR because of verified marine biodegradability that aligns with global anti-litter narratives.
Bagasse and other agro-fibers face weather-linked yield volatility, pressing converters to invest in drying and warehousing to secure year-round feedstock. Polylactic acid (PLA) enjoys brand familiarity yet remains constrained by industrial composting availability. Recycled PET blends rely on mass-balance chain-of-custody audits to legitimate recycled-content claims, while molded-fiber pulp receives capacity boosts from Dart Container’s dry-molded fiber line in Michigan, which operates 10 times faster than legacy forming technologies.



By Product Type:
Cups and Lids Capture Beverage UpsideTrays and bowls held the largest slice of the sustainable foodservice packaging market size 37.85% in 2025 because they are the default choice for meal kits, salads, and entrée deliveries that demand leakproof rigidity and stackability. McDonald’s piloted renewable-coated salad boxes across parts of Europe, underlining the segment’s dependency on fiber substrates. Conversely, cups and lids are projected to pace the field with 7.5% CAGR through 2031 as cold-drink volumes climb in hot-weather regions and coffee culture spreads into tier-two Asian cities, prompting Huhtamaki to triple fiber-lid capacity in Northern Ireland by late-2024.
Corrugated cartons profit from “paperization” in e-commerce food kits, while clamshells scramble to meet evolving EPS bans. Pouches and sachets are exploring high-bio-content films for sauces and condiments, and niche applications such as OxBarrier’s oxygen-scavenging coffee capsules highlight the migration of compostable solutions into premium beverage service
By Packaging Format:
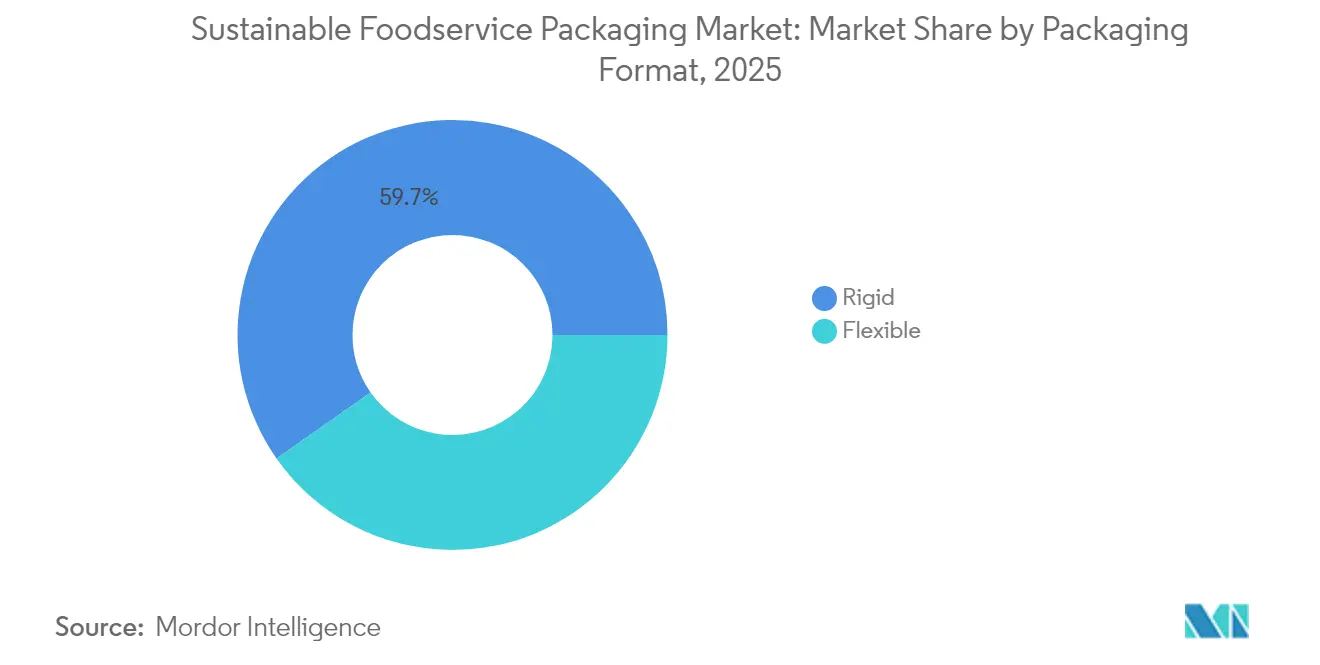
Flexible Lines Race AheadRigid solutions commanded 59.74% of sustainable foodservice packaging market size in 2025 thanks to inherent protective strength for hot entrées, baked goods, and microwave reheat formats. However, flexible packages will accelerate at 7.66% CAGR between 2026-2031, driven by thinner gauges, drop-in bio-barriers, and reduced logistics footprints that translate to lower transport-emission intensities. McDonald’s Belgian pilot replaced multi-material sachets with single-layer fiber wraps, demonstrating real-world viability for compostable flexibles.
Film converters now wield solvent-free laminators that apply water-based coatings suitable for in-store collection streams, while advances in tie-layer chemistries let post-consumer resin reach food-contact purity thresholds. Shared production platforms handle both rigid cartons and flexible films, optimizing asset utilization and supply resilience.
By End User:
Hospitality Leads Growth CurveQuick-service restaurants secured 46.88% of sustainable foodservice packaging market share in 2025 on structural procurement concentration that sustains multi-million-unit orders for standardized fiber trays and bio-PP cups. The hotel and leisure channel will nonetheless notch a 6.98% CAGR through 2031 as guests reward brands that publicize waste-diversion metrics and carbon transparency. Marriott’s meeting-impact dashboards quantify landfill avoidance and water savings, nudging event planners towards compostable buffet ware and recycled-content boxed-lunch wraps.
Full-service restaurant chains juggle aesthetic plating expectations with toxicity scrutiny around inks and varnishes, whereas institutional catering units exploit centralized kitchens to pilot mono-substrate pouch refills. Emerging channels ghost kitchens, vending micro-markets, and airline lounges are pivoting to lightweight fiber pods that shrink cargo weights and greenhouse-gas intensities.
Geography Analysis
Europe Sustainable Foodservice Packaging Market
Europe dominated 2025 revenue with a 37.92% share of the sustainable foodservice packaging market, reflecting decades-old curbside recycling schemes and looming mandates under the EU Packaging and Packaging Waste Regulation. Compostable waste pickup in Scandinavia and Benelux cities enables cost-neutral switchovers to bagasse trays and PLA cutlery. Moreover, paper-based items enjoy an interim reprieve from recycled-content quotas, encouraging rapid fiber substitution before the 2030 deadline.
The Americas, APAC and MEA Sustainable Foodservice Packaging Market
Asia-Pacific logged the highest growth rate 8.18% CAGR propelled by megacity bans on foam clamshells, escalating health-conscious delivery culture, and capital inflows into composting facilities in China’s tier-one hubs and India’s smart-city corridors. The region also houses abundant agro-fiber feedstock such as bagasse and rice husk, but logistic fragmentation inflates collection costs during off-harvest seasons. North America, while trailing Europe in penetration, benefits from state-level legislation like California SB 54 and expanding organics diversion mandates that direct subsidies toward compostable liners and molded-fiber lids. Local material conversion typified by Dart’s dry-molded line in Michigan shortens lead times and cushions currency-risk exposure in a strong-USD scenario. South America leverages surplus bagasse capacity from sugar mills, whereas Middle East and Africa adoption remains nascent because of limited organic-waste processing assets and higher import dependence for certified fiber reels.

Regulatory Landscape
Compliance remains closely tied to circularity-focused requirements for sustainable foodservice packaging. In the European Union, the Packaging and Packaging Waste Regulation, Regulation (EU) 2025/40, entered into force on 11 February 2025 and becomes applicable from 12 August 2026. It tightens sustainability, labeling, and substances-of-concern obligations for packaging placed on the EU market, including specific restrictions on PFAS in food-contact applications. The European Commission is also advancing a set of secondary (delegated and implementing) acts in 2026 that set out technical rules, which increases the need for documented material composition and harmonized labeling readiness across multinational foodservice supply chains.
In North America, food-contact compliance continues to rely on regulator-managed positive lists and authorization pathways, with the US Food and Drug Administration maintaining the Inventory of Effective Food Contact Substance (FCS) Notifications (registry updated as of 31 May 2026). In addition to federal controls, state-level rules affecting packaging claims and labeling practices, including recyclability labeling requirements, influence how converters and brands substantiate recycled content and end-of-life pathways for fiber, compostables, and mono-material plastics used in foodservice.
Value Chain Analysis
The value chain covers feedstock and polymer inputs, conversion and functionalization, distribution to foodservice operators, and end-of-life collection and processing. Upstream, certified fiber supply and bio-based inputs flow from agricultural and commodity suppliers into bio-resin producers, including NatureWorks, TotalEnergies Corbion, and BASF, as well as into fiber and pulp ecosystems. Midstream converters and brand owners transform these inputs into cups, lids, trays, wraps, and sachets through forming, extrusion, coating, and printing steps that increasingly prioritize PFAS-free barrier chemistries and traceable recycled content. Downstream, large buyers such as quick-service restaurants and hospitality groups concentrate demand and can standardize specifications across regions, shaping converter investments in high-throughput molded-fiber, coated-paper, and mono-material flexible lines.
The main constraint sits at the product-design to end-of-life interface. Limited industrial composting and uneven collection sorting can reduce the realized circularity of compostables and multi-layer structures. With the EU PPWR applicability date approaching (12 August 2026), documentation requirements are likely to tighten across tiers, driving closer supplier qualification, declarations of conformity for packaging materials, and more consistent labeling alignment. At the same time, it also encourages redesign toward recyclable mono-material structures and scalable fiber formats that fit existing curbside pathways.
Competitive Landscape
Amcor’s agreement to merge with Berry Global will create a USD 24 billion revenue powerhouse operating 400 plants in more than 140 countries, targeting USD 650 million in annual synergies and a combined R&D budget of USD 180 million earmarked for sustainable foodservice packaging market innovation. Dart Container’s licensing of PulPac’s dry-molded fiber technology highlights a race to deploy high-speed, low-carbon assets that slash water usage by up to 90% relative to wet molding. [1]Dart Container, “Dry-Molded Fiber Line Announcement,” dartcontainer.comConcurrently, Metsä Group joined forces with Amcor to commercialize Muoto, a three-dimensional molded-fiber tray incorporating high-barrier film that achieves over 80% recyclability and aims for full compostability by late-2025.[2]Packaging Insights, “Metsä-Amcor Muoto Launch,” packaginginsights.com
Huhtamaki completed a Northern Ireland capacity expansion for fiber lids in October 2024, a strategic hedge that positions the firm to satisfy surging drink-on-the-go needs stemming from the U.K.’s plastic-tax escalation.[3]Huhtamaki, “Fiber-Lid Capacity Expansion,” huhtamaki.com OxBarrier’s September 2025 license program for oxygen-scavenging coffee capsules exemplifies IP-driven revenue diversification and underscores a trend toward specialty applications inside the sustainable foodservice packaging market. Competitive intensity centers on the ability to furnish PFAS-free barrier chemistries, verified recycled-content traceability, and price-competitive PHA formulations while maintaining global supply continuity.
Sustainable Foodservice Packaging Industry Leaders
Amcor Plc
Mondi PLC
Sealed Air Corporation
Tetra Pak International SA
Huhtamaki oyj
- *Disclaimer: Major Players sorted in no particular order
Sustainable Foodservice Packaging Market Companies Covered in this Report
- Amcor plc
- Huhtamaki Oyj
- Smurfit WestRock
- Sealed Air Corporation
- Mondi plc
- Tetra Pak International SA
- Sonoco Products Company
- Winpak Ltd.
- Dart Container Corporation
- Graphic Packaging Holding Company
- Novolex Holdings LLC
- Pactiv Evergreen Inc.
- Sabert Corporation
- Genpak LLC
- BioPak Pty Ltd.
- Vegware Ltd.
- Eco-Products Inc.
- Earthpack (Advanced Container Print)
- Amhil North America

Market Opportunities and Future Outlook
Near-term opportunities center on scaling regional supply and simplifying material systems to satisfy tighter rules on chemicals of concern and recyclability labeling. The EU PPWR milestone, applicable from 12 August 2026, is an immediate pull for PFAS-compliant food-contact barriers, harmonized labeling, and technically documented material composition. This favors suppliers able to provide verified chain-of-custody data and standardized product portfolios for multinational foodservice operators.
Capacity additions and multi-material manufacturing platforms also create practical routes to improve cost and lead times, particularly when converters locate production closer to demand centers. In 2026, NatureWorks opened a fully integrated Ingeo biopolymer manufacturing facility in Thailand with 75,000 metric tons of annual capacity. NantBiorenewables announced an expansion in Gadsden, Alabama, adding multi-material platforms (including compostable bioplastics) and thermoforming capacity. In India, Pakka Limited announced an investment in an Ayodhya facility focused on increasing compostable packaging output. Together with converter programs shifting toward recyclable mono-materials and fiber-based solutions, these actions broaden sourcing options for foodservice brands balancing regulatory compliance and the 15-40% price premium challenge.
Recent Industry Developments in Sustainable Foodservice Packaging Market
- July 2026: Amcor commenced a 7,000-square-meter expansion at its flexible packaging facility in Dongguan, China. The project adds capacity and operational scale in a major converting hub, supporting shorter lead times for sustainable flexible formats used in foodservice and adjacent applications.
- May 2026: Amcor announced the commercial availability of its PP Revolution portfolio of recycle-ready polypropylene dip cups and lidding for foodservice. The launch expands mono-material options that align with recyclability goals while preserving performance requirements for sauces and condiments in high-volume quick-service channels.
- October 2024: Huhtamaki expanded fiber-lid capacity at its Lurgan, Northern Ireland site to support rising demand for plastic-free drink lids across the UK and Ireland. The added capacity improves supply reliability for beverage-service operators shifting away from conventional plastic tops under retailer and brand sustainability requirements.


Sustainable Foodservice Packaging Market Report Scope and Research Methodology
Market Definition and Coverage
This market covers packaging used by foodservice operators that is designed to reduce environmental impact, mainly through recycled content, fiber based formats, compostable materials, or improved end of life outcomes. Values are captured as revenues generated from selling these packaging products across major regions.
Scope exclusions: This sizing does not count durable foodservice equipment, bulk transport packaging, or non packaging foodservice supplies such as napkins and cleaning consumables.
Segments Covered in This Report
- By Material Type
- Recycled Paper and Board
- Bagasse and Other Agro-fibers
- Polylactic Acid (PLA)
- Polyhydroxyalkanoates (PHA)
- Recycled PET and rPET Blends
- Molded Fiber Pulp
- By Product Type
- Corrugated Boxes and Cartons
- Trays and Bowls
- Clamshells
- Cups and Lids
- Pouches and Sachets
- Other Product Types
- By Packaging Format
- Rigid
- Flexible
- By End User
- Quick Service Restaurants (QSR)
- Full-Service Restaurants (FSR)
- Institutional Catering
- Hospitality and Leisure
- Other End Users
- By Geography
- North America
- United States
- Canada
- Mexico
- South America
- Brazil
- Argentina
- Chile
- Rest of South America
- Europe
- Germany
- United Kingdom
- France
- Italy
- Spain
- Rest of Europe
- Asia-Pacific
- China
- Japan
- India
- South Korea
- Australia
- Rest of Asia-Pacific
- Middle East and Africa
- Middle East
- Saudi Arabia
- United Arab Emirates
- Turkey
- Rest of Middle East
- Africa
- South Africa
- Nigeria
- Kenya
- Rest of Africa
- Middle East
- North America
Data Sources, Market Sizing, and Validation
Desk Research
Desk work started with policy and waste data so the demand pool was not built on opinions. We referred to public sources such as the US EPA, Eurostat, the European Commission policy pages (including packaging and single use rules), UN Comtrade trade statistics, and FAO food supply indicators to understand packaging flows and end market exposure.
To ground the model in business reality, we also reviewed company annual reports, sustainability disclosures, investor presentations, and packaging association updates, plus reputed press for capacity additions and material substitution trends. Where needed, paid subscriptions for company financials and intelligence, patent databases, and shipment level import and export data were used to validate key assumptions like material mix shifts and regional trade dependence. The sources listed here are illustrative only, and many other public and paid references were used for data collection, cross checks, and clarification.
Primary Interviews and Surveys
Primary inputs were collected through expert interviews and structured surveys with packaging converters, raw material stakeholders, distributors, and foodservice buyers who influence specification choices. Because the market is global, we covered APAC, EMEA, and the Americas so regulation timing, price sensitivity, and adoption pace could be compared, then translated back into the model assumptions.
The respondent input was used to tighten the material and format mix by region, and to confirm where buyers typically switch from conventional materials to recycled content, molded fiber, and compostable offerings.
Distribution of primary research fieldwork respondents
| Company type | Respondent position | Region |
|---|---|---|
| Top tier: 29% | CXOs: 14% | APAC: 49% |
| Mid tier: 50% | Functional/Unit leaders: 34% | EMEA: 30% |
| Smaller Players: 21% | Managers: 52% | Americas: 21% |
Market-Sizing & Forecasting
Sizing was first shaped using a top-down approach where foodservice packaging demand is reconstructed from a mix of food away from home activity, packaged meal and beverage servings, and regional packaging intensity. Once the demand pool was set, it was split by material choices and format preferences that are common in foodservice, and then priced using realistic average selling price ranges by format.
Key inputs that were tracked include the pace of single use plastic restrictions, paper and molded fiber capacity additions, biopolymer availability and price spreads, recycled content targets, and QSR and delivery led order growth. When the top-down build produced totals that looked too high or low, we ran selective bottom-up checks, including sampling converter revenue exposure to foodservice and channel checks for high volume items like cups, clamshells, and trays, then applied ASP to volume sanity tests. Gaps in bottom-up visibility were handled by using regional proxies and adjusting with interview feedback so the totals stayed realistic.
For forecasting, scenario analysis was used around regulation enforcement, feedstock costs, and substitution speed, then the mid case was anchored to expert consensus on adoption curves. Assumptions were kept simple and repeatable so updates can be done consistently as new capacity, pricing, or policy signals appear.
Data Validation & Update Cycle
Outputs were validated through triangulation across independent signals such as trade flows, policy timelines, price movements, and capacity announcements, before the final numbers were signed off. Variance checks are run at region and material level, and any large jumps trigger a review of drivers and a recheck of inputs that may be time shifted.
A second analyst review is completed to confirm calculations, unit consistency, and that growth trends match the stated market narrative. Reports are refreshed annually, and interim updates are done when a material event happens, such as a major regulation change or a large capacity move. Before delivery, the model is rerun with the latest available inputs so clients receive a current view.
Mordor Intelligence's Sustainable Foodservice Packaging Market Size Measured Against Other Published Estimates
Published market sizes for sustainable foodservice packaging can differ more than expected, even when the topic name looks the same. The main reasons usually come from what each publisher counts as sustainable, the year used for sizing, and how pricing and adoption are carried forward in the forecast.
Some estimates take a wider view by mixing in adjacent sustainable food packaging used outside foodservice, and sometimes they assume faster material substitution with limited cross checks on volumes. In the Mordor Intelligence model, only foodservice packaging formats are counted, and totals are tied back to foodservice activity indicators and format level ASP ranges that were revalidated through primary calls.
Benchmark comparison
| Source | Market Size | Gaps in Research Methodology |
|---|---|---|
| Mordor Intelligence | USD 69.70 B (2026) | |
| Global Consultancy A | USD 75.87 B (2026) | Uses a higher 2026 value that likely reflects a broader inclusion of sustainable packaging used beyond foodservice channels, and it appears to apply a more aggressive growth path to 2034 without showing the volume and pricing checks used. |
| Industry Publisher B | USD 63.93 B (2025) | Reports a lower base year value and a different study window, and the published scope summary suggests limited material and format detail, which can undercount premium priced compostable and molded fiber formats in regions with faster regulation driven adoption. |
The spread across sources is mainly explained by scope width and the way base years and pricing progressions are handled. Our approach stays traceable because the size is built from clear demand signals, then pressure tested with supplier and buyer inputs before forecasting assumptions are finalized.


Key Questions Answered in the Report
How big is the Sustainable Foodservice Packaging Market?
The Sustainable Foodservice Packaging Market size is worth USD 69.7 billion in 2026, growing at an 6.04% CAGR and is forecast to hit USD 93.43 billion by 2031.
What is the current global value of sustainable foodservice packaging?
The market is valued at USD 69.7 billion in 2026 and is expected to reach USD 93.43 billion by 2031.
Which material leads in adoption across restaurants and hotels?
Recycled paper and board currently dominates with a 40.78% market share in 2025 because of cost competitiveness and regulatory support.
Which product category is expanding the fastest?
Cups and lids are projected to grow at a 7.5% CAGR through 2031, driven by the boom in cold beverages and coffee culture.
How are corporate ESG goals influencing procurement decisions?
Hotel chains and QSRs now require renewable or recycled inputs, pushing suppliers to scale fiber-based and bio-polymer lines and adopt traceability tools.
Which region is expected to log the highest growth through 2031?
Asia-Pacific will post the fastest expansion at 8.18% CAGR due to new composting infrastructure and anti-plastic regulations.
What are the main cost hurdles for switching to eco-friendly packaging?
Price premiums of 15-40% over conventional plastics remain the chief barrier, though industry consolidation and technological advances are narrowing the gap.
Page last updated on:


 Your data is secure and never sold or shared.


