Plastic Free Packaging Market Size and Share
Market Overview
| Study Period | 2019 - 2030 |
|---|---|
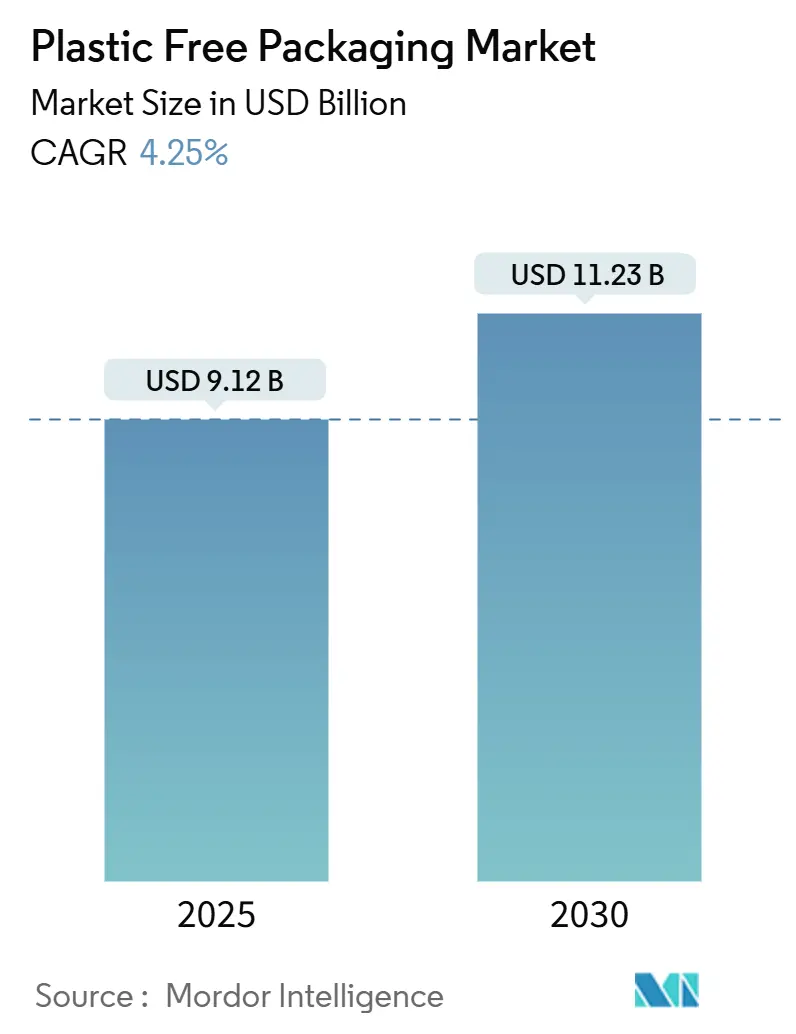
| Market Size (2025) | USD 9.12 Billion |
| Market Size (2030) | USD 11.23 Billion |
| Growth Rate (2025 - 2030) | 4.25% CAGR |
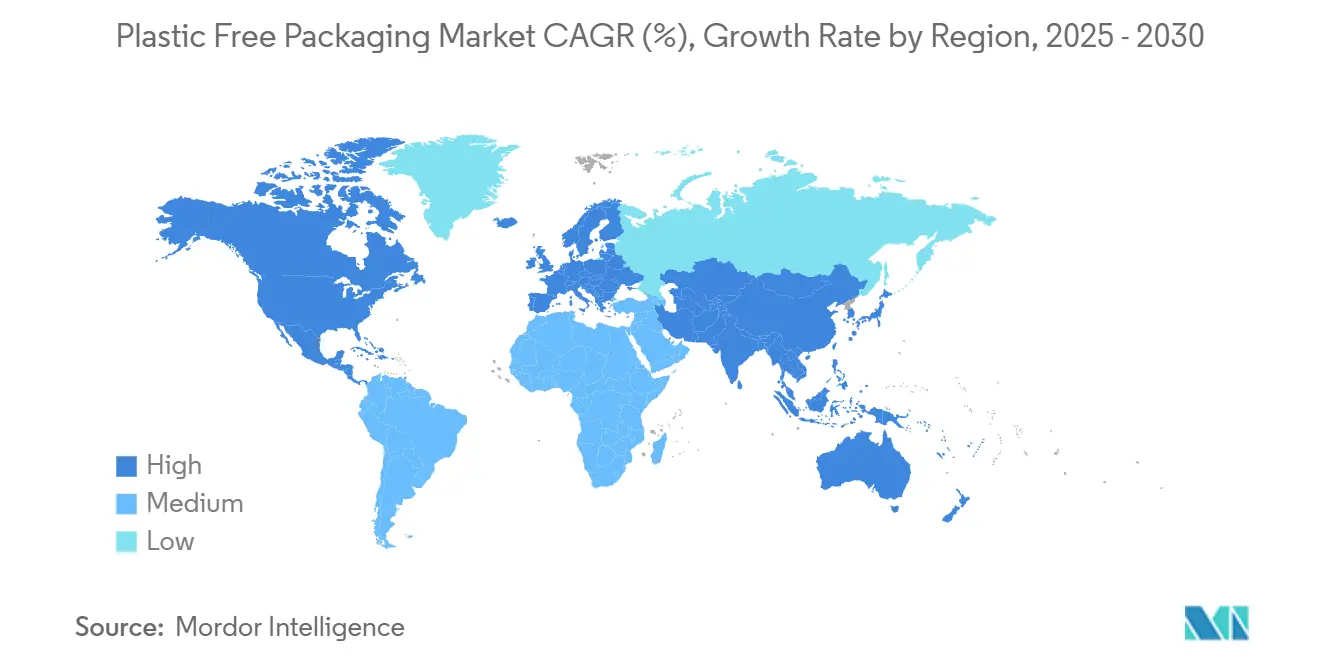
| Fastest Growing Market | Asia Pacific |
| Largest Market | Europe |
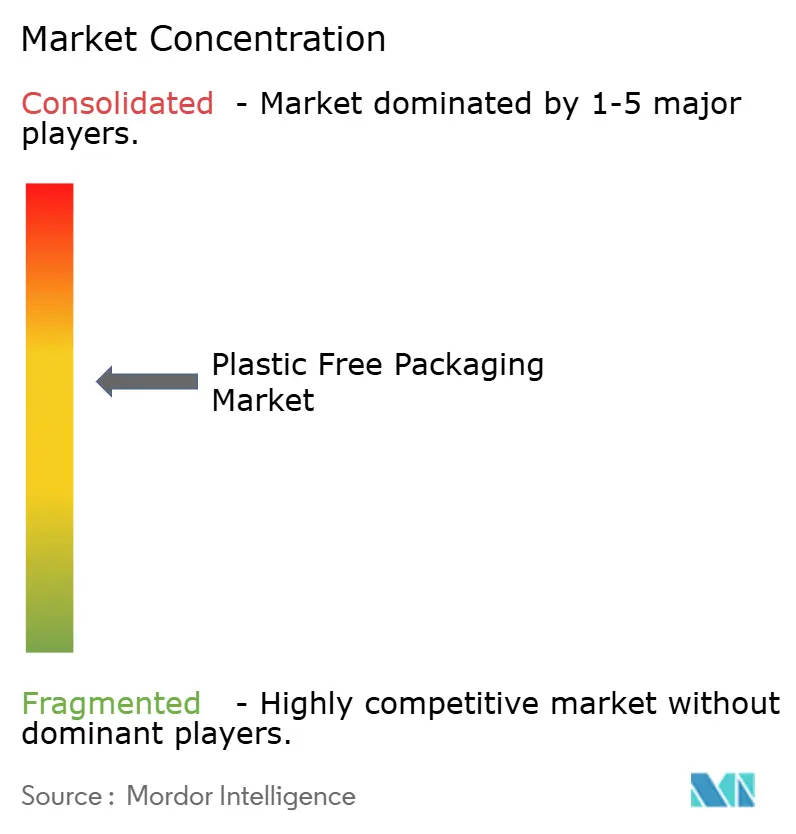
| Market Concentration | Medium |
Major Players *Disclaimer: Major Players sorted in no particular order Image © Mordor Intelligence. Reuse requires attribution under CC BY 4.0. | |
Plastic Free Packaging Market Analysis by Mordor Intelligence
The plastic-free packaging market size reached USD 9.12 billion in 2025 and is projected to reach USD 11.23 billion by 2030, growing at a 4.25% CAGR. Demand shifts from regulatory compliance to brand differentiation as extended producer responsibility mandates and prohibitions on single-use plastics make fiber-based, compostable, and refillable formats mandatory in many jurisdictions.[1]European Commission, “Packaging and Packaging Waste Regulation,” ec.europa.eu High-barrier paper technologies now match plastic’s performance in terms of oxygen and grease resistance, opening up fresh food, pharmaceuticals, and cosmetics to non-plastic formats. Retail “paperization” programs accelerate the adoption of flexible solutions within e-commerce distribution, while corporate net-zero commitments embed lifecycle carbon metrics into procurement. Infrastructure gaps and 15-50% price premiums limit speed, but vertically integrated suppliers hedge pulp volatility and certification costs, sustaining steady growth.
Key Report Takeaways
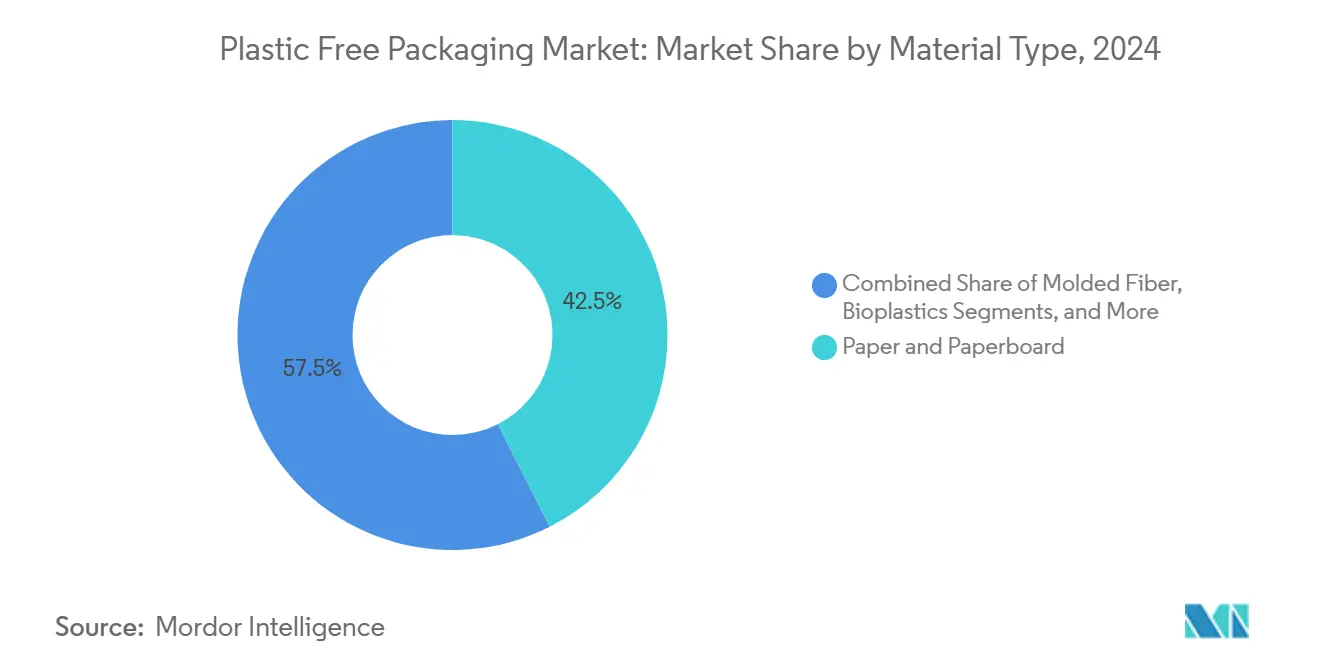
- By material, the paper and paperboard segment captured 42.53% of the Plastic Free Packaging Market share in 2024.
- By packaging format, the Plastic Free Packaging Market size for flexible formats is projected to grow at a 5.39% CAGR between 2025–2030.
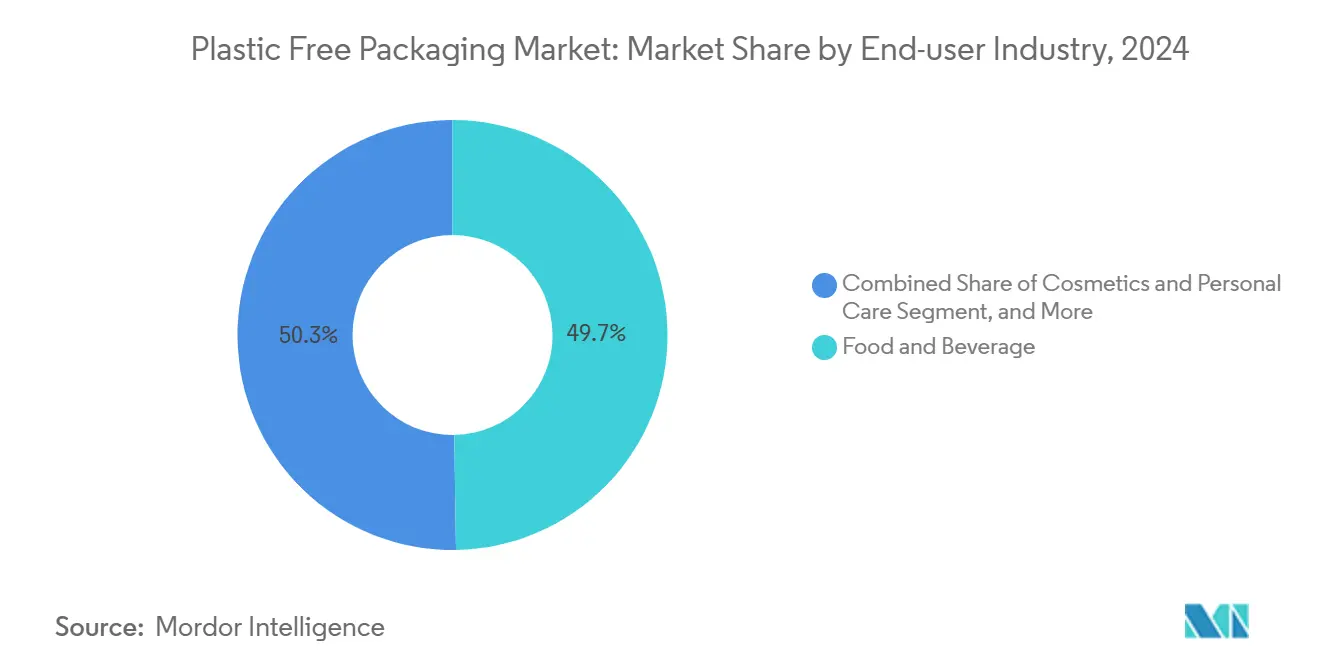
- By end-user industry, the food and beverage segment captured 49.74% of the Plastic Free Packaging Market revenue in 2024.
- By geography, Europe captured 31.48% of the Plastic Free Packaging Market share in 2024.
Global Plastic Free Packaging Market Trends and Insights
Drivers Impact Analysis*
| Driver | (~) % Impact on CAGR Forecast | Geographic Relevance | Impact Timeline |
|---|---|---|---|
| Surge in extended producer responsibility and single-use plastic bans | +1.2% | Global, earliest in European Union, California, Canada | Short term (≤ 2 years) |
| Corporate net-zero packaging commitments | +0.8% | Global, strongest across North America and European Union multinationals | Medium term (2-4 years) |
| Rapid expansion of municipal composting capacity | +0.6% | North America and European Union core, emerging Asia-Pacific cities | Medium term (2-4 years) |
| Break-through in high-barrier fiber and mono-material technology | +0.9% | Global, R and D hubs in European Union, North America, Japan | Long term (≥ 4 years) |
| Retailer shift to “paperization” and refill formats | +0.5% | Global e-commerce nodes, early urban markets | Short term (≤ 2 years) |
| AI-enabled design minimizing material intensity | +0.3% | Global, tech-forward economies | Long term (≥ 4 years) |
| Source: Mordor Intelligence | |||
Surge in extended producer responsibility and single-use plastic bans
California's SB 54 mandates a 65% reduction in plastic packaging by 2032, Canada’s federal registry obliges producers to report plastic flow, and the European Union targets a 90% bottle collection rate by 2029. Brands harmonize specifications globally to avoid multi-regime complexity, lifting baseline demand for fiber, molded pulp, and certified compostable resins. Penalties for non-compliance outweigh the costs of using alternative substrates, pushing even cost-sensitive segments toward plastic-free packaging market solutions.
Corporate net-zero packaging commitments
Fortune 500 firms pledged USD 47 billion in 2024, with Unilever aiming for fully reusable, recyclable, or compostable packs by 2025 and Nestlé allocating CHF 2 billion (USD 2.18 billion) through 2030.[2]Nestlé, “Sustainability Report 2024,” nestle.com Scope 3 carbon now features in mandatory climate disclosures and European sustainability reporting. Suppliers demonstrating verifiable lifecycle carbon reductions gain price security and multi-year contracts, deepening the strategic role of the plastic-free packaging market within procurement scorecards.
Rapid expansion of municipal composting capacity
North American capacity increased by 23% in 2024, thanks to USD 275 million in funding from the Infrastructure Investment and Jobs Act. European Union states injected EUR 1.8 billion (USD 2.0 billion) into organic infrastructure. Early movers secure premium gate fees and anchor supply for certified compostable formats, yet only 185 industrial sites exist in the United States versus 5,000 needed, creating regional supply shortages that favor integrated players with local processing assets.
Break-through in high-barrier fiber and mono-material technology
Water-based coatings from UPM-Michelman and Ahlstrom deliver oxygen transmission below 1 cc/m²/day while retaining recyclability. VTT’s cellulose nano-fiber films reach 99.9% grease resistance. Huhtamaki’s Blueloop mono-material structures enter commercial scale, permitting fiber-based pouches for perishables. These gains expand the addressable plastic-free packaging market beyond dry goods into refrigerated and pharmaceutical channels.
Restraints Impact Analysis*
| Restraint | (~) % Impact on CAGR Forecast | Geographic Relevance | Impact Timeline |
|---|---|---|---|
| Insufficient industrial composting infrastructure | -0.7% | Global, acute in rural and developing regions | Medium term (2-4 years) |
| Higher cost versus legacy plastics | -1.1% | Global, strongest in price-sensitive categories | Short term (≤ 2 years) |
| Certification or green-washing scrutiny is intensifying | -0.4% | Global, strictest in the European Union and California | Short term (≤ 2 years) |
| Feedstock competition with food and land use | -0.6% | Global, concentrated in agricultural commodity zones | Long term (≥ 4 years) |
| Source: Mordor Intelligence | |||
Insufficient industrial composting infrastructure
Certified compostable packs require 140-160 °F forced aeration and moisture control; otherwise, they can contaminate recycling or landfill streams. North American facilities manage 2.3 million tons annually, against a forecast of 8.7 million tons by 2030, and Germany’s 1,100 plants fall short of the 2,800 needed to meet EU circular objectives. Brands risk an ESG backlash if disposal pathways falter, tempering short-term volume growth, although this creates first-mover advantages for operators building capacity.
Higher cost versus legacy plastics
Paper-based trays cost 15% more than PET, molded fiber cushions can be 25% more expensive than expanded polystyrene, and premium bioplastics incur 50% surcharges. Pulp prices swung by 40% in 2024, and third-party certifications can add as much as 8% to the selling price, while also delaying launches by up to a year. The plastic-free packaging market, therefore, rewards integrated players with captive feedstock and scale efficiencies, but pure-play converters may see compressed margins during cost spikes.
*Our forecasts treat driver/restraint impacts as directional, not additive. The impact forecasts reflect baseline growth, mix effects, and variable interactions.
Segment Analysis
By Material Type: Paper Dominance Faces Bioplastics Challenge
Paper and paperboard captured 42.53% of the revenue in 2024, as widespread curbside recycling and consumer familiarity eased adoption. Bioplastics are gaining momentum with a 5.57% CAGR projected through 2030; mono-material PLA and PHA films eliminate multi-layer separation headaches and comply with ASTM D6400. Molded fiber emerged as a replacement for appliance corner pads and mobile phone inserts, displacing expanded polystyrene. Metal retains niche appeal for premium beverages, yet volatile aluminum pricing and high carbon intensity limit share. Emerging substrates, such as seaweed films or mycelium foams, remain at the pilot-scale level due to limited feedstock supply.
The paper’s scale affords pulp suppliers cost leverage, but escalating barrier demands drive R&D spending on nano-cellulose coatings. Bioplastic growth hinges on feedstock availability and regulator acceptance. FiberForm’s stretchable paper, suitable for deep embossing, enables the creation of brand-differentiated shapes without plastic layers. Novamont’s Mater-Bi blends secure FDA food contact nods, opening microwavable convenience meals to compostable wraps. The plastic-free packaging market size for bioplastics will likely mirror breakthrough volumes from snack and dairy multipacks once infrastructure matches collection requirements.


By Packaging Format: Flexible Solutions Gain Momentum
Rigid formats accounted for 43.74% of the 2024 value, primarily driven by molded trays, glass jars, and sturdy board cartons. Nonetheless, flexible packs are expected to post a 5.39% CAGR to 2030, as e-commerce fulfillment increasingly favors weight savings and cubing efficiency. High-barrier paper pouches now match a 12-month shelf life for powdered infant formula, while paper-based bubble downsized fulfillment center plastic air pillows.
Retailers prioritize “ship-in-own-container” designs, trimming secondary boxes and cushioning. ASTM D6868 certified paper-film laminates solve grease leakage in take-out channels, allowing compostable disposal. Pharmaceutical slow adoption keeps blister packs plastic for now; yet, early trials with cellulose-based push-through designs show promise once the moisture barrier meets specification. The plastic-free packaging market share for flexible formats is expected to rise as seal integrity and line-speed compatibility approach parity with those of plastic.
By End-user Industry: Cosmetics Leads Growth Despite Food Dominance
Food and beverage accounted for 49.74% of the volume in 2024; sugar confectionery, fresh produce, and takeaway meals led the conversions. Still, cosmetics and personal care will outpace the market at a 5.73% CAGR: fragrance brands are switching to paper fragrance caps and molded pulp lipstick tubes to reinforce clean beauty narratives. Pharmaceutical change remains a challenge; temperature-sensitive biologics require ultra-low oxygen ingress, but nanocellulose coatings are closing that gap.
Consumer electronics are adopting molded pulp to replace polystyrene foam clamshells, aligning with major OEM emissions goals. E-commerce logistics have extended the demand for cushioning to eliminate loose-fill plastics; Sealed Air’s paper crumple systems have gained ISO 14855 certification, bolstering their life-cycle claims. Ultimately, a heightened willingness to pay among discretionary categories lifts unit margins, underpinning total growth in the plastic-free packaging market.
Geography Analysis
Europe retained its leadership position with a 31.48% share in 2024, driven by the European Union's Packaging and Packaging Waste Regulation, France’s AGEC law, and Germany's deposit-return systems. The bloc boasts a 99% household packaging collection rate and 1,100 composters, enabling brands to widely deploy fiber or compostable products. Yet, energy at EUR 0.25/kWh (USD 0.28/kWh) adds cost headwinds, and exposure to imported pulp magnifies volatility. Asian manufacturers exploit lower power tariffs to challenge price positions.
Asia-Pacific posts the plastic-free packaging market’s steepest 5.47% CAGR through 2030. China’s National Sword ban has spurred domestic capacity in molded pulp, while India’s EPR rule aims to achieve 60% recycling by 2025. Japanese roadmaps toward achieving 60% plastic recovery by 2030 have triggered investments, such as Rengo’s JPY 15 billion (USD 103 million) paper barrier plant.[3]Japan Ministry of Economy, “Circular Economy Roadmap,” meti.go.jp Nonetheless, infrastructure disparity remains: megacities like Shanghai lead, while rural zones rely on landfills, hampering the universal rollout.
North America advances through state actions, California SB 54, Washington compostable labeling, Quebec EPR rollout and USD 275 million federal funding for organics processing. Venture capital of USD 2.8 billion in 2024 backed material startups. Still, cross-border brands navigate patchwork frameworks; harmonized labeling under How2Compost helps but does not supplant varied state laws. Latin America and Middle East and Africa remain nascent but urban population growth invites pilot programs, especially where multinational consumer-goods firms push global sustainability templates.

Competitive Landscape
Moderate concentration characterizes the plastic-free packaging market. Amcor, Mondi, and Smurfit WestRock exploit integrated pulp and converting networks, collectively generating 28% sales. The Smurfit WestRock merger created a USD 20 billion hybrid with a 40-country reach. Specialized bioplastic firms such as Novamont and TotalEnergies Corbion invest in scalable PHA fermentation, partnering with converters for downstream assurance.
Technology differentiation centers on high-barrier coatings: UPM-Michelman’s water-based formula enables curbside recycling; Ahlstrom’s PureBarrier reduces oxygen ingress to below plastic parity; Huhtamaki Blueloop mono-structures streamline laminates. Patent filings for waterborne barrier layers increased 34% in 2024, indicating an escalating arms race. Integrated composting operators, such as Veolia, secure gate-fee revenue and develop closed-loop propositions for brand owners. Pure-play converters lacking feedstock backward integration face compressed spreads when pulp prices spike or certification fees increase.
White space lies in the pharma and industrial fields, where regulation is conservative but margins are high once validated. Seaweed-film innovators negotiate regulatory clearance under FDA food contact and REACH, delaying mass adoption. Nevertheless, partnerships such as Amcor-Nfinite Nanotech nanoscale barrier coatings signal open innovation across incumbents and startups.
Plastic Free Packaging Industry Leaders
Amcor plc
Mondi plc
Smurfit WestRock plc
International Paper Company
Sealed Air Corporation
- *Disclaimer: Major Players sorted in no particular order

Recent Industry Developments
- October 2024: Smurfit WestRock completed its USD 20 billion merger integration, forming the world’s largest paper packaging supplier with expanded sustainable capacity.
- September 2024: Mondi invested EUR 100 million (USD 111 million) in the Štětí mill, adding 150,000 tons of high-barrier paper output for food applications.
- August 2024: International Paper earmarked USD 150 million to lift fiber-based protective packaging throughput across three U.S. plants.
- July 2024: Amcor committed USD 50 million for AmLite recyclable barrier film rollouts in flexible snacks and coffee pouches.


Global Plastic Free Packaging Market Report Scope
| Paper and Paperboard |
| Molded Fiber |
| Bioplastics |
| Glass |
| Metal |
| Other Material Types |
| Rigid Packaging |
| Flexible Packaging |
| Food and Beverage |
| Pharmaceuticals |
| Cosmetics and Personal Care |
| Consumer Goods |
| E-Commerce and Logistics |
| Other End-User Industries |
| North America | United States | |
| Canada | ||
| Mexico | ||
| South America | Brazil | |
| Argentina | ||
| Chile | ||
| Rest of South America | ||
| Europe | United Kingdom | |
| Germany | ||
| France | ||
| Italy | ||
| Spain | ||
| Russia | ||
| Rest of Europe | ||
| Asia-Pacific | China | |
| India | ||
| Japan | ||
| South Korea | ||
| Australia | ||
| Rest of Asia-Pacific | ||
| Middle East and Africa | Middle East | Saudi Arabia |
| United Arab Emirates | ||
| Turkey | ||
| Rest of Middle East | ||
| Africa | South Africa | |
| Nigeria | ||
| Rest of Africa | ||
| By Material Type | Paper and Paperboard | ||
| Molded Fiber | |||
| Bioplastics | |||
| Glass | |||
| Metal | |||
| Other Material Types | |||
| By Packaging Format | Rigid Packaging | ||
| Flexible Packaging | |||
| By End-user Industry | Food and Beverage | ||
| Pharmaceuticals | |||
| Cosmetics and Personal Care | |||
| Consumer Goods | |||
| E-Commerce and Logistics | |||
| Other End-User Industries | |||
| By Geography | North America | United States | |
| Canada | |||
| Mexico | |||
| South America | Brazil | ||
| Argentina | |||
| Chile | |||
| Rest of South America | |||
| Europe | United Kingdom | ||
| Germany | |||
| France | |||
| Italy | |||
| Spain | |||
| Russia | |||
| Rest of Europe | |||
| Asia-Pacific | China | ||
| India | |||
| Japan | |||
| South Korea | |||
| Australia | |||
| Rest of Asia-Pacific | |||
| Middle East and Africa | Middle East | Saudi Arabia | |
| United Arab Emirates | |||
| Turkey | |||
| Rest of Middle East | |||
| Africa | South Africa | ||
| Nigeria | |||
| Rest of Africa | |||


Key Questions Answered in the Report
What is the current global value of the plastic free packaging market?
The market is valued at USD 9.12 billion in 2025 and is on track to reach USD 11.23 billion by 2030, reflecting a 4.25% CAGR.
Which region grows fastest for plastic free packaging through 2030?
Asia-Pacific is projected to record a 5.47% CAGR through 2030 due to robust regulatory action in China and India and rapid manufacturing investments.
Which end-use segment will grow the most?
Cosmetics and personal care packaging is forecast to advance at a 5.73% CAGR as consumers accept sustainability premiums in discretionary purchases.
What material type leads today’s sales?
Paper and paperboard products hold 42.53% of 2024 revenues, benefitting from mature recycling infrastructure and consumer familiarity.
How are price premiums affecting adoption?
Plastic-free alternatives cost 15-50% more than legacy plastics, favoring vertically integrated firms that can balance feedstock costs and certification expenses.
What is the biggest barrier to compostable packaging scale?
The shortage of industrial composting facilities is significant, with only 185 in the United States, versus the 5,000 required by 2030 to meet end-of-life processing capacity limits.
Page last updated on:


