
Pet Oral Care Products Market Size and Share
Market Overview
| Study Period | 2021 - 2031 |
|---|---|
| Market Size (2026) | USD 3.24 Billion |
| Market Size (2031) | USD 4.43 Billion |
| Growth Rate (2026 - 2031) | 6.46 % |
| Fastest Growing Market | Asia Pacific |
| Largest Market | North America |
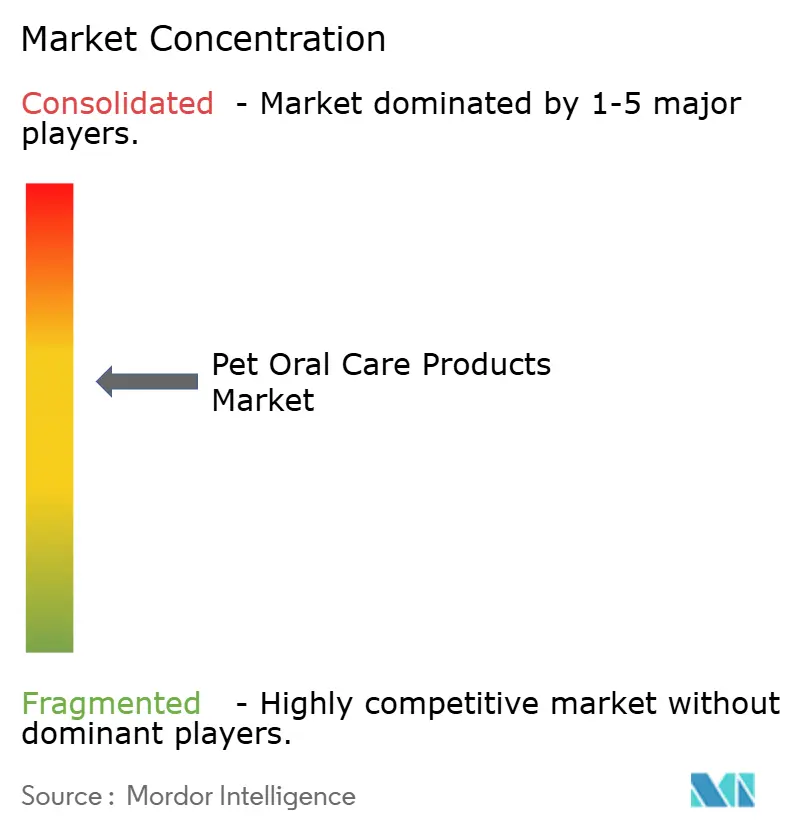
| Market Concentration | Medium |
Major Players
*Disclaimer: Major Players sorted in no particular order Image © Mordor Intelligence. Reuse requires attribution under CC BY 4.0. |
|
Pet Oral Care Products Market Analysis by Mordor Intelligence
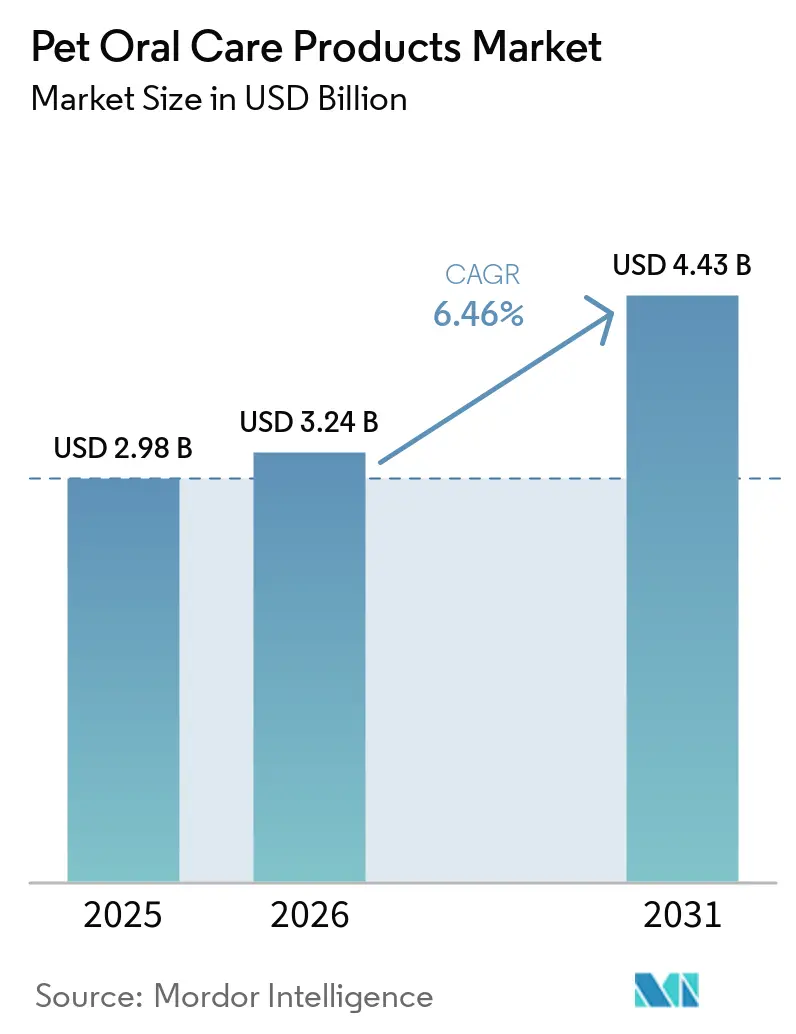
The pet oral care products market size is projected to expand from USD 2.98 billion in 2025 and USD 3.24 billion in 2026 to USD 4.43 billion by 2031, registering a 6.46% CAGR between 2026 to 2031. Improving preventive care awareness, rapid uptake of functional chews, and digitally enabled monitoring are driving momentum across every region. Disease prevalence remains high, affecting more than 8 in 10 adult companion animals, keeping the clinical need visible to owners and veterinarians. E-commerce subscriptions now translate compliance gaps into recurring revenue, aided by same-day delivery and simple auto-reorder options that lift basket size. Ingredient innovation, especially seaweed extracts, enzymes, and postbiotics, gives premium brands space to command price premiums while satisfying the growing demand for label transparency. At the same time, counterfeit risk, inflation-driven price sensitivity, and variable claim regulations generate headwinds that manufacturers must address through authentication tools, pack downsizing, and rigorous clinical validation.
Key Report Takeaways
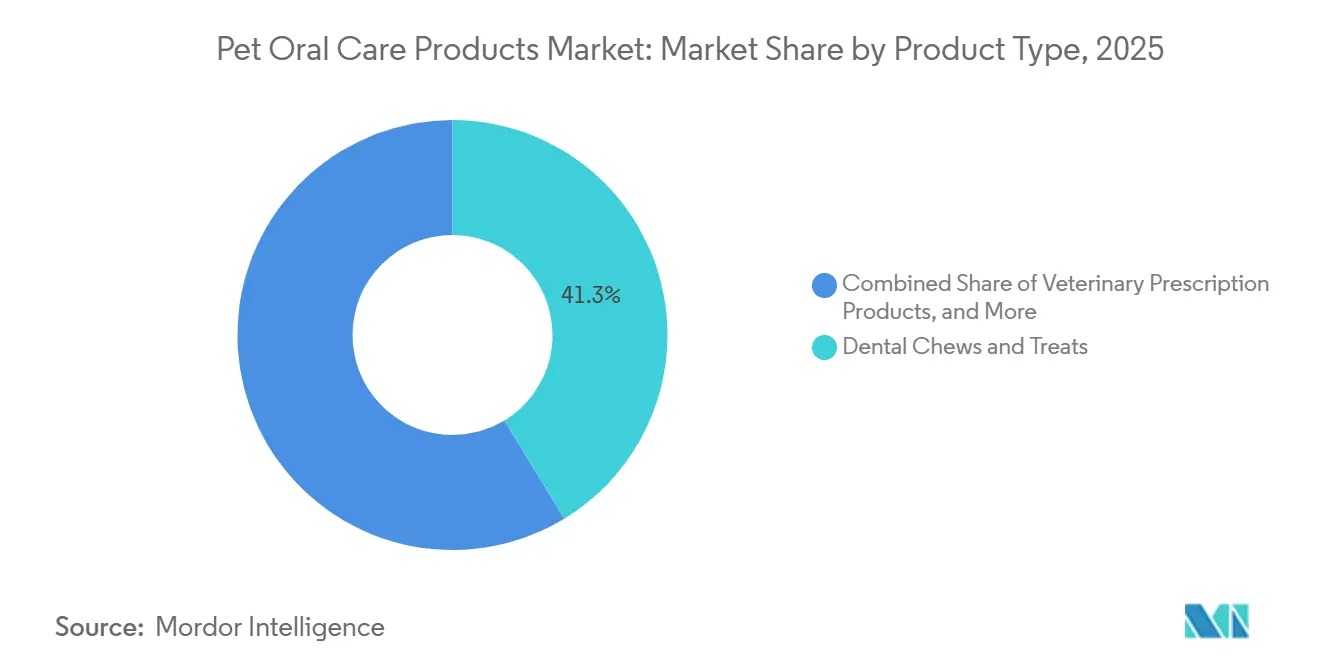
- By product type, dental chews and treats led with 41.3% of the pet oral care products market share in 2025, while oral probiotic tablets are forecast to expand at a 7.4% CAGR through 2031.
- By animal type, dogs accounted for a 64.5% share of the pet oral care products market size in 2025, and cats are advancing at a 6.1% CAGR to 2031.
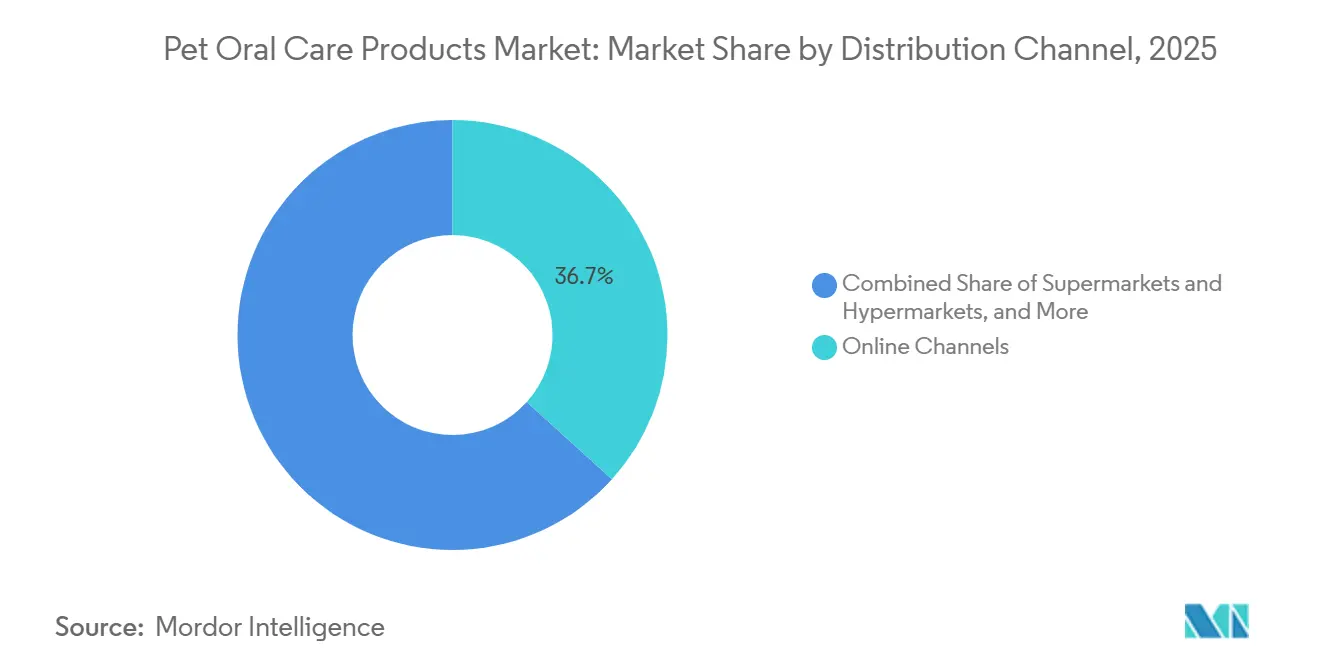
- By distribution channel, online platforms captured 36.7% of revenue share in 2025, and subscription boxes are projected to show the fastest growth at a 7.9% CAGR through 2031.
- By geography, North America held a 46.5% share in 2025, while Asia-Pacific is the fastest-growing region, with a 6.6% CAGR to 2031.
- Mars, Incorporated, Colgate-Palmolive Company, Nestlé Purina PetCare, Virbac S.A., and Elanco Animal Health Incorporated accounted for significant market revenue in 2025.
Note: Market size and forecast figures in this report are generated using Mordor Intelligence’s proprietary estimation framework, updated with the latest available data and insights as of 2026.
Global Pet Oral Care Products Market Trends and Insights
Drivers Impact Analysis*
| Driver | (~) % Impact on CAGR Forecast | Geographic Relevance | Impact Timeline |
|---|---|---|---|
| High prevalence of periodontal disease in pets | +0.9 | North America and Europe, with spillover worldwide | Long term (≥ 4 years) |
| Rising pet humanization and premium spend | +1.0 | North America, Europe, and urban Asia-Pacific | Medium term (2 - 4 years) |
| E-commerce expansion boosting direct-to-consumer oral-care subscriptions | +0.8 | Global, led by North America and Europe | Short term (≤ 2 years) |
| Novel functional ingredients driving product differentiation | +0.9 | North America and Europe first, then Asia-Pacific | Medium term (2 - 4 years) |
| Artificial intelligence enabled chew design improving dental efficacy and owner engagement | +0.5 | North America and Europe initially | Medium term (2 - 4 years) |
| Personalized microbiome-targeted formulations gaining traction | +0.4 | North America and Europe, and niche Asia-Pacific markets | Long term (≥ 4 years) |
| Source: Mordor Intelligence | |||


High Prevalence of Periodontal Disease in Pets
Periodontal disease already affects most adult dogs and cats, making it the single largest clinical trigger for product adoption. Average professional cleaning costs remain above USD 350 per procedure in the United States, which pushes many owners toward preventive chews and water additives that appear cost-effective over time[1]Source: American Society for the Prevention of Cruelty to Animals Data Team, “Pet Ownership Costs,” aspca.org. As pet populations age in Europe and North America, incidence is set to rise further, deepening baseline demand. Emerging economies such as China are seeing younger pet cohorts today, yet a similar burden is projected as these cohorts mature, keeping the pet oral care products market firmly in a growth cycle.
Rising Pet Humanization and Premium Spend
In the United States, the majority of pet owners consider their pets as family and frequently purchase enhanced formulations that mirror human dental care practices. This trend highlights the growing emphasis on pet health and wellness, with owners increasingly seeking products that align with their own standards of care. A similar trend is observed in South America, where the majority of the pet owners share this perspective. However, taxation in Brazil is reducing disposable income and potentially affecting purchasing behavior. Despite this, brands with third-party clinical validation, such as the Veterinary Oral Health Council seal, effectively leverage this premium sentiment to justify higher shelf prices, contributing to value growth in the pet oral care products market.
Novel Functional Ingredients Driving Product Differentiation
Seaweed extract Ascophyllum nodosum and postbiotic Lactobacillus plantarum strains have demonstrated effectiveness in reducing plaque and halitosis, as evidenced by peer-reviewed trials. These ingredients target oral bacteria and improve overall oral hygiene in pets. Enzyme complexes containing glucose oxidase disrupt biofilm without the need for brushing, addressing compliance challenges and making oral care more accessible for pet owners. Manufacturers use ingredient science to enhance the premium positioning of pet oral care products and secure veterinarian endorsements, thereby further building consumer trust. Increasing clinical evidence is encouraging retailers to allocate additional shelf space, thereby expanding consumer access and driving market growth.
Personalized Microbiome-Targeted Formulations Gaining Traction
Companies are now developing strains specifically suited to the unique oral microbiota of dogs and cats. This differentiation addresses the distinct needs of each species, enhancing product effectiveness and improving overall oral health. Postbiotics offer shelf stability, eliminating the need for cold chain logistics and attracting online shoppers with their convenience and longer shelf life. Early adopters in North America and Europe are willing to pay premium prices, as noticeable improvements in breath freshness within one week encourage repeat purchases and build customer loyalty. While regulatory clarity will influence scalability, pilot launches indicate potential for broader market adoption in the future, signaling a shift toward mainstream acceptance of these products and their benefits.
Restraints Impact Analysis*
| Restraint | (~) % Impact on CAGR Forecast | Geographic Relevance | Impact Timeline |
|---|---|---|---|
| Low owner compliance with tooth-brushing regimens | −0.8 | Worldwide, acute in emerging regions | Medium term (2 - 4 years) |
| Regulatory ambiguity on product efficacy claims | −0.5 | North America and Europe chiefly | Long term (≥ 4 years) |
| Counterfeit chew products undermining brand trust | −0.4 | Online channels in Asia-Pacific and South America | Short term (≤ 2 years) |
| Inflation-driven price sensitivity in emerging markets | −0.6 | South America, Middle East, and Africa | Short term (≤ 2 years) |
| Source: Mordor Intelligence | |||
Low Owner Compliance with Tooth-Brushing Regimens
Daily brushing remains a challenging goal. Surveys in Sweden and the United Kingdom indicate adherence rates remain less, even with veterinary recommendations. Factors such as pet resistance, time limitations, and the lack of immediate visible results discourage owners. While passive delivery formats are increasingly adopted, they do not fully replicate the effectiveness of mechanical plaque removal, limiting their impact on population-level disease reduction. Brands are focusing on education and offering bundled products, such as chews and easy-grip finger wipes, to gradually improve compliance. Additionally, efforts are underway to develop innovative tools and techniques that simplify the brushing process, aiming to address barriers faced by pet owners and improve overall adherence rates.
Regulatory Ambiguity on Product Efficacy Claims
The Food and Drug Administration Center for Veterinary Medicine distinguishes clearly between food and drug classifications. Recent policy changes have transferred responsibility for ingredient definitions to individual states, leading to duplication of costs for nationwide product launches[2]Source: Food and Drug Administration Center for Veterinary Medicine, “Regulatory Updates,” fda.gov. This shift creates challenges for companies seeking to maintain consistency across state lines, thereby increasing compliance complexity. Additionally, European Union regulations 2025/2091 and 2025/2154 mandate good manufacturing practices for veterinary medicinal products, compelling smaller companies to outsource production[3]Source: European Food Safety Authority, “Good Manufacturing Practice Regulations,” efsa.europa.eu. These regulations aim to ensure product quality but place significant financial and operational burdens on smaller firms. This fragmented regulatory environment requires global brands to stagger product rollouts and modify labels, increasing overhead costs and hindering growth in the pet oral care products market.
*Our forecasts treat driver/restraint impacts as directional, not additive. The impact forecasts reflect baseline growth, mix effects, and variable interactions.
Segment Analysis
By Product Type: Dental Chews and Treats Dominate but Oral Probiotic Tablets Gain Ground
Cat & dog dental chews and treats were the largest product type, accounting for 41.3% of the pet oral care products market share in 2025. Many formulations carry the Veterinary Oral Health Council seal, lending credibility that supports premium shelf placement. Wider format options now address breed size, calorie concerns, and targeted mechanical abrasion for back molars. As omnichannel retailers expand shelf slots, chews remain the top-of-mind entry point, especially when owners first recognize bad breath.
The fastest-growing segment, oral probiotic tablets, is posting a 7.4% CAGR through 2031. Microbiome-modulating postbiotic strains provide noticeable improvements in breath freshness within seven days, offering a clear benefit that fosters word-of-mouth adoption. Combination packs with tablets and chews deliver dual-action benefits, improving plaque control without the need for brushing. This approach also creates upselling opportunities, driving growth in the pet oral care products market.


By Animal Type: Dogs Lead while Cats Accelerate
Dogs are the largest pet type and account for 64.5% of the pet oral care products market size in 2025, as canine owners show greater engagement with at-home routines and veterinarians emphasize gum health during annual visits. Larger oral cavities and reward-based training make it easier to administer chews and flavored pastes. Mass-market advertising further focuses brand messaging on canines, reinforcing their dominance among first-time buyers.
Cats, advancing at a 6.1% CAGR, are starting to close the gap. Feline offerings now feature smaller chew dimensions, softer textures, and salmon or poultry flavor profiles that align with natural preferences. Antech Diagnostics’ feline-specific RapidRead Dental tool guides veterinarians toward earlier lesion detection, which, in turn, prompts owners to maintain daily home care. As indoor cat populations rise across Asia-Pacific, this momentum should translate into additional share gains in the pet oral care products market.
By Distribution Channel: Online Rises while Subscription Boxes Disrupt
Online platforms were the largest distribution channel, accounting for 36.7% of pet oral care product sales in 2025. Search filters, bundled discounts, and a fast checkout experience encourage multi-unit purchases, while consumer reviews reduce perceived risk for first-time buyers. In China, live-stream commerce on Douyin and Xiaohongshu helps niche brands surface quickly, adding depth to categories without the constraints of shelf space.
Subscription boxes are recording the fastest growth, rising 7.9% through 2031, as curated kits arrive at predictable intervals that align with product depletion cycles. Brands use subscriber data to refine formulations and cross-sell supplements, creating sticky customer relationships. Offline retailers respond by adding click-and-collect services and loyalty apps, yet the convenience edge of direct-to-home delivery keeps pushing more volume toward e-commerce, reinforcing digital leadership within the pet oral care products market.
Geography Analysis
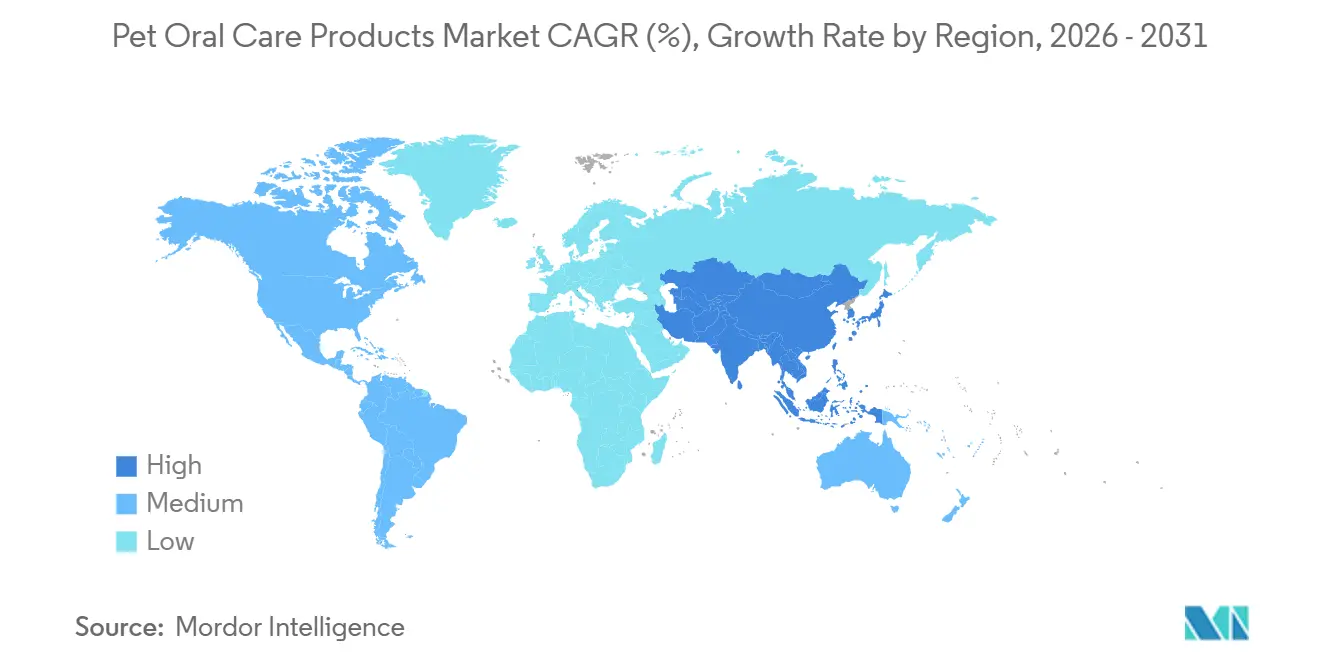
North America is the largest region, capturing 46.5% of the pet oral care products market in 2025, led by the United States, where 56.3 million households keep dogs and 43.1 million keep cats[4]Source: American Veterinary Medical Association, "U.S. pet ownership statistics," avma.org. Veterinary advice continues to influence purchase decisions, and recent artificial intelligence launches from Mars, Incorporated and Antech heighten consumer awareness, reinforcing uptake. Price increases in professional services also nudge owners toward preventive products. Canada mirrors these trends but exhibits slightly lower premium spend, while Mexico shows volume growth through value channels, moderated by disposable income levels.
Asia-Pacific posts the fastest 6.6% CAGR through 2031, driven by rising disposable incomes, urban densification, and smaller household sizes, which are boosting pet adoption. Chinese consumers spend more per month on pets, a clear sign of willingness to pay for premium oral care. Japan’s aging pet cohort demands senior-focused formulations, while India and South Korea deliver double-digit volume gains from a low base. High e-commerce penetration shortens market-entry lead times, allowing innovators to capture share quickly.
Europe benefits from strict welfare legislation taking effect in 2028 that mandates microchipping and elevates care standards. Germany, the United Kingdom, and France make up the core demand triangle, with Northern Europe showing the highest veterinary compliance rates. Good manufacturing practice regulations, scheduled for implementation in 2026, are projected to limit the involvement of smaller importers, leading to a consolidation of market share among established brands. Currency stability and moderate inflation continue to support purchasing power, ensuring steady growth in the pet oral care products market.

Regulatory Landscape
Pet oral care products operate under a split regulatory approach that depends on claims and intended use. In the United States, FDA Center for Veterinary Medicine (CVM) oversight becomes relevant when products make therapeutic claims, which can trigger animal drug classification and associated approval pathways (NADA/ANADA). By contrast, routine grooming and breath-freshening aids generally fall under broader safety and labeling expectations. Globally, brands often reference the Veterinary Oral Health Council (VOHC) Seal as a voluntary, evidence-based standard for plaque and tartar control to support efficacy positioning where claim rules are less uniform.
In the European Union, requirements tighten for products that fall under the veterinary medicinal framework. The GMP implementing regulations (EU) 2025/2091 and (EU) 2025/2154 entered into force on 16 July 2026, raising the bar for quality systems and manufacturing controls for in-scope veterinary medicinal products and increasing the compliance burden for smaller players. Separately, Commission Implementing Regulation (EU) 2026/1189 (published 05 June 2026) consolidates antimicrobial-related restrictions and import controls for animal products, with updated requirements applying from 03 September 2026. This adds diligence needs for companies sourcing animal-derived inputs or supplying products that intersect with regulated animal-material supply chains.
Competitive Landscape
The pet oral care products market is characterized by moderate concentration, where a small group of multinational leaders balances the influence of specialty disruptors. Mars, Incorporated, Colgate-Palmolive Company, Nestlé Purina PetCare, Virbac S.A., and Elanco Animal Health Incorporated accounted for significant market revenue in 2025. The company relies on global logistics and veterinary trust to secure broad availability. Mars, Incorporated expanded its portfolio in 2025 with the Greenies Canine Dental Check, a smartphone image analysis tool that links products to personalized advice, giving the company a data advantage and deepening retention inside the pet oral care products market.
Swedencare AB is driving ingredient innovation and a surge in the dental segment following the acquisition of Vetio. Direct-to-consumer specialists like Petlab Co. and Zesty Paws thrive online through influencer partnerships and subscription bundles. Central Garden and Pet Company boosts Nylabone chew sales by refreshing flavor assortments, while Virbac S.A. and Elanco Animal Health Incorporated defend prescription niches by integrating periodontal gels into in-clinic treatment protocols.
Intellectual property filings point to future convergence between toys, diagnostics, and consumables. Hill’s Pet Nutrition holds patents for sensor-embedded play devices that gather breath and pH data, laying the groundwork for personalized regimens. Better Business Bureau alerts about counterfeit chews spur legitimate firms to adopt blockchain traceability, heightening barriers for gray-market sellers and reinforcing trust in branded offerings. Private equity continues to view the segment as fertile, with roll-up strategies accelerating consolidation across mid-tier brands.
Pet Oral Care Products Industry Leaders
-
Mars, Incorporated
-
Colgate-Palmolive Company
-
Nestlé Purina Petcare
-
Virbac S.A.
-
Elanco Animal Health Incorporated
- *Disclaimer: Major Players sorted in no particular order

Market Opportunities and Future Outlook
A clearer opportunity is forming around closed-loop oral health ecosystems that connect screening or monitoring with repeat purchase formats, including chews, powders, and subscription replenishment. Mars Pet Nutrition extended AI-assisted dental monitoring into Europe in March 2026 with PEDIGREE Toothscan, reinforcing a model in which smartphone checks encourage owners into preventive regimens and can be linked to digital engagement and auto-reorder.
Retail and clinical platform expansion is also widening distribution and bundling options for oral care, particularly where veterinary touchpoints are being connected to commerce. Chewy signed a definitive agreement in April 2026 to acquire Modern Animal, adding 29 clinics and 24/7 virtual care capabilities to its platform, while Tractor Supply Company acquired VIP Petcare in 2026, bringing a mobile veterinary footprint across roughly 2,700 retail locations. These moves broaden the number of sites where oral care can be recommended, trialed, and replenished, supporting premiumization for clinically supported products (including those aligned to VOHC protocols) and enabling cross-sell bundles that pair in-clinic guidance with at-home formats such as functional chews, water additives, wipes, and microbiome-targeted tablets.
Recent Industry Developments
- May 2026: Compana Pet Brands introduced Dinovite Triple Action Dental Chews and Dinovite Targeted Oral Care Powder, expanding its oral care portfolio across both chew and sprinkle-on formats. The launches target owner compliance by embedding oral care into daily feeding and treat routines, supporting higher frequency usage than brushing-dependent regimens.
- May 2025: Woof launched Doggy Dental Mix, positioned as a dental care solution designed to work with playtime and enrichment routines. By shifting delivery into interactive formats, the product underscores a broader category push toward passive, habit-based oral care that reduces reliance on owner-led brushing.
- June 2024: Mars Pet Nutrition announced a major manufacturing expansion to scale dental chew and powder production to meet rising demand across North America and Europe, supported by a multi-year capex program and new regional packaging lines. This capacity upgrade reduces lead times for retailers and clinics and supports the ongoing push toward premium, clinically validated oral care products.


Research Methodology Framework and Report Scope
Market Definition and Coverage
This market covers products purchased for routine pet oral hygiene and breath care, including dental chews and treats, toothpastes and gels, rinses and sprays, wipes, and water additives, across retail and veterinary-linked channels.
Scope exclusions: Professional veterinary dental procedures and tools used mainly in clinics are excluded, and adjacent grooming items are not counted unless they are positioned and sold as oral care.
Segmentation Overview
-
By Product Type
- Toothpaste
- Toothbrush
- Mouthwash and Rinses
- Dental Chews and Treats
- Water Additives and Sprays
- Veterinary Prescription Products
- Dental Wipes
- Oral Probiotic Tablets
- Other Product Types
-
By Animal Type
- Dogs
- Cats
- Rabbits
- Ferrets
- Others
-
By Distribution Channel
- Supermarkets and Hypermarkets
- Online Channels
- Specialized Pet Shops
- Veterinary Channels
- Subscription Boxes
- Grooming Salons
- Other Channels
-
By Geography
-
North America
- United States
- Canada
- Mexico
- Rest of North America
-
Europe
- Germany
- United Kingdom
- France
- Italy
- Spain
- Russia
- Rest of Europe
-
Asia-Pacific
- China
- Japan
- India
- Australia
- South Korea
- Rest of Asia-Pacific
-
South America
- Brazil
- Argentina
- Chile
- Rest of South America
-
Middle East
- Saudi Arabia
- United Arab Emirates
- Turkey
- Rest of Middle East
-
Africa
- South Africa
- Egypt
- Nigeria
- Rest of Africa
-
North America
Data Sources, Market Sizing, and Validation
Desk Research
Desk work starts with building a clear fact base for pet ownership, pet spending, and oral care product availability by country, and then it is translated into usable sizing inputs. We lean on public sources such as the US Census Bureau retail trade data, US Bureau of Labor Statistics inflation series, USDA and Eurostat trade statistics for relevant pet product flows, and national customs portals where line items are readable. Standards and health guidance signals are also reviewed from sources such as the World Organisation for Animal Health and peer reviewed veterinary dentistry literature, so we can separate adoption drivers from claim boundaries.
On the company side, annual reports, investor presentations, and earnings call notes are used to spot category mix language and pricing commentary that affects ASP assumptions. We also use paid subscriptions for company financials and intelligence, news and financials, patent databases, and in some countries shipment-level import and export databases to cross-check product movement and timing. This desk source list is illustrative only, and many other public and paid references were used to collect, validate, and clarify data points.
Primary Interviews and Surveys
To close gaps that desk sources do not solve well, we run expert discussions and structured surveys with manufacturers, distributors, retailers, veterinarians, and specialized pet channel professionals. We keep regional coverage balanced so adoption patterns for chews, toothpaste, and water additives can be checked across geographies, and then we tighten pricing, promotions, and channel mix assumptions for the final model.
Distribution of primary research fieldwork respondents
| Company type | Respondent position | Region |
|---|---|---|
| Top tier: 39% | CXOs: 14% | APAC: 51% |
| Mid tier: 43% | Functional/Unit leaders: 30% | EMEA: 30% |
| Smaller Players: 18% | Managers: 56% | Americas: 19% |
Market-Sizing & Forecasting
Sizing is built using a top-down approach where pet population, pet care spending, and category penetration are used to reconstruct the demand pool, which is then shaped by channel mix and product mix. To keep totals realistic, we also run selective bottom-up approximations such as sampled brand and channel price checks, chew and treat volume proxies, and distributor and retailer sense checks. This helps adjust for under-reported online sales and promotional intensity.
Key inputs used in the model include dog and cat population trends, household pet ownership rates, real price movement using consumer inflation series, the share of owners buying preventive health products, and the split between chews and treat formats versus liquid and paste formats. Where data is thin for smaller countries, adoption and pricing are bridged using comparable markets with similar income levels and pet ownership patterns, and the step-up is validated through interviews.
For forecasting, scenario analysis is used around price and mix, supported by regression checks on pet ownership growth, disposable income indicators, and e-commerce share expansion. Assumptions are kept practical so they can be traced to observable signals and re-run when new annual data becomes available.
Data Validation & Update Cycle
Outputs are checked against independent signals such as pet care retail trends, trade movement direction, and observed price ranges across channels, and then any outliers are reviewed back at the country and product mix level. When a variance is large, follow-up calls are triggered so the driver is pinned down, whether it is a currency shift, a promotion cycle, or a channel reporting gap. Before sign-off, the model goes through multi-step analyst review, with cross-checks on growth rates, share movements, and historical consistency.
Reports are refreshed annually, and interim updates are made when material events can change pricing or demand in a noticeable way. Right before delivery, a fresh validation pass is completed so clients receive the most current view aligned to the latest available inputs.
Mordor Intelligence's Pet Oral Care Products Market Size Measured Against Other Published Estimates
Published market sizes for pet oral care products can look far apart, even when the topic sounds identical, because the boundaries and timing choices are not the same. Differences usually come from what is counted as oral care, which channels are included, and how prices and currency are handled across years.
A refresh-led gap is also common in this market because pricing for chews and treats can move quickly with promotions, pack-size changes, and inflation, and then the USD conversion timing can swing the reported value for the same local sales. By rechecking current-year ASP ranges by channel and running late-stage variance calls before locking the model, Mordor Intelligence reduces drift from stale price points and delayed currency normalization.
Benchmark comparison
| Source | Market Size | Gaps in Research Methodology |
|---|---|---|
| Mordor Intelligence | USD 2.98 B (2025) | |
| Global Consultancy A | USD 7.80 B (2024) | Uses a wider boundary that appears to blend oral care products with broader pet dental health and end user buckets, and the base year is not aligned to the same pricing and FX timing. |
| Industry Publisher B | USD 1.74 B (2024) | Relies on a narrower product grouping and a lower growth path, and the revenue basis is presented with limited clarity on channel coverage and whether retail margins and promotion effects are normalized. |
The comparison shows that the spread is mainly explained by scope expansion on one side and narrower category counting on the other, with timing choices amplifying the gap. Our approach stays traceable because inputs are tied to observable pet ownership and spending signals, and then pricing, channel mix, and currency handling are reviewed in the same cycle before results are finalized.


Key Questions Answered in the Report
What growth rate is projected for the pet oral care products market through 2031?
The category is forecast to post a 6.46% compound annual growth rate between 2026 and 2031, rising from USD 3.24 billion in 2026 to USD 4.43 billion by the end of the period.
Which product format currently holds the largest share?
Dental chews and treats account for 41.3% of global revenue thanks to their simplicity, palatable flavors, and broad veterinary support.
Why are probiotic tablets considered the fastest growing segment?
Postbiotic formulations demonstrate quick breath-freshening benefits and require no brushing, driving a 7.4% annual growth pace to 2031.
How important is online retail for the category?
Online platforms already make up 36.7% of worldwide sales, and subscription models that deliver curated dental kits are expanding nearly 8% annually.
Which region leads and which region grows fastest?
North America commands 46.5% of sales today, while Asia-Pacific shows the highest regional growth at a 6.6% compound annual rate through 2031.
Page last updated on:





