Personal Finance Tools Market Size and Share
Market Overview
| Study Period | 2020 - 2031 |
|---|---|
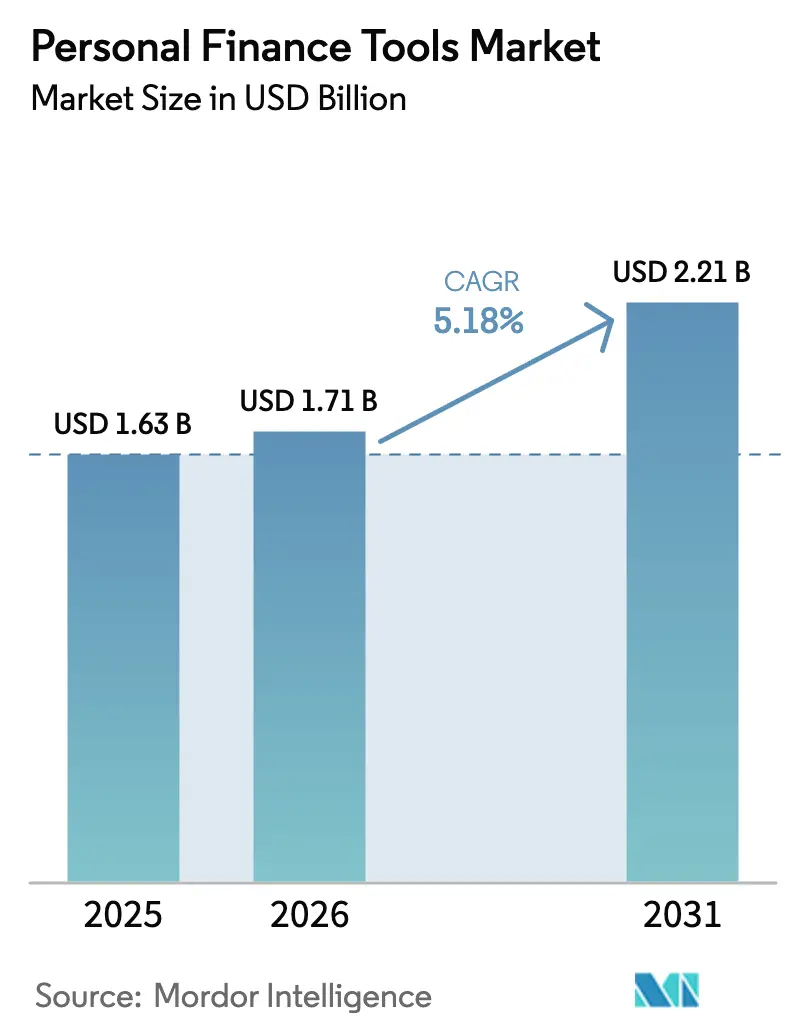
| Market Size (2026) | USD 1.71 Billion |
| Market Size (2031) | USD 2.21 Billion |
| Growth Rate (2026 - 2031) | 5.18% CAGR |
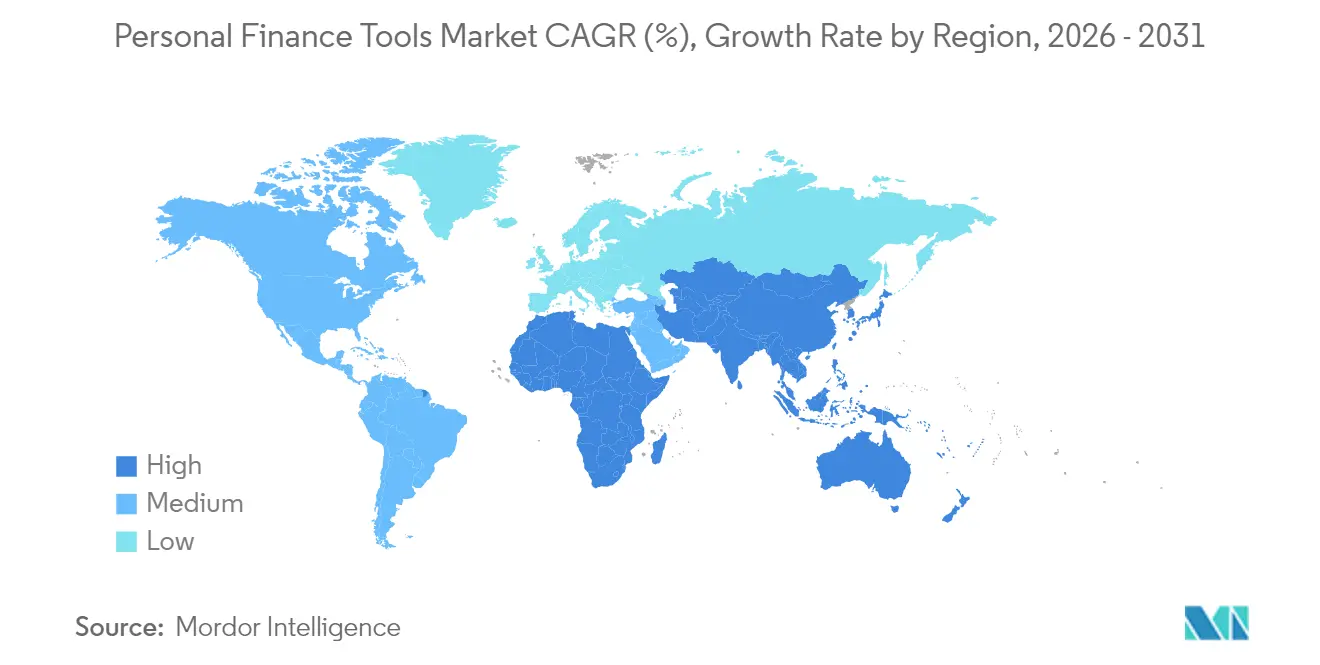
| Fastest Growing Market | Asia-Pacific |
| Largest Market | North America |
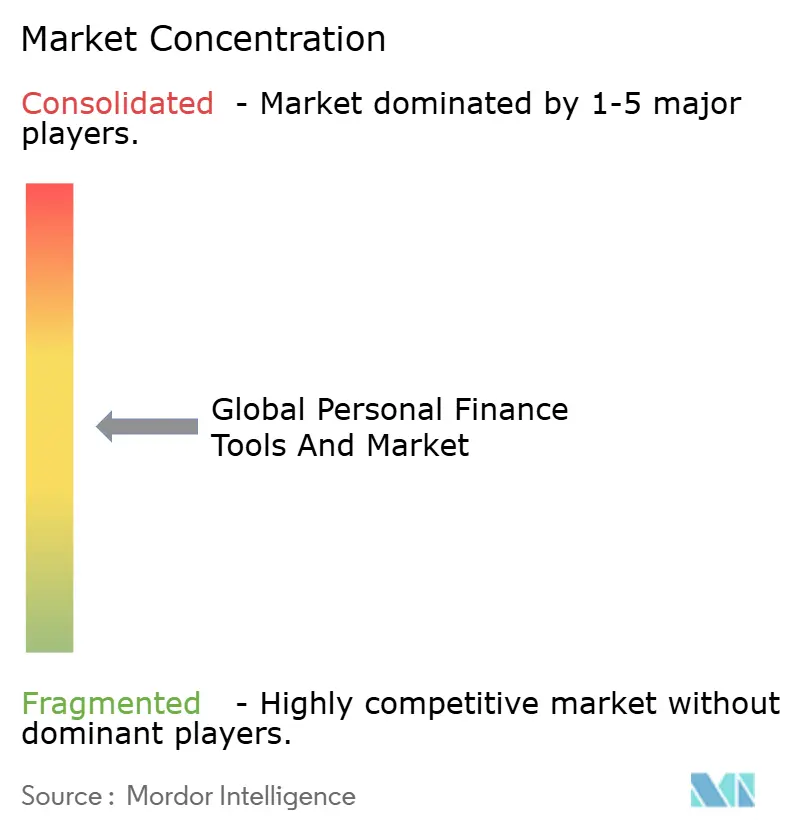
| Market Concentration | Medium |
Major Players *Disclaimer: Major Players sorted in no particular order Image © Mordor Intelligence. Reuse requires attribution under CC BY 4.0. | |
Personal Finance Tools Market Analysis by Mordor Intelligence
The personal finance tools market size in 2026 is estimated at USD 1.71 billion, growing from 2025 value of USD 1.63 billion with 2031 projections showing USD 2.21 billion, growing at 5.18% CAGR over 2026-2031. This expansion occurs as open banking regulations, generative AI engines, and embedded finance agreements reshape the competitive landscape, prompting rapid upgrades to data-sharing architectures and user-experience design. Mobile-based platforms enjoy wider daily engagement cycles, and cloud infrastructure supports faster feature iteration, while escalating customer-acquisition costs push providers to prioritize monetization per user over sheer download volume. Subscription fatigue is nudging vendors toward transaction-fee models that align revenue with payment flows, and smartphone penetration in emerging economies is unlocking new addressable segments at lower onboarding costs. Generative AI now drives real-time cash-flow forecasting and personalized nudges, creating switching barriers even as regulatory frameworks guarantee data portability. Competitive intensity remains elevated as neobanks bundle dashboards directly into checking accounts, compressing the standalone total addressable market for personal finance tools while expanding the overall ecosystem’s monetization surface.
Key Report Takeaways
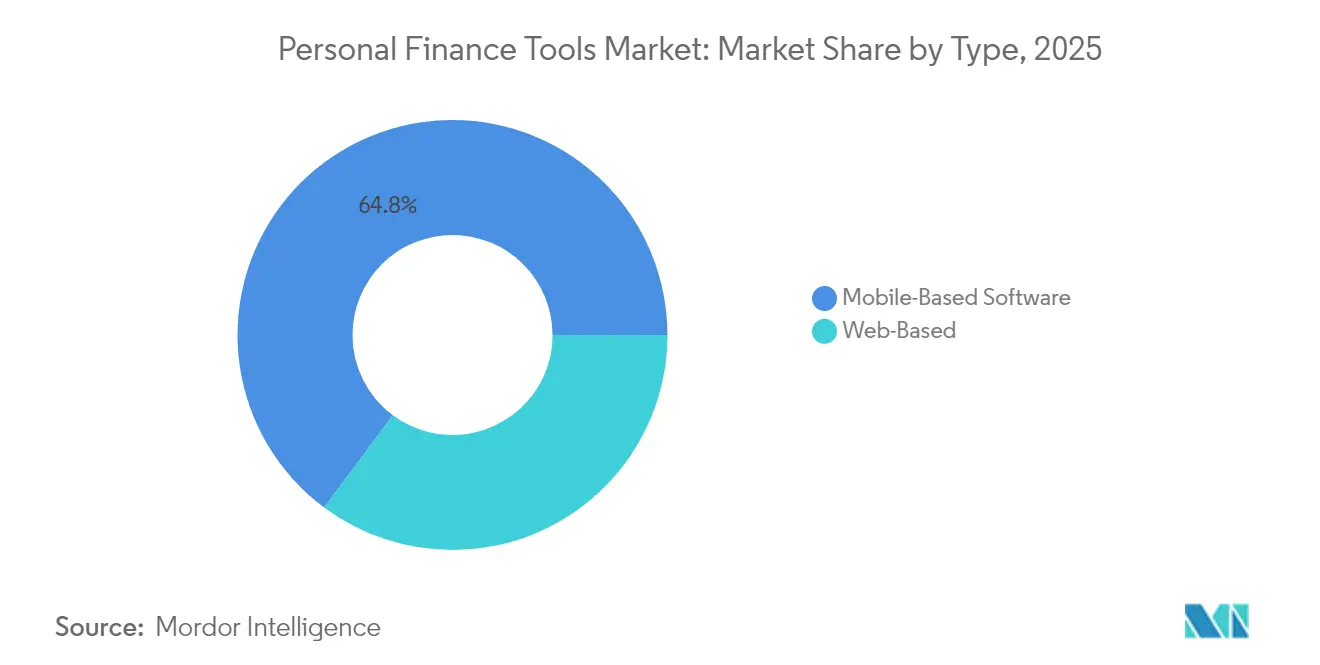
- By type, mobile-based software led with a 64.82% revenue share in 2025; the segment is expected to advance at an 8.12% CAGR through 2031.
- By deployment model, cloud-based solutions commanded 77.45% of the personal finance tools market share in 2025, and this segment also posted the highest projected CAGR at 9.35% through 2031.
- By end user, individual consumers accounted for 65.90% of the 2025 revenue, whereas small business users recorded the fastest 7.65% CAGR from 2025 to 2031.
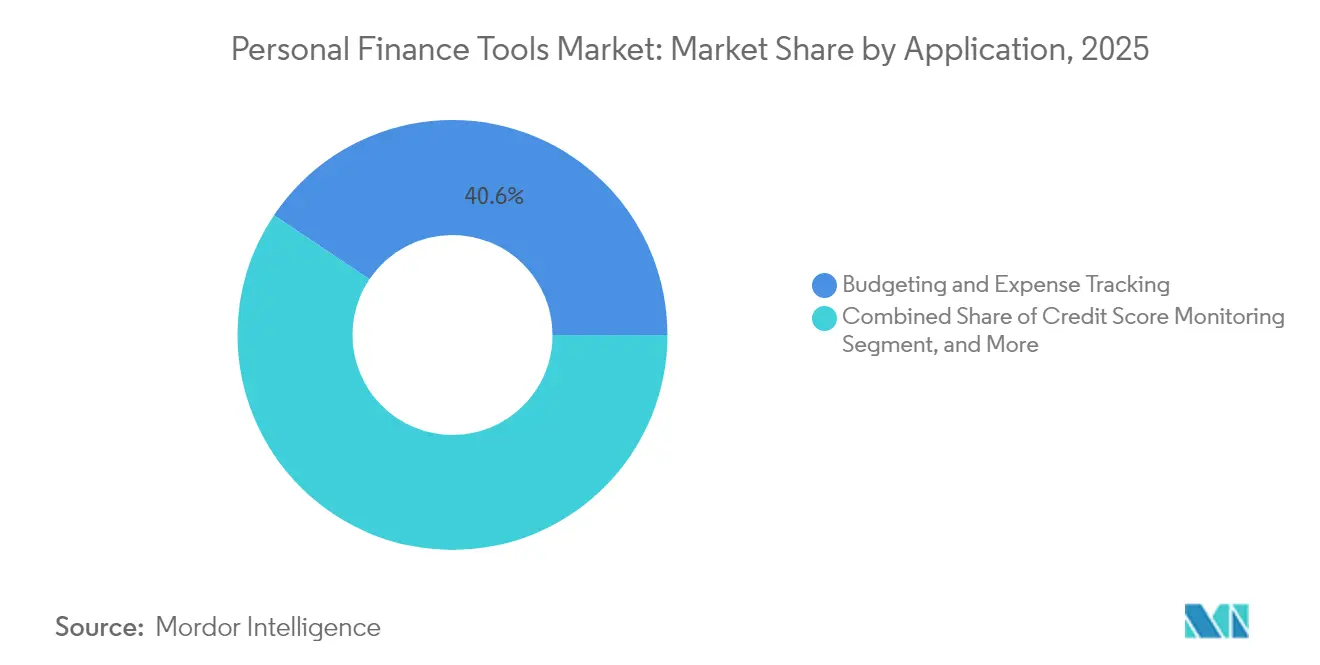
- By application, budgeting and expense tracking captured 40.60% of the revenue in 2025; investment and wealth management applications are projected to expand at a 10.62% CAGR.
- By revenue model, subscriptions generated 58.90% of revenue in 2025, yet transaction-fee models are growing at a 9.88% CAGR through 2031.
- By geography, North America contributed 37.40% revenue in 2025, while the Asia Pacific is forecast to rise at an 8.55% CAGR.
Note: Market size and forecast figures in this report are generated using Mordor Intelligence’s proprietary estimation framework, updated with the latest available data and insights as of 2026.
Global Personal Finance Tools Market Trends and Insights
Drivers Impact Analysis*
| Driver | (~) % Impact on CAGR Forecast | Geographic Relevance | Impact Timeline |
|---|---|---|---|
| Accelerated Adoption of Open Banking APIs | +1.2% | Europe, United Kingdom, United States, Canada, Australia | Medium term (2-4 years) |
| Rising Smartphone Penetration in Emerging Economies | +0.9% | Asia Pacific, Middle East, Africa, Latin America | Long term (≥ 4 years) |
| Growing Preference for Subscription Models | +0.6% | Global, with concentration in North America and Europe | Short term (≤ 2 years) |
| Embedded Finance Partnerships Between Fintechs and Banks | +1.1% | North America, Europe, Asia Pacific | Medium term (2-4 years) |
| Gamification-Based Customer Engagement Strategies | +0.5% | Global, strongest in North America and Asia Pacific | Short term (≤ 2 years) |
| Adoption of Generative AI for Hyper-Personalised Insights | +1.3% | Global, early adoption in United States, United Kingdom, Singapore | Medium term (2-4 years) |
| Source: Mordor Intelligence | |||
Accelerated Adoption of Open Banking APIs
Regulators are mandating standardized APIs that enable licensed apps to pull balances, transactions, and payment instructions without storing login credentials, thereby ending fragile screen-scraping practices. The United States Section 1033 rules provide the same portability rights, although large banks lobby for phased rollouts. Australia’s Consumer Data Right expands to include mortgage and credit card data, driving fintech downloads and raising the standard for real-time refresh speeds. Faster access enables apps to generate predictive cash-flow alerts, automated bill negotiation offers, and consolidated dashboards in seconds. Vendors that lag on API integration risk user churn toward platforms that deliver instant visibility and friction-free switching.
Adoption of Generative AI for Hyper-Personalised Insights
Leading providers integrate large language models into spending coaches that translate transaction data into plain-English action plans.[1]Intuit, “Intuit Fiscal Year 2024 Results,” investors.intuit.com SoFi’s AI investment coach analyzes volatility, tax angles, and rebalancing needs, converting insights into one-tap execution flows. The technology ingests unstructured data such as email receipts and calendar invites, surfacing proactive reminders before a user overspends. Revolut reports double-digit increases in engagement and a decrease in support tickets from AI-driven insights. Compliance with the European Union AI Act adds transparency requirements but favors well-funded incumbents that can afford bias-mitigation protocols.
Embedded Finance Partnerships Between Fintechs and Banks
Regional banks are increasingly white-label budgeting, robo-advice, and credit-building widgets from fintechs to retain digital natives. JPMorgan’s minority stake in Acorns enables checking customers to automate round-up savings, thereby increasing cross-sell success for investment products. Embedded lending within Revolut compresses the steps between insight and loan disbursement, illustrating how partnerships blur the line between tools and core banking services.[2]Revolut, “Revolut 2024 Annual Report,” revolut.com Regulators now require identical capital and anti-money laundering standards for embedded products, raising the bar for compliance while enhancing consumer trust.
Rising Smartphone Penetration in Emerging Economies
India, Indonesia, and Vietnam have crossed the 80% smartphone penetration mark, enabling mobile-first tools to reach users who lack access to desktop computers or branch offices.[3]GSMA Intelligence, “Mobile Economy Asia Pacific 2024,” gsma.com Instant-payment rails, such as Pix and UPI, generate rich data that apps use for real-time spend categorization without requiring external account linking. Kenya’s M-Pesa ecosystem embeds budgeting alerts that reduce churn among first-time savers. Providers still face barriers related to low financial literacy, prompting investment in localized tutorials and simplified workflows.
Restraints Impact Analysis*
| Restraint | (~) % Impact on CAGR Forecast | Geographic Relevance | Impact Timeline |
|---|---|---|---|
| Cybersecurity Breaches Undermine User Trust | -0.8% | Global, acute in North America and Europe | Short term (≤ 2 years) |
| Low Financial Literacy Among First-Time Users | -0.5% | Asia Pacific, Africa, Latin America | Long term (≥ 4 years) |
| High Customer Churn Due to Low Switching Costs | -0.6% | Global, most pronounced in North America | Medium term (2-4 years) |
| Regulatory Uncertainty Around Consumer Data Ownership | -0.7% | United States, European Union, United Kingdom | Medium term (2-4 years) |
| Source: Mordor Intelligence | |||
Cybersecurity Breaches Undermine User Trust
A ransomware incident in 2024 compromised 2.1 million accounts, sparking industry-wide cancellations and a high-profile FTC consent decree that mandated multi-factor authentication. Regulators may levy fines up to 4% of revenue, as illustrated by the GBP 18 million (USD 23 million) penalty on Revolut for delayed breach notification. Surveys reveal that more than one-third of consumers remain unaware of the security benefits of API aggregation over credential storage, thereby keeping the perceived risk high. Providers investing in zero-knowledge encryption and biometric login incur annual costs near USD 1.2 million, straining smaller firms and nudging the personal finance tools industry toward consolidation.
Regulatory Uncertainty Around Consumer Data Ownership
Section 1033 offers data-portability rights but lacks clear liability definitions, leading banks to challenge the framework in court. Europe’s PSD2 rollout varies by member state, resulting in re-authentication windows that force multi-country vendors to maintain fragmented compliance logic. Australia imposes reciprocal data-sharing rules on fintechs, adding overhead without immediate revenue upside. Such divergence inflates legal costs and slows product launches, hampering smaller entrants more than cash-rich incumbents.
*Our forecasts treat driver/restraint impacts as directional, not additive. The impact forecasts reflect baseline growth, mix effects, and variable interactions.
Segment Analysis
By Type: Mobile Engagement Outstrips Web Interfaces
Mobile-based solutions generated the largest slice of the personal finance tools market, capturing 64.82% of the revenue in 2025 and advancing at an expected 8.12% CAGR to 2031. Daily user sessions average 4.2, supported by biometric login, push alerts, and geo-targeted spend insights that desktop browsers struggle to replicate. Revolut’s cashback-at-checkout engine boosted average transaction volume per user by 19%, demonstrating how smartphone-native contexts raise monetization per session.
The segment maintains momentum as super-apps place budgeting and investment tabs alongside payments and ride-hailing, embedding personal finance tools into broader lifestyle ecosystems. Conversely, web-based platforms keep a foothold with tax prep aficionados and small businesses that value spreadsheet exports and multi-window reconciliation. Yet engagement disparities remain stark, pushing web-first vendors to release progressive-web or hybrid apps to retain visibility on home-screen real estate. Compliance with Apple and Google store policies adds friction, but higher retention offsets the 15% to 30% commission on in-app purchases for premium tiers.


By Deployment Model: Cloud Infrastructure Accelerates Innovation
Cloud-hosted platforms accounted for 77.45% of 2025 spending and exhibit a 9.35% CAGR, underscoring the scale economies of multi-tenant SaaS. Continuous delivery pipelines enable fortnightly feature pushes, accelerating user-visible improvements versus the quarterly cadence typical for on-premise upgrades. Intuit cut server provisioning costs by nearly one-third after migrating QuickBooks workloads and reallocating the savings toward AI research.
On-premise deployments persist mainly in wealth-management boutiques and regional banks, which are bound by data residency mandates. These clients cite latency control and sovereign encryption keys as trade-offs worth the higher staffing burden. Public-cloud leaders answer such objections with regional data centers and customer-managed key services, gradually eroding on-premise justifications. As regulatory clarity increases, the personal finance tools market share for on-premise solutions is likely to shrink below 20.00% by 2031.
By End User: Small Businesses Accelerate Adoption
Individual consumers account for 65.90% of 2025 revenue, but small businesses are expanding at the fastest rate, with a 7.65% CAGR, making them the pivotal growth lever for the personal finance tools market. Freelancers prize unified dashboards that separate deductible expenses from personal spending, reducing tax-preparation hours. Wave’s dual-ledger view raised conversion into its paid invoicing tier by double digits, affirming the profit potential of the small-business audience.
Consumer cohorts remain volume drivers, attracted to freemium budgeting, gamified savings streaks, and free credit-score monitors. Yet, the average revenue per consumer hovers around USD 4.20 per month, versus USD 18.50 for small-business subscribers who also purchase payroll and invoice financing add-ons. Cross-sell adjacency makes business users a strategic hedge against soft consumer spending cycles, especially when mobile-banking incumbents lure individual users with bundled offerings.
By Application: Wealth Management Tools Gain Speed
Budgeting and expense tracking retained 40.60% of 2025 revenue, affirming its continuing relevance as an entry-level need. However, investment and wealth management modules outpace the broader personal finance tools market at an 10.62% CAGR, pushed by robo-advisors that now offer fractional trading and automated tax-loss harvesting. Betterment’s crypto-enabled IRA attracted USD 420 million in inflows within a quarter, underscoring the purchasing power of millennial and Gen Z savers seeking diversified allocations.
Credit-score monitoring commands mid-tier participation through affiliate-funded freemium models, while debt-reduction and tax-filing use cases serve narrower season-linked or need-linked cohorts. Wealth management modules deliver higher lifetime value thanks to asset-based fees, which help offset the heavier regulatory overhead that SEC registration entails. The shift underscores a revenue-mix evolution from budgeting logos to managed-asset long-tail monetization, reinforcing the strategic imperative to integrate real-time market data and advanced analytics.
By Revenue Model: Transaction Fees Climb
Subscription fees contributed 58.90% of the 2025 income, yet pay-as-you-go transaction charges are growing at an annual rate of 9.88%, reflecting user fatigue with stacked monthly bills. Revolut’s per-trade equity fee model generated USD 38 million in incremental revenue while appealing to price-sensitive cohorts who were unwilling to upgrade to premium tiers.
Freemium remains a customer-acquisition funnel yet drags margins if server and support costs outstrip advertising income. Transaction-aligned pricing aligns vendor upside with user activity, although it introduces macroeconomic volatility, as shown when PayPal’s bill-pay revenue declined during a retail slump. Combined pricing portfolios that blend subscriptions with fee waivers can smooth cash flows while supporting tiered product positioning, a tactic likely to define revenue-mix strategy through the decade.
Geography Analysis
North America accounted for 37.40% of 2025 revenue, driven by high card penetration, mature open-banking standards, and cross-sell synergies between budgeting dashboards and credit products. Canada’s open-banking roadmap promises fresh API connectivity by 2026, adding tailwinds for user-growth upside. Mexico’s CoDi expansion to 42 million users gives apps a channel to embed budgeting around remittance inflows, a compelling proposition for households relying on cross-border transfers. Rising acquisition costs, now near USD 68 per user, underscore the premium on retention and monetization depth.
The Asia Pacific region has the strongest growth, advancing at an 8.55% CAGR, driven by 80% smartphone saturation in India, Indonesia, and Vietnam, as well as supportive frameworks such as India’s Account Aggregator system. In December 2024, UPI processed 16.7 billion payments, creating granular data that budgeting apps can parse without account-link friction. Japan’s mandate for bank APIs by 2026 will open a high-income yet underserved senior demographic, while super-apps dominate in China, leaving limited space for new standalone solutions. Unbanked populations in Southeast Asia remain a greenfield for savings-first mobile propositions, aligning financial inclusion agendas with commercial growth.
Europe represents a mature yet opportunity-rich territory. PSD2 latency mandates guarantee sub-500-millisecond APIs, enhancing user experience for spending alerts and payment initiation. The United Kingdom’s broadened coverage now includes savings accounts and credit cards, enabling neobanks to aggregate balances across institutions and lift engagement. Southern Europe lags in digital payments adoption, but Spain’s digital-identity rollout cuts onboarding friction for cross-border providers. In contrast, South America, the Middle East, and Africa present mixed readiness; yet, Brazil’s Pix and Kenya’s M-Pesa demonstrate that instant payments and mobile-first interfaces can generate critical mass when interoperability and low fees coincide.

Competitive Landscape
The personal finance tools market tracks moderate fragmentation. The top five vendors control around 42% share, leaving ample tail for regional specialists and vertical-specific upstarts. Neobanks such as Revolut and N26 bundle dashboards free of charge, compressing download counts for standalone apps and pushing incumbents into white-label contracts with traditional banks. Intuit repositioned Mint users to Credit Karma, signaling a pivot toward transaction-driven revenue streams that monetize affiliate commissions over subscriptions.
The ecosystem plays a dominant strategy as firms bolt on tax prep, lending, or insurance modules to lock users into multi-service engagement loops. SoFi’s acquisition of a tax-filing startup extended its value chain and reduced churn by offering year-round deductions tracking inside the same dashboard. PayPal leverages wallet scale to integrate bill-pay automation and negotiation tools, harvesting data that fuels targeted offers. Revolut now offers same-screen personal loans, slashing the action window between insight and credit approval.
Emerging challengers leverage AI and conversational interfaces. Cleo’s text-based coach attracted 1.2 million users in six months by bypassing traditional ledger views. DeFi-linked savings accounts advertise superior yield but face regulatory skepticism, tempering adoption. Proprietary algorithms remain a differentiator: Intuit filed patents for predictive cash-flow models that warn users 30 days in advance of liquidity shortfalls, raising the bar for insight accuracy. Heightened compliance duties under the EU AI Act and Section 1033 privilege scaled players with in-house legal teams, encouraging consolidation over the forecast horizon.
Personal Finance Tools Industry Leaders
Quicken Inc.
Intuit Inc.
PayPal Holdings Inc.
Betterment LLC
Revolut Ltd.
- *Disclaimer: Major Players sorted in no particular order

Recent Industry Developments
- November 2025: Robinhood Markets launched a tax-optimization suite within its investment app. The tools let users harvest tax losses automatically, track cost basis across multiple brokerages, and generate IRS-ready forms for crypto trades. The feature drew 890,000 enrollments in its first three weeks, setting up Robinhood as a direct competitor to TurboTax in do-it-yourself tax preparation.
- September 2025: Revolut secured approval from the Federal Reserve to operate as a chartered bank in the United States. The license allows the company to offer FDIC-insured deposits, direct deposit, bill-pay, and overdraft protection without third-party partners. Revolut expects the change to cut its cost per U.S. customer by 23% and speed market-share gains across North America.
- June 2025: Intuit formed a partnership with Visa to embed real-time spending insights and merchant-level cashback offers inside Credit Karma’s mobile app. Drawing on Visa’s transaction network, the integration provides personalized budgeting prompts at the point of sale and is projected to add USD 140 million in annual transaction revenue, sharpening Credit Karma’s edge over PayPal’s rewards program.
- March 2025: SoFi Technologies completed a USD 285 million acquisition of a digital insurance brokerage platform. Life, auto, and renters insurance comparison tools are now part of SoFi’s personal finance dashboard, expanding the addressable market by an estimated USD 2.3 billion and opening fresh cross-sell opportunities for its 7.5 million members.


Global Personal Finance Tools Market Report Scope
The Personal Finance Tools Market Report is Segmented by Type (Web-Based, and Mobile-Based Software), Deployment Model (Cloud-Based, and On-Premise), End User (Small Business Users, and Individual Consumers), Application (Budgeting and Expense Tracking, Investment and Wealth Management, Credit Score Monitoring, Debt Management and Loan Planning, Tax Filing and Compliance), Revenue Model (Subscription, Freemium, Transaction Fee), and Geography (North America, South America, Europe, Asia Pacific, Middle East, Africa). The Market Forecasts are Provided in Terms of Value (USD).
| Web-Based |
| Mobile-Based Software |
| Cloud-Based |
| On-Premise |
| Small Business Users |
| Individual Consumers |
| Budgeting and Expense Tracking |
| Investment and Wealth Management |
| Credit Score Monitoring |
| Debt Management and Loan Planning |
| Tax Filing and Compliance |
| Subscription |
| Freemium |
| Transaction Fee |
| North America | United States | |
| Canada | ||
| Mexico | ||
| Europe | United Kingdom | |
| Germany | ||
| France | ||
| Italy | ||
| Rest of Europe | ||
| Asia-Pacific | China | |
| Japan | ||
| India | ||
| South Korea | ||
| Rest of Asia-Pacific | ||
| Middle East and Africa | Middle East | Saudi Arabia |
| United Arab Emirates | ||
| Rest of Middle East | ||
| Africa | South Africa | |
| Egypt | ||
| Rest of Africa | ||
| South America | Brazil | |
| Argentina | ||
| Rest of South America | ||
| By Type | Web-Based | ||
| Mobile-Based Software | |||
| By Deployment Model | Cloud-Based | ||
| On-Premise | |||
| By End User | Small Business Users | ||
| Individual Consumers | |||
| By Application | Budgeting and Expense Tracking | ||
| Investment and Wealth Management | |||
| Credit Score Monitoring | |||
| Debt Management and Loan Planning | |||
| Tax Filing and Compliance | |||
| By Revenue Model | Subscription | ||
| Freemium | |||
| Transaction Fee | |||
| By Geography | North America | United States | |
| Canada | |||
| Mexico | |||
| Europe | United Kingdom | ||
| Germany | |||
| France | |||
| Italy | |||
| Rest of Europe | |||
| Asia-Pacific | China | ||
| Japan | |||
| India | |||
| South Korea | |||
| Rest of Asia-Pacific | |||
| Middle East and Africa | Middle East | Saudi Arabia | |
| United Arab Emirates | |||
| Rest of Middle East | |||
| Africa | South Africa | ||
| Egypt | |||
| Rest of Africa | |||
| South America | Brazil | ||
| Argentina | |||
| Rest of South America | |||


Key Questions Answered in the Report
What is the current value of the personal finance tools market?
The market is valued at USD 1.71 billion in 2026 and is forecast to hit USD 2.21 billion by 2031.
Which application segment is expanding fastest?
Investment and wealth management tools are projected to grow at an 10.62% CAGR through 2031, outpacing budgeting modules.
Why are transaction-fee models gaining popularity?
Users show fatigue with subscriptions, and fee-per-transaction pricing lets providers align revenue with payment volume, driving a 9.88% CAGR for this model.
Which region will add the most new users by 2031?
Asia Pacific leads growth with an 8.55% CAGR, thanks to high smartphone penetration and supportive open-banking policies.
How do open-banking APIs impact user experience?
Standardized APIs deliver real-time data sharing, enabling instant cash-flow alerts and reducing login failures compared to legacy screen-scraping.
What security measures reduce breach risk for personal finance apps?
Zero-knowledge encryption, biometric authentication, and mandatory multi-factor login reduce credential exposure and improve user trust.
Page last updated on:


