Polycarbonate (PC) Market Size and Share
Market Overview
| Study Period | 2021 - 2031 |
|---|---|
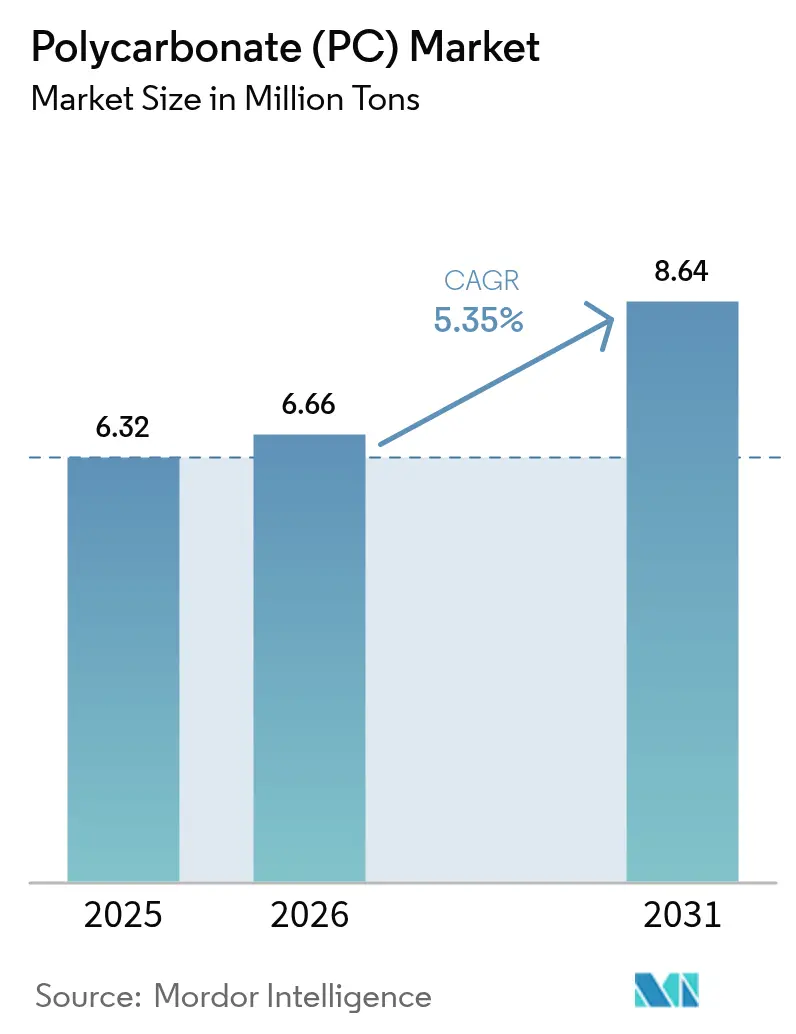
| Market Volume (2026) | 6.66 Million tons |
| Market Volume (2031) | 8.64 Million tons |
| Growth Rate (2026 - 2031) | 5.35% CAGR |
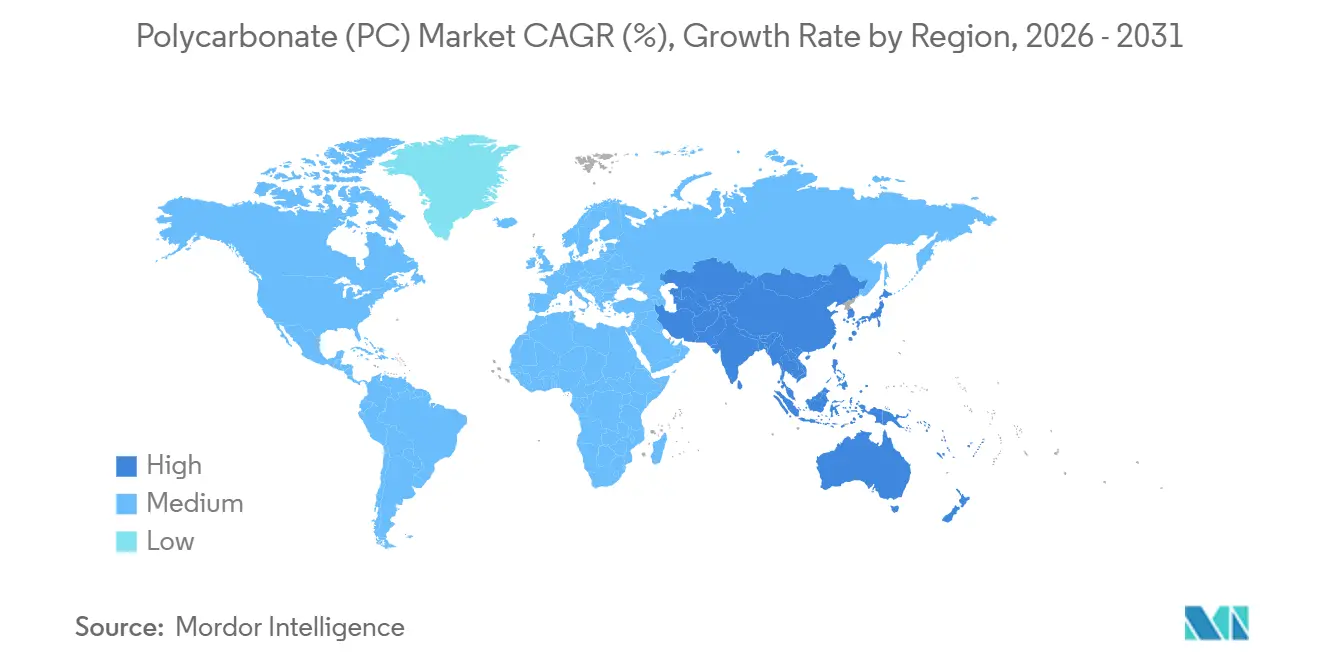
| Fastest Growing Market | Asia Pacific |
| Largest Market | Asia Pacific |
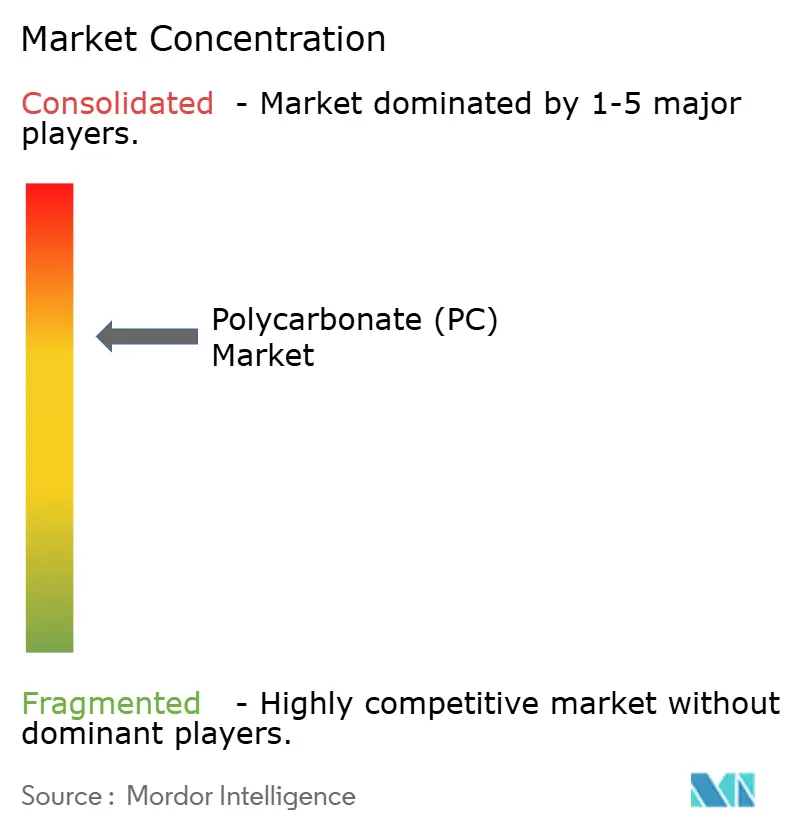
| Market Concentration | Medium |
Major Players *Disclaimer: Major Players sorted in no particular order Image © Mordor Intelligence. Reuse requires attribution under CC BY 4.0. | |
Polycarbonate (PC) Market Analysis by Mordor Intelligence
The Polycarbonate Market size is projected to expand from 6.32 million tons in 2025 and 6.66 million tons in 2026 to 8.64 million tons by 2031, registering a CAGR of 5.35% between 2026 to 2031. As demand surges for lightweight glazing in battery-electric vehicles and UL94 V-0 housings gain traction in consumer electronics, regional fire-safety mandates further bolster the polycarbonate market. This growth occurs even as bio-based copolyesters make inroads into certain packaging niches. In the Asia-Pacific region, robust vertical integration ensures feedstock security. Meanwhile, in Europe and North America, circular-economy regulations incentivize producers who certify recycled content and offer life-cycle data. While capacity expansions in China and India maintain a plentiful supply, specialty-grade availability can tighten. This is especially true as compounders develop new formulations - flame-retardant, UV-stable, or dielectric-tuned - for 5G infrastructure. Consequently, the value chain experiences a split: commodity sheet extruders grapple with price point pressures, while compounders leveraging coating, co-extrusion, and take-back programs clinch premium contracts.
Key Report Takeaways
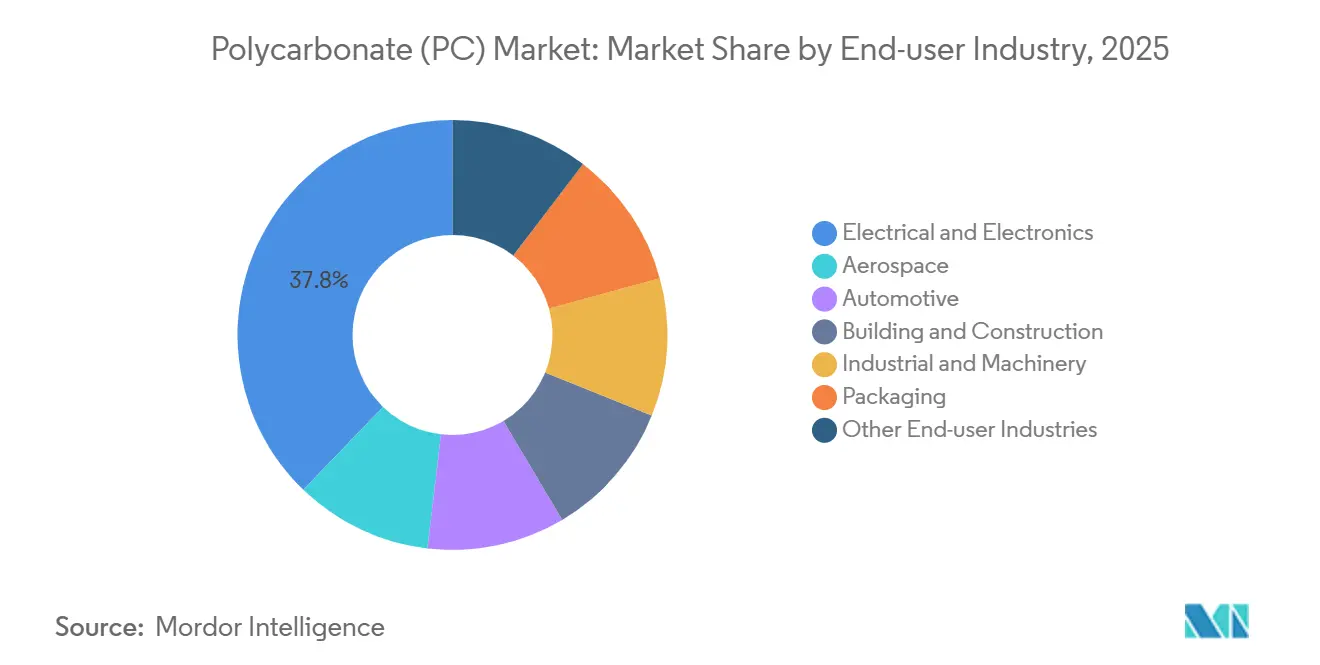
- By end-user industry, the electrical and electronics sector held a 37.78% market share of the polycarbonate market in 2025, and is projected to advance at a 6.83% CAGR from 2026 to 2031.
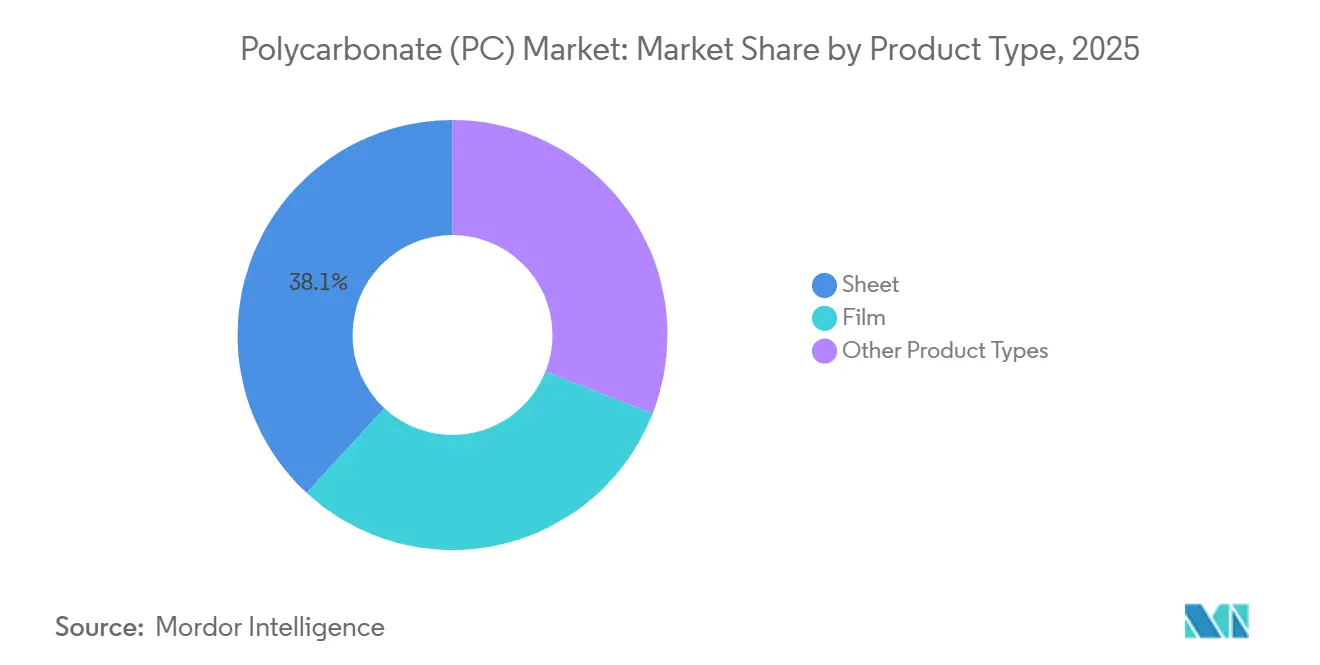
- By product type, the sheet segment captured 38.11% of the Polycarbonate market size in 2025; the film segment is projected to expand at a 7.28% CAGR from 2026 to 2031.
- By geography, the Asia-Pacific region accounted for 65.22% of the Polycarbonate market share in 2025; it is forecasted to grow at a 5.69% CAGR from 2026 to 2031.
Note: Market size and forecast figures in this report are generated using Mordor Intelligence’s proprietary estimation framework, updated with the latest available data and insights as of 2026.
Global Polycarbonate (PC) Market Trends and Insights
Drivers Impact Analysis*
| Drivers | (~) % Impact on CAGR Forecast | Geographic Relevance | Impact Timeline |
|---|---|---|---|
| EV lightweight-glazing boom | +1.2% | Global, with concentration in China, EU, North America | Medium term (2-4 years) |
| Electronics flame-retardant demand spike | +1.4% | APAC core (China, South Korea, Japan), spill-over to North America | Short term (≤ 2 years) |
| LED optics diffusion surge | +0.8% | Global, led by China and India in residential/commercial lighting | Medium term (2-4 years) |
| 5G mm-wave radome adoption | +0.6% | APAC (China, South Korea), North America urban corridors | Long term (≥ 4 years) |
| EU-CPR fire-safe facade mandate | +0.9% | EU-27, UK, with early adoption in Germany, France, Netherlands | Short term (≤ 2 years) |
| Source: Mordor Intelligence | |||
EV Lightweight-Glazing Boom
In an effort to extend driving ranges, automakers are replacing tempered glass with polycarbonate glazing. This change not only reduces component mass but also enhances the driving range of mid-size electric cars. High-performance grades, such as SABIC’s LEXAN EXL, combine UV-stable substrates with hard coats that resist abrasion, ensuring panoramic roofs remain clear for a decade. Teijin’s infrared-reflective Panlite sheet reduces cabin heat, easing the burden on HVAC systems, and increases the vehicle's range in warmer climates[1]“Panlite Polycarbonate Sheets,” Teijin Limited, teijin.com. With battery costs stabilizing, designers are incorporating features such as heads-up displays, acoustic damping layers, and electrochromic dimming into glazing. These enhancements require multilayer polycarbonate films with precise birefringence control. This growing demand has increased contract values for compounders capable of in-line co-extrusion and coating, highlighting a significant capability gap that commodity sheet producers find challenging to address.
Electronics Flame-Retardant Demand Spike
As lithium-ion batteries continue to dominate smartphones, wearables, and cloud hardware, fire-safety standards across supply chains have become more stringent. Thanks to halogen-free, phosphorus-based additives, polycarbonate housings can now achieve a UL94 V-0 certification at a mere 1.5 millimeters, all while maintaining impact strength and mold flow[2]“UL 94 Flammability Standards,” UL, ul.com. In 2024, Sumitomo Bakelite introduced a flexible, V-0 polycarbonate film that can withstand reflow soldering. This innovation enables smartphone manufacturers to streamline board layouts and increase component counts. Similarly, base-station suppliers are adopting low-loss films for their antenna radomes. Furthermore, in compliance with IEC 62368-1 standards, flame-retardant enclosures are now essential in power supplies and battery packs. These concurrent advancements highlight a reinforcing trend, driving the polycarbonate market forward during the forecast period of 2026–2031, even against a backdrop of commodity resin oversupply.
LED Optics Diffusion Surge
As the global shift towards solid-state lamps accelerates, architects and OEMs are increasingly opting for optically tuned polycarbonate sheets. These sheets skillfully diffuse intense point sources, creating smooth luminance fields. With prismatic structures molded into their surfaces, they redirect beams at programmed angles, achieving impressive light transmission while effectively minimizing glare in retail ceilings. Exolon’s CRYLUX diffuser, enhanced with titanium dioxide nanoparticles, elevates color rendering to meet the stringent standards of the DesignLights Consortium. From warehouse conversions, parking-garage upgrades, and horticultural grow-houses, the preference for polycarbonate over glass is significant. This preference is due to its shatter resistance, lighter weight, and the ease of field cutting. Furthermore, specialty compounders are innovating multilayer films that block harmful UV-C rays while permitting photosynthetically active radiation. This advancement is expanding the horizons of the polycarbonate market, particularly in controlled-environment agriculture.
5G mm-Wave Radome Adoption
Urban 5G networks are increasingly turning to compact radomes, which must keep dielectric constants below a set threshold and maintain loss tangents within an acceptable range, particularly in the 24-39 GHz spectrum. Polycarbonate not only satisfies these rigorous standards but also presents a notable cost advantage over PTFE and ceramics. Covestro’s Makrolon TC grade, known for its limited moisture absorption, guarantees radio transparency even after facing outdoor weathering cycles from -40 °C to +85 °C. Echoing this trend, bid specifications in the Asia-Pacific region for 2025 mandated a UV-stabilized PC that shows minimal yellowing post extended QUV-A exposure, effectively eliminating non-additivated resins from consideration. With operators increasingly embedding antennas into streetlights and building facades, the demand for injection-molded, color-matched housings has surged, propelling the growth of the polycarbonate market.
Restraints Impact Analysis*
| Restraints | (~) % Impact on CAGR Forecast | Geographic Relevance | Impact Timeline |
|---|---|---|---|
| BPA feedstock price volatility | -0.7% | Global, acute in China and EU due to phenol oversupply | Short term (≤ 2 years) |
| Shift toward bio-based copolyesters | -0.5% | North America, EU in food-contact and consumer goods | Medium term (2-4 years) |
| Closed-loop recycling quotas pressuring virgin PC | -0.4% | EU, China, with pilot programs in Japan and South Korea | Long term (≥ 4 years) |
| Source: Mordor Intelligence | |||
BPA Feedstock Price Volatility
Price fluctuations in Bisphenol A (BPA), a key component in polycarbonate raw materials, have made resin margins particularly sensitive. By 2026, an oversupply of phenol, coupled with a lukewarm demand for downstream resin, led to a decline in Chinese spot BPA prices. This price decline compressed the profit margins of integrated producers. Meanwhile, European producers, faced with soaring energy and chlorinated solvent costs, opted to idle their interfacial lines for maintenance. This decision tightened the availability of specialty grades, pushing electronics OEMs to explore dual sourcing. Furthermore, a spike in propylene prices led to a contraction in acetone supply. This shift altered the phenol-acetone price ratio, creating challenges for non-integrated polycarbonate producers who found themselves paying a premium for spot acetone. Such market upheavals have prompted mid-tier suppliers to contemplate backward integration or shift focus to the more profitable specialty polycarbonate market niches.
Shift Toward Bio-Based Copolyesters and Closed-Loop Quotas
Brand owners are increasingly opting for Eastman’s Tritan and Mitsubishi’s DURABIO as BPA-free alternatives for hydration bottles, infant products, and food appliances. Both alternatives offer glass-like clarity, avoiding controversies surrounding endocrine disruption. Notably, DURABIO’s incorporation of isosorbide feedstock leads to a reduction in cradle-to-gate CO2 emissions. This reduction aligns well with the Scope 3 reduction commitments made by electronics OEMs. As these shifts occur, regulators in the EU and China are setting quotas on recycled content. For example, the EU has set a target for recycled content in packaging by 2030, a goal that far exceeds the current limits of mechanical recycling. In a significant move, Covestro’s pilot methanolysis plant has achieved high yields, successfully recycling post-consumer PC into virgin-grade BPA. However, the commercial success of such ventures is heavily reliant on policy incentives, such as mass-balance certificates. Without a rapid increase in production, the demand for virgin resin in the polycarbonate market could decline faster than anticipated.
*Our forecasts treat driver/restraint impacts as directional, not additive. The impact forecasts reflect baseline growth, mix effects, and variable interactions.
Segment Analysis
By End-User Industry: Electronics Accelerate Ahead of Mobility and Construction
In 2025, electrical and electronics applications accounted for 37.78% of the polycarbonate market volume, with projections forecasting a 6.83% annual growth rate through the 2026–2031 period. Key components such as smartphones, base stations, and data center racks depend on UL94 V-0 films, battery shields, and radome covers. These applications necessitate a combination of impact toughness and thin-wall processability, resulting in steady demand for flame-retardant and dielectric-stable compounds. While automotive consumption was small, the launch of each new battery-electric vehicle sees an uptick in molded polycarbonate usage. This material finds application in roof modules, lighting lenses, and interior trims, spurring growth even in mature vehicle markets. In the building and construction arena, multiwall sheets have long been the go-to for skylights and greenhouse roofs. However, architects are increasingly favoring smart-glass curtain walls, which offer integrated PV layers or dynamic shading. This trend is gradually diminishing the market share once dominated by sheet extruders in the polycarbonate sector.
Long-tail categories demonstrate notable resilience. Industrial machinery guards and LED-housing diffusers are now crafted from recycled-content resins. While these resins might not meet optics-grade benchmarks, they effectively extend the utility of feedstock. Though packaging represents a minor segment of the market, there is a pronounced demand for high-heat, clear polycarbonate. This specific variant is vital for medical sterilization trays and reusable pharmaceutical vials, given its ability to withstand rigorous autoclave cycles. The aerospace industry, known for its low-volume but high-margin dynamics, places immense emphasis on stringent standards. Cockpit windows and cabin dividers must comply with the FAA's flame, smoke, and toxicity regulations, a standard met by only a handful of resins. This rarity bolsters the standing of established suppliers. Such a wide-ranging application spectrum serves as a cushion, protecting the overall polycarbonate market from sudden downturns in any single sector.


By Product Type: Films Close the Gap on Dominant Sheet Formats
In 2025, sheet formats held a 38.11% share of the volume, yet film variants, with a 7.28% CAGR during the forecast period of 2026–2031, are steering the polycarbonate market toward thinner substrates. Automotive head-up displays demand 100-micron films, emphasizing the need for 3H pencil hardness and impeccable optical clarity. In contrast, electronics manufacturers seek sub-75-micron rolls, which must withstand 200,000 folding cycles in cutting-edge smartphones. Notably, specialized film lines with inline abrasion and anti-reflection coatings are achieving higher margins than traditional twin-screw sheet extruders, underscoring a widening competitive divide in the polycarbonate sector.
Demand for sheets remains steady, as commercial greenhouses, noise-barrier walls, and skylight panels continue to depend on 4- to 16-millimeter ribbed structures for insulation values under 1 W/m²-K. However, growth is increasingly leaning toward flexible films. These films play a crucial role in applications such as conformal antennas, electrochromic auto-dimming features, and printed-electronics layers. Furthermore, while pellet sales for injection molding dominate the polycarbonate landscape, they primarily serve intricate lamp housings, medical-device shells, and machinery guards, prioritizing toughness over optical clarity. This product diversification prevents any single form factor from monopolizing the polycarbonate market's future, spreading risk but also moderating economies of scale for commodity items.
Geography Analysis
In 2025, the Asia-Pacific region led the global polycarbonate market, capturing 65.22% of the volume. Projections forecast a consistent 5.69% CAGR for the region during the 2026–2031 period. China emerged as a key player, accounting for nearly half of the regional demand. The country boasted melt-phase plants with substantial capacities. These facilities secured feedstock via captive phenol-acetone lines and established a strong export channel, primarily sending surplus sheets and films to Southeast Asia. Concurrently, Japan and South Korea bolstered their premium capacities, focusing on specialized resins - optical, bio-attributed, and ultra-low-volatile. These premium offerings found a market in Tier-1 electronics and automotive sectors across the region.
North America and Europe, together, made up a significant portion of the 2025 consumption. In the United States, automotive-grade resins predominantly came from domestic plants in Texas and Indiana. Furthermore, niche compounders in Minnesota and Ohio developed specialized blends for medical and aerospace sectors, achieving FDA and FAA endorsements. In Europe, demand was heavily centered in Germany, France, and Italy. However, the rollout of Digital Product Passport regulations and Euroclass fire ratings drove up compliance costs. This development inadvertently benefited larger integrated producers, while smaller extruders, lacking a solid traceability framework, faced challenges.
South America, along with the Middle-East and Africa, added to the global demand but experienced a faster growth rate, spurred by expanding infrastructure projects, greenhouse farming, and automotive assembly. Brazilian resins came from local compounding units in São Paulo, with additional imports from Asia. In Saudi Arabia, mega-projects favored UV-stable multiwall sheets for stadium roofs and rail hubs. Meanwhile, Africa's market was still in its infancy. South Africa and Nigeria sourced UV-protected glazing for agriculture. However, hurdles such as currency fluctuations and the temptation of cheaper acrylic alternatives tempered swift growth.

Competitive Landscape
The Polycarbonate (PC) market is moderately consolidated. White-space investments are increasing in the field of chemical depolymerization. At present, producers are hesitant to support a commercial line due to the need for clearer policies. Furthermore, expertise in tooling is emerging as a critical advantage. Suppliers proficient in simultaneous extrusion-coating processes for optical films are achieving higher profit margins. By integrating anti-scratch and conductive layers in a single pass, they are significantly reducing customer takt times. This advanced process sophistication not only strengthens the position of technology leaders but also creates substantial entry barriers for new market participants, ensuring stable earnings even as commodity spreads tighten.
Polycarbonate (PC) Industry Leaders
Covestro AG
SABIC
LOTTE Chemical Corporation
Mitsubishi Chemical Group Corporation
TEIJIN LIMITED
- *Disclaimer: Major Players sorted in no particular order

Recent Industry Developments
- March 2025: Haldia Petrochemicals Ltd., a petrochemical producer in India, unveiled its plan to set up a polycarbonate production facility in West Bengal, backed by an investment of USD 1 billion. By opting to use the available land at its current Haldia site, the company underscores its strategic move towards diversifying deeper into the downstream chemical sector.
- January 2025: Covestro AG announced channeling a low triple-digit million Euro investment into its Hebron site in the United States. The company plans to develop several new production lines and bolster infrastructure to produce tailored polycarbonate compounds and blends.


Global Polycarbonate (PC) Market Report Scope
Polycarbonate (PC) is defined as a lightweight, durable, and high-performance amorphous engineering thermoplastic characterized by exceptional impact resistance, high optical clarity similar to glass, and heat resistance up to 140 °C. It is dimensionally stable, easily molded, and widely used in safety gear, automotive components, and electronics.
The polycarbonate market is segmented by end-user industry, product type, and geography. By end-user industry, the market is segmented into aerospace, automotive, building and construction, electrical and electronics, industrial and machinery, packaging, and other end-user industries. By product type, the market is segmented into sheet, film, and other product types. The report also covers the market size and forecasts for the market in 20 countries across major regions. For each segment, the market sizing and forecasts are done based on volume (Tons).
| Aerospace |
| Automotive |
| Building and Construction |
| Electrical and Electronics |
| Industrial and Machinery |
| Packaging |
| Other End-user Industries |
| Sheet |
| Film |
| Other Product Types |
| Asia-Pacific | China |
| Japan | |
| India | |
| South Korea | |
| Australia | |
| Malaysia | |
| Rest of Asia-Pacific | |
| North America | Canada |
| Mexico | |
| United States | |
| Europe | Germany |
| France | |
| Italy | |
| United Kingdom | |
| Russia | |
| Rest of Europe | |
| South America | Brazil |
| Argentina | |
| Rest of South America | |
| Middle-East and Africa | Saudi Arabia |
| United Arab Emirates | |
| Nigeria | |
| South Africa | |
| Rest of Middle-East and Africa |
| By End-user Industry | Aerospace | |
| Automotive | ||
| Building and Construction | ||
| Electrical and Electronics | ||
| Industrial and Machinery | ||
| Packaging | ||
| Other End-user Industries | ||
| By Product Type | Sheet | |
| Film | ||
| Other Product Types | ||
| By Geography | Asia-Pacific | China |
| Japan | ||
| India | ||
| South Korea | ||
| Australia | ||
| Malaysia | ||
| Rest of Asia-Pacific | ||
| North America | Canada | |
| Mexico | ||
| United States | ||
| Europe | Germany | |
| France | ||
| Italy | ||
| United Kingdom | ||
| Russia | ||
| Rest of Europe | ||
| South America | Brazil | |
| Argentina | ||
| Rest of South America | ||
| Middle-East and Africa | Saudi Arabia | |
| United Arab Emirates | ||
| Nigeria | ||
| South Africa | ||
| Rest of Middle-East and Africa | ||


Market Definition
- End-user Industry - Building & Construction, Packaging, Automotive, Aerospace, Industrial Machinery, Electrical & Electronics, and Others are the end-user industries considered under the polycarbonate market.
- Resin - Under the scope of the study, virgin polycarbonate resin in its primary forms such as powder, granule, etc. are considered.
| Keyword | Definition |
|---|---|
| Acetal | This is a rigid material that has a slippery surface. It can easily withstand wear and tear in abusive work environments. This polymer is used for building applications such as gears, bearings, valve components, etc. |
| Acrylic | This synthetic resin is a derivative of acrylic acid. It forms a smooth surface and is mainly used for various indoor applications. The material can also be used for outdoor applications with a special formulation. |
| Cast film | A cast film is made by depositing a layer of plastic onto a surface then solidifying and removing the film from that surface. The plastic layer can be in molten form, in a solution, or in dispersion. |
| Colorants & Pigments | Colorants & Pigments are additives used to change the color of the plastic. They can be a powder or a resin/color premix. |
| Composite material | A composite material is a material that is produced from two or more constituent materials. These constituent materials have dissimilar chemical or physical properties and are merged to create a material with properties unlike the individual elements. |
| Degree of Polymerization (DP) | The number of monomeric units in a macromolecule, polymer, or oligomer molecule is referred to as the degree of polymerization or DP. Plastics with useful physical properties often have DPs in the thousands. |
| Dispersion | To create a suspension or solution of material in another substance, fine, agglomerated solid particles of one substance are dispersed in a liquid or another substance to form a dispersion. |
| Fiberglass | Fiberglass-reinforced plastic is a material made up of glass fibers embedded in a resin matrix. These materials have high tensile and impact strength. Handrails and platforms are two examples of lightweight structural applications that use standard fiberglass. |
| Fiber-reinforced polymer (FRP) | Fiber-reinforced polymer is a composite material made of a polymer matrix reinforced with fibers. The fibers are usually glass, carbon, aramid, or basalt. |
| Flake | This is a dry, peeled-off piece, usually with an uneven surface, and is the base of cellulosic plastics. |
| Fluoropolymers | This is a fluorocarbon-based polymer with multiple carbon-fluorine bonds. It is characterized by high resistance to solvents, acids, and bases. These materials are tough yet easy to machine. Some of the popular fluoropolymers are PTFE, ETFE, PVDF, PVF, etc. |
| Kevlar | Kevlar is the commonly referred name for aramid fiber, which was initially a Dupont brand for aramid fiber. Any group of lightweight, heat-resistant, solid, synthetic, aromatic polyamide materials that are fashioned into fibers, filaments, or sheets is called aramid fiber. They are classified into Para-aramid and Meta-aramid. |
| Laminate | A structure or surface composed of sequential layers of material bonded under pressure and heat to build up to the desired shape and width. |
| Nylon | They are synthetic fiber-forming polyamides formed into yarns and monofilaments. These fibers possess excellent tensile strength, durability, and elasticity. They have high melting points and can resist chemicals and various liquids. |
| PET preform | A preform is an intermediate product that is subsequently blown into a polyethylene terephthalate (PET) bottle or a container. |
| Plastic compounding | Compounding consists of preparing plastic formulations by mixing and/or blending polymers and additives in a molten state to achieve the desired characteristics. These blends are automatically dosed with fixed setpoints usually through feeders/hoppers. |
| Plastic pellets | Plastic pellets, also known as pre-production pellets or nurdles, are the building blocks for nearly every product made of plastic. |
| Polymerization | It is a chemical reaction of several monomer molecules to form polymer chains that form stable covalent bonds. |
| Styrene Copolymers | A copolymer is a polymer derived from more than one species of monomer, and a styrene copolymer is a chain of polymers consisting of styrene and acrylate. |
| Thermoplastics | Thermoplastics are defined as polymers that become soft material when it is heated and becomes hard when it is cooled. Thermoplastics have wide-ranging properties and can be remolded and recycled without affecting their physical properties. |
| Virgin Plastic | It is a basic form of plastic that has never been used, processed, or developed. It may be considered more valuable than recycled or already used materials. |


Research Methodology
Mordor Intelligence follows a four-step methodology in all our reports.
- Step-1: Identify Key Variables: The quantifiable key variables (industry and extraneous) pertaining to the specific product segment and country are selected from a group of relevant variables & factors based on desk research & literature review; along with primary expert inputs. These variables are further confirmed through regression modeling (wherever required).
- Step-2: Build a Market Model: In order to build a robust forecasting methodology, the variables and factors identified in Step-1 are tested against available historical market numbers. Through an iterative process, the variables required for market forecast are set and the model is built on the basis of these variables.
- Step-3: Validate and Finalize: In this important step, all market numbers, variables and analyst calls are validated through an extensive network of primary research experts from the market studied. The respondents are selected across levels and functions to generate a holistic picture of the market studied.
- Step-4: Research Outputs: Syndicated Reports, Custom Consulting Assignments, Databases & Subscription Platforms


