
Paracetamol Market Size and Share
Market Overview
| Study Period | 2020 - 2031 |
|---|---|
| Market Size (2026) | USD 12.05 Billion |
| Market Size (2031) | USD 14.93 Billion |
| Growth Rate (2026 - 2031) | 4.38 % |
| Fastest Growing Market | Asia Pacific |
| Largest Market | South America |
| Market Concentration | Medium |
Major Players *Disclaimer: Major Players sorted in no particular order Image © Mordor Intelligence. Reuse requires attribution under CC BY 4.0. | |
Paracetamol Market Analysis by Mordor Intelligence
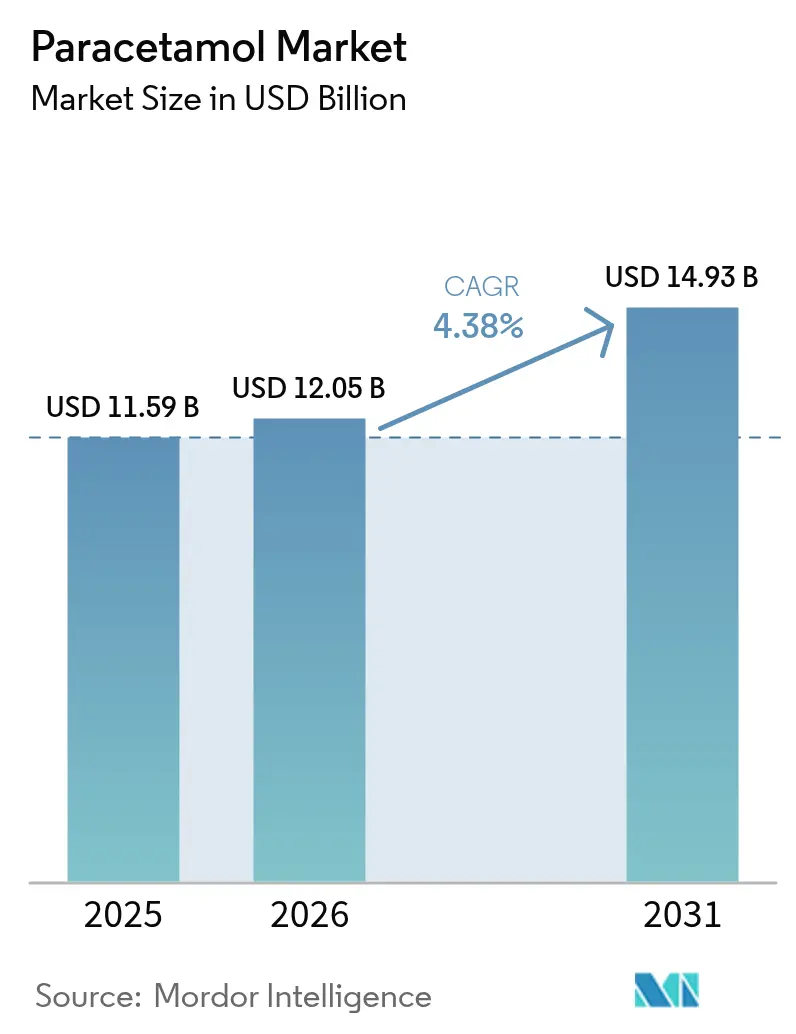
The Paracetamol Market size was valued at USD 11.59 billion in 2025 and is estimated to grow from USD 12.05 billion in 2026 to reach USD 14.93 billion by 2031, at a CAGR of 4.38% during the forecast period (2026-2031).
Long-term demand is underpinned by chronic pain prevalence, guideline endorsements that position acetaminophen as the first-line non-opioid therapy, and hospital adoption of intravenous formulations to curb opioid exposure. At the same time, ample generic capacity from Asian API hubs and new European reshoring projects have pushed average bulk-drug prices down more than 70% since the COVID-19 peak, compressing manufacturer margins. Safety regulators are tightening dosing, labeling, and pack-size rules in response to concerns about hepatotoxicity, raising compliance costs but also creating product-differentiation headroom for extended-release and taste-masked innovations. Digital dispensing, particularly e-prescription-enabled pharmacy platforms, continues to redirect volumes away from brick-and-mortar stores, accelerating the paracetamol market’s channel recalibration. Taken together, these countervailing forces produce moderate headline growth yet intense competition for value capture along the supply chain.
Key Report Takeaways
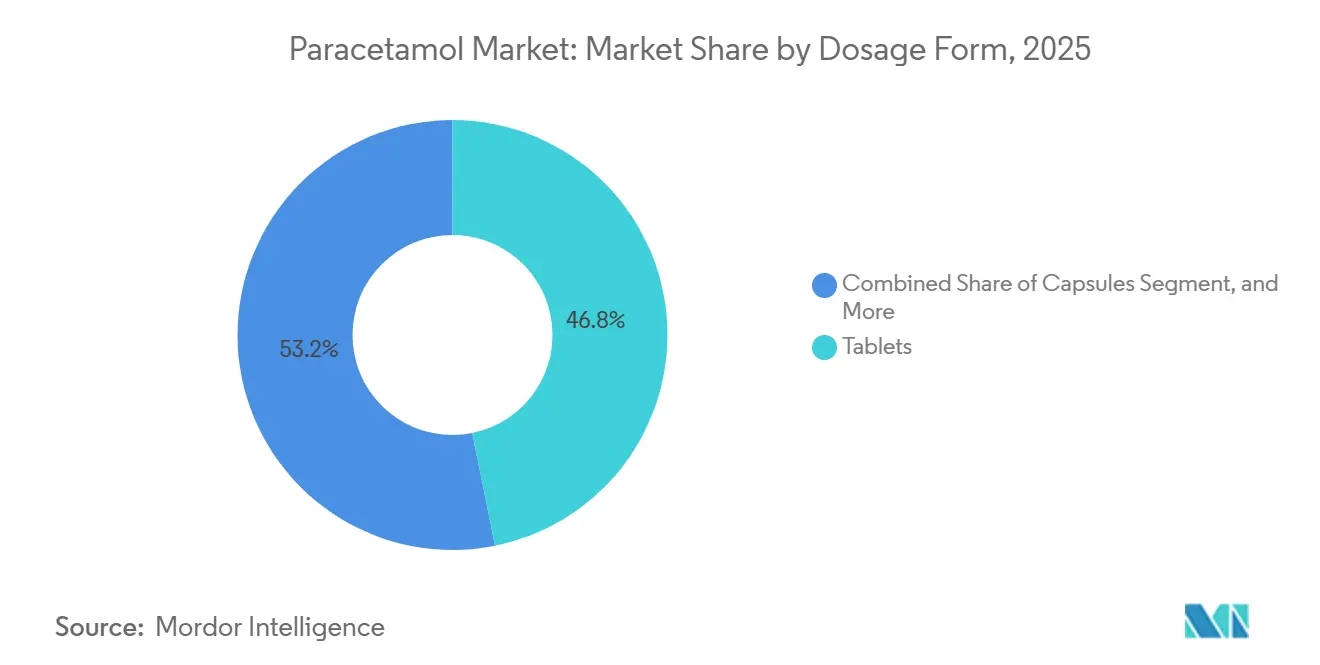
- By dosage form, tablets led with 46.83% of the paracetamol market share in 2025; liquid suspensions are the fastest-growing format, with a 4.86% CAGR through 2031.
- By application, pain management accounted for 39.27% of the paracetamol market in 2025, while fever reduction is advancing at a 6.63% CAGR through 2031.
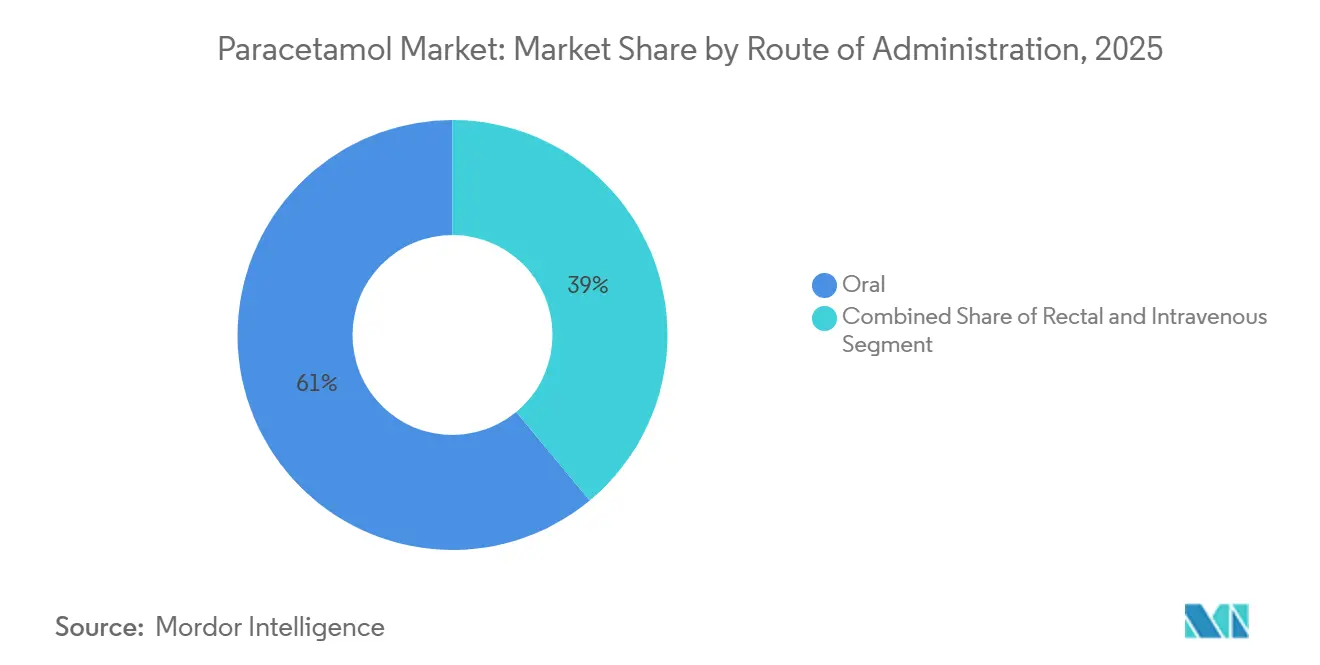
- By route of administration, oral products dominated with 61.02% revenue share in 2025; intravenous paracetamol is recording the highest growth at 5.63% CAGR over the forecast period.
- By distribution channel, retail pharmacies held 28.78% of 2025 revenues, but online pharmacies are set to expand at a 5.79% CAGR on the back of mandatory e-prescription rollouts across major European markets.
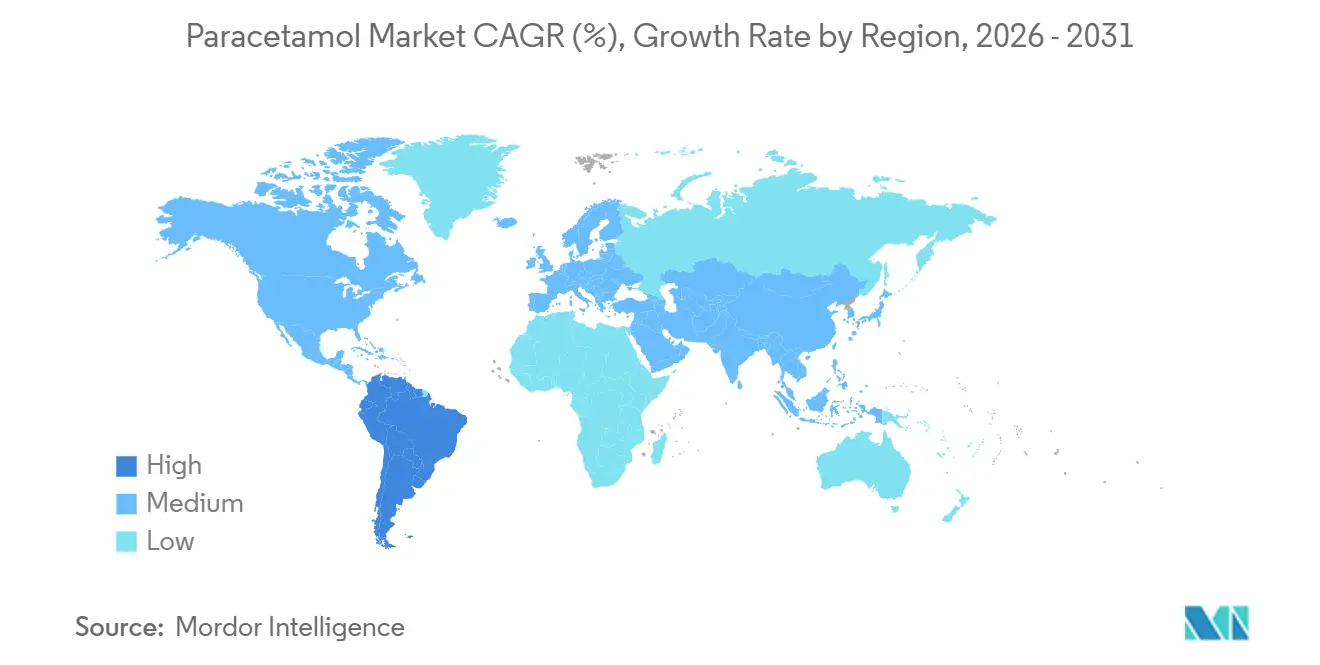
- By geography, North America commanded 34.12% 2025 sales, whereas Asia-Pacific is projected to post the strongest regional CAGR of 7.76% through 2031.
Note: Market size and forecast figures in this report are generated using Mordor Intelligence’s proprietary estimation framework, updated with the latest available data and insights as of 2026.
Market Trends and Insights
Drivers Impact Analysis of Paracetamol Market*
| Driver | (~) % Impact on CAGR Forecast | Geographic Relevance | Impact Timeline |
|---|---|---|---|
| Rising Prevalence of Pain- & Fever-Related Disorders | +0.7% | Global, most acute in aging North America and urbanizing Asia-Pacific | Medium term (2-4 years) |
| OTC Self-Medication Boom & Retail Channel Expansion | +0.8% | Global, led by e-prescription rollouts in Europe and direct-to-consumer services in North America | Short term (≤ 2 years) |
| Capacity Expansion of API & Finished-Dose Plants | +0.5% | Europe (France), India (production-linked incentives) | Long term (≥ 4 years) |
| Extended/Rapid-Release Formulation Innovation | +0.4% | North America and Europe premium OTC segments | Medium term (2-4 years) |
| Opioid-Sparing Surgical Protocols Driving IV Uptake | +0.6% | North America and Europe hospital formularies, emerging in GCC hospitals | Medium term (2-4 years) |
| Green-Chemistry Incentives & API Re-Shoring | +0.3% | Europe (ECHA mandates), United States onshoring subsidies | Long term (≥ 4 years) |
| Source: Mordor Intelligence | |||
Rising Prevalence of Pain- & Fever-Related Disorders
The updated CDC guideline explicitly lists acetaminophen before NSAIDs or opioids, reinforcing the paracetamol market’s clinical relevance. Pediatric vaccination programs add episodic demand because acetaminophen remains the recommended antipyretic for post-injection symptoms.[1]Centers for Disease Control and Prevention, “CDC Clinical Practice Guideline for Prescribing Opioids,” cdc.gov As global life expectancy rises, osteoarthritis, cancer pain, and post-operative recovery drive sustained baseline volumes. Although unit sales grow, profit capture depends on navigating private-label competition and insurer step-therapy policies that favor low-cost generics.
OTC Self-Medication Boom & Retail Channel Expansion
Regulatory moves that enable pharmacists to initiate therapy, such as England’s Pharmacy First program launched in 2024, have generated millions of reimbursed consultations, often resulting in over-the-counter analgesic recommendations.[2]National Institute for Health and Care Excellence, “Intravenous Paracetamol for Acute Pain,” nice.org.uk Simultaneously, Germany’s nationwide e-prescription system, fully enforced in 2024, has expanded the addressable online pharmacy audience, boosting basket sizes for household OTC staples. U.S. retailers capitalize on loyalty data to place targeted digital offers, steering shoppers toward exclusive-label acetaminophen ranges. These dynamics expand the paracetamol market’s non-prescription footprint, even as traditional drugstores confront foot traffic leakage.
Capacity Expansion of API & Finished-Dose Plants
Seqens broke ground on a 10,000-ton-per-year acetaminophen facility in France in December 2025, the largest Western investment in the molecule for more than two decades. India’s production-linked incentive (PLI) program, meanwhile, subsidizes backward integration, funding zero-liquid-discharge plants that meet European import standards. These projects diversify supply away from China, which currently delivers about 70% of global volume, and help governments secure critical medicine stockpiles. Accelerated approval pathways such as the U.S. FDA’s PreCheck, unveiled in 2025, further shorten construction-to-qualification timelines.
Extended/Rapid-Release Formulation Innovation
Hydroxypropyl methylcellulose matrices and Eudragit coatings maintain therapeutic plasma levels for up to 12 hours, enabling twice-daily dosing in chronic indications. Taste-masking breakthroughs such as chitosan-coated alginate beads achieving 99% encapsulation efficiency have reinvigorated pediatric suspensions, a sub-segment growing faster than the overall paracetamol market. Brands price these technologies at a 40-60% premium over immediate-release generics, cushioning margin declines from commodity tablets. Patent estates around bilayer architecture and gastro-retentive systems also extend exclusivity windows in otherwise crowded OTC aisles.
Restraints Impact Analysis of Paracetamol Market*
| Restraint | (~) % Impact on CAGR Forecast | Geographic Relevance | Impact Timeline |
|---|---|---|---|
| Hepatotoxicity/Over-Dose Safety Tightening | -0.5% | Australia, United Kingdom, United States | Short term (≤ 2 years) |
| Intense Generic Price Competition | -0.7% | North America and Europe retail segments | Short term (≤ 2 years) |
| API Supply-Chain Concentration & Tariff Risk | -0.4% | Global importers dependent on China | Medium term (2-4 years) |
| Pack-Size Restrictions Curbing Consumption | -0.3% | Australia (in force), potential EU adoption | Medium term (2-4 years) |
| Source: Mordor Intelligence | |||
Hepatotoxicity/Over-Dose Safety Tightening
Australia limited non-prescription pack sizes in February 2025 after averaging 225 hospitalizations and 50 overdose deaths per year, mirroring earlier U.K. curbs.[3]Therapeutic Goods Administration, “Final Decisions on Paracetamol Scheduling Amendment,” tga.gov.au The U.S. FDA’s June 2024 proposed order for OTC analgesics addresses pediatric dosing and life-threatening skin reactions, with a final rule expected by late 2025. Implementation will force relabeling and could discourage high-strength formats. Litigation over potential neuro-developmental effects during pregnancy is adding further reputational risk for leading brands.
Intense Generic Price Competition
Spot API quotes in India fell from INR 900 per kg during the pandemic to INR 250 in 2024, a 72% drop that filtered through to finished-dose bids in the United States’ federal supply schedules. Mallinckrodt’s Q3 2024 acetaminophen revenue shrank 30.3% year-on-year to USD 40 million, underscoring the down-cycle. Private-label substitution by large retail chains piles additional pressure on branded OTC players, accelerating consolidation among smaller formulators.
*Our forecasts treat driver/restraint impacts as directional, not additive. The impact forecasts reflect baseline growth, mix effects, and variable interactions.
Paracetamol Market Segment Analysis
By Dosage Form:
Tablets Continue to Lead While Liquids AccelerateTablets held 46.83% of the paracetamol market share in 2025, reflecting consumer familiarity, a mechanically stable shelf life, and low unit costs. Liquids, however, registered the highest forecast CAGR at 4.86% through 2031, propelled by pediatric dosing needs and advanced taste-masking science that now achieves 99% encapsulation efficiency. Extended-release bilayer tablets priced at a median 45% premium over immediate-release lines defend retailer margins in mature Western markets, though cost sensitivity in emerging economies still favors plain generics.
Green-chemistry manufacturing routes such as solvent-free ball-mill acetylation yield up to 96% conversion while trimming Scope 3 emissions, a feature increasingly cited in European tenders. As retailers expand their private-label offerings, formulators that can supply both commodity tablets and value-added liquids are best positioned to balance volume with profitability. Premium chewable and fast-dissolving variants also attract adult consumers seeking convenience, further widening the paracetamol market.



By Application:
Pain Management Dominates; Fever Reduction Rises FastPain management contributed 39.27% of the 2025 value, anchored by 50 million U.S. chronic-pain sufferers and similar prevalence patterns across Europe and Japan. Fever-reduction therapies, though smaller, are slated to grow 6.63% annually, buoyed by vaccine-related prophylaxis and rising pharmacy-administered immunizations. Cold-and-flu combination SKUs bundle acetaminophen with decongestants or antihistamines, capturing incremental share in winter seasons and driving basket upselling.
Higher frequency of point-of-care testing at community pharmacies channels symptomatic patients directly into OTC purchase pathways. Yet, possible pack-size caps and safety labeling expansions could blunt fever-related volume upside, a factor the paracetamol industry must monitor when planning capacity.
By Route of Administration:
Oral Rules; IV Gains in HospitalsOral formats accounted for 61.02% of 2025 sales, thanks to their ease of self-administration and broad OTC availability. Intravenous paracetamol, currently small in absolute dollars, is projected to advance 5.63% annually on hospital adoption of opioid-sparing protocols. Rectal suppositories retain niche roles where oral intake is contraindicated.
Expanded generic competition has already reduced the average U.S. wholesale-acquisition cost of IV acetaminophen by roughly 25% since 2024. Nevertheless, formulary committees still value its distinct pharmacokinetic profile for immediate postoperative pain. These opposing price-volume dynamics imply steady, rather than explosive, revenue growth for IV suppliers.
By Distribution Channel:
Physical Pharmacies Hold Lead but Online SurgesRetail pharmacies captured 28.78% of 2025 global value, leveraging front-of-store promotions and pharmacist counseling. Online pharmacies, boosted by nationwide e-prescription mandates in Germany and ongoing telehealth adoption in the United States, are on a 5.79% growth trajectory. Hospital pharmacies remain essential for IV-dose throughput, while emerging automated-dispensing kiosks may capture incremental convenience-driven transactions in urban Asia.
For branded OTC players, shifting promotional spend toward digital retail media and search optimization becomes critical for maintaining visibility as storefront traffic fragments. The paracetamol market is thus migrating toward a hybrid omnichannel equilibrium.
Geography Analysis
North America Paracetamol Market
North America accounted for 34.12% of 2025 revenue, underpinned by entrenched OTC infrastructures and extensive hospital formularies that include intravenous acetaminophen. FDA’s forthcoming monograph amendments will likely raise labeling costs but are not expected to materially impede volume. Consolidation is underway as Kimberly-Clark moves to acquire Kenvue for USD 48.7 billion, signaling the strategic value of heritage brands despite litigation noise. API self-sufficiency remains low, making the region sensitive to tariff turbulence and Chinese output fluctuations.
Europe Paracetamol Market
Europe features robust regulatory oversight and rapidly expanding online dispensing channels. Germany’s full e-prescription rollout in 2024 immediately lifted electronic pharmacy turnover, illustrating latent demand for digital convenience. France’s 10,000-ton Seqens plant, scheduled to be fully online by end-2025, exemplifies the bloc’s bid to cut API import exposure. Environmental standards are tightening, with ECHA’s 2025 priority list foreshadowing possible discharge-limit legislation for paracetamol waste streams.
APAC Paracetamol Market
Asia-Pacific is the fastest-growing region, with a 7.76% CAGR, driven by large populations, improving insurance coverage, and government generic-medicine schemes. India alone operates 8,787 Janaushadhi stores that retail low-cost paracetamol nationwide. The India-U.K. Free Trade Agreement, which entered into force in July 2025, eliminated tariffs on 99% of pharma exports, opening a premium European market for Indian producers. China remains the dominant API exporter, while its domestic consumption benefits from Healthy China 2030's preventive-care priorities.
MEA and South America Paracetamol Market
The Middle East & Africa show divergent patterns: GCC states localize drug manufacturing under mandatory insurance expansion, while Sub-Saharan countries rely on donor-funded procurement. South America grapples with currency volatility, yet Brazil’s public-sector programs secure a baseline for essential analgesics. Overall, emerging markets collectively provide the paracetamol market with double-digit growth headroom despite pricing constraints.

Regulatory Landscape
Paracetamol supply into regulated markets is governed by well-established GMP and quality-system frameworks for APIs and finished doses, including FDA cGMP requirements and ICH quality guidelines (notably Q7 for API GMP and Q10 for pharmaceutical quality systems), alongside pharmacopeial specifications such as the BP 2025 paracetamol monograph (99.0% to 101.0% content requirement). Safety-driven controls also continue to shape OTC access and use, with Australia implementing tighter non-prescription pack-size limits in February 2025, which reinforces more prescriptive labeling and distribution practices for high-volume analgesics.
Trade and industrial policy has become a more direct variable for procurement and sourcing decisions. In April 2026, the White House issued a Section 232 proclamation introducing a 100% ad valorem duty on imports of patented pharmaceuticals and associated ingredients, with enforcement mechanisms tied to compliance status and an implementation milestone noted for late July 2026. The policy design also outlines pathways to lower or zero duty rates for companies that execute MFN pricing agreements with HHS and commit to domestic onshoring. For paracetamol value chains, this adds a U.S. market access and documentation layer on top of baseline quality compliance, affecting supplier qualification, inventory positioning, and localization strategies.
Competitive Landscape
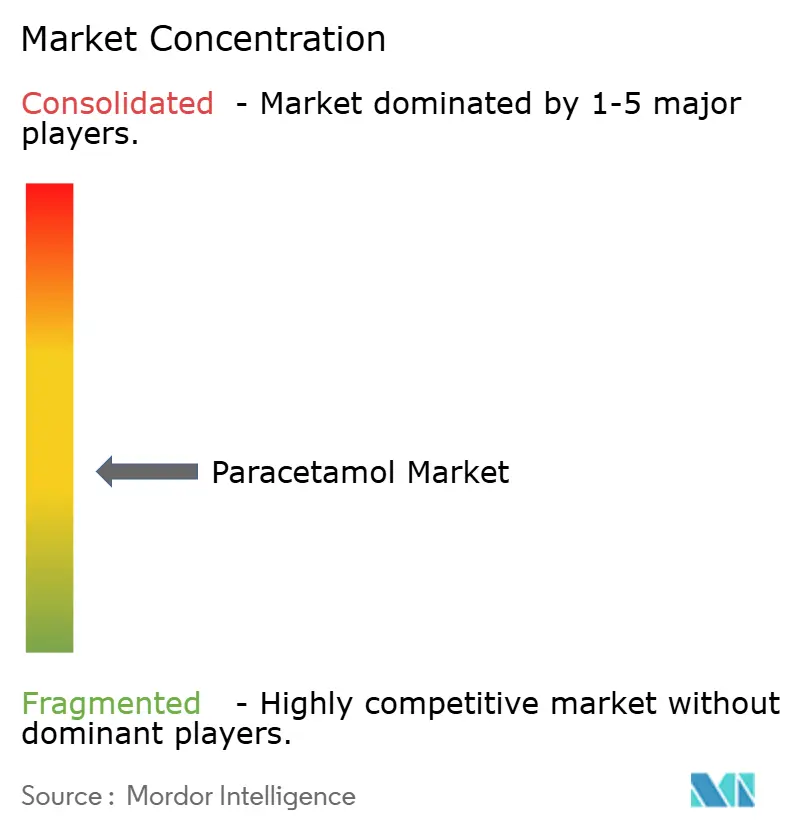
The paracetamol market remains fragmented, with more than 40 meaningful API makers and hundreds of finished-dose licensees worldwide. Chinese suppliers deliver roughly 70% of bulk output, leveraging coal-based phenol-acetone routes to retain scale cost advantages. India, boosted by PLI incentives, is rising as an alternative source, although raw-material imports still link its cost base to China.
Seqens’ French project exemplifies Western governments’ drive for strategic autonomy even at higher ex-works prices. Mallinckrodt’s U.S. facility, the only domestic API plant, continues to face under-utilization, and 2024 sales fell 30.3% year-on-year. Downstream, Kimberly-Clark’s pending purchase of Kenvue consolidates trademark heft and OTC shelf space, potentially boosting its bargaining power with retailers. Innovators focus on extended-release technology and sugar-free pediatric lines to command price premiums, while private labels push unit economies of scale. Sustainability credentials, such as low solvent use, zero-liquid discharge, and renewable energy, are emerging as a new yardstick in European tenders, favoring early adopters of green chemistry.
Paracetamol Industry Leaders
GlaxoSmithKline plc
Mallinckrodt Pharmaceuticals
Sun Pharmaceutical Industries Ltd.
Teva Pharmaceuticals, Inc.
Sanofi SA
- *Disclaimer: Major Players sorted in no particular order
Paracetamol Market Companies Covered in this Report
- Anqiu Lu’an Pharmaceutical
- Bayer
- Dr. Reddy’s Laboratories
- GlaxoSmithKline
- Granules India Ltd.
- Hebei Jiheng Pharmaceutical
- Johnson & Johnson
- Mallinckrodt Pharmaceuticals
- Novartis
- Perrigo Company
- Sanofi
- Seqens SAS
- Shanghai Laser & Optics Century (SLOC)
- Sun Pharmaceuticals Industries
- Teva Pharmaceutical Industries
- Viatris
- Zhejiang Kangle Pharmaceutical

Market Opportunities and Future Outlook
Supply-chain regionalization and vertical integration are recurring themes as buyers weigh low-cost generic sourcing against continuity and compliance risks. Seqens confirmed its France 2030-supported paracetamol reshoring project at Roussillon, targeting an operational milestone by end-2026 and citing capacity of 15,000 tons per year. India continues to add upstream chemical capacity tied to acetaminophen economics, such as Farmson Basic Drugs inaugurating an INR 300 crore acetic anhydride unit in Vadodara in November 2025. Together, these moves create room for API and finished-dose suppliers that can combine competitive pricing with traceable, audited, and lower-impact manufacturing routes aligned with European tender requirements.
In consumer health, opportunity concentrates more in differentiated formats and in export-oriented packaging and line modernization than in commodity tablets alone. Haleon Pakistan disclosed multiple investments in January 2026 linked to the Panadol base portfolio and liquids, including a USD 10 million Jamshoro facility expansion for exports and additional funding to expand and modernize Panadol Liquid packaging, signaling active capacity placement around branded paracetamol and pediatric-friendly formats. At the same time, tightening guidance and potential sales restrictions are becoming a design constraint and a product-planning lever: Belgiums FAMHP opened a public consultation (19 May to 19 June 2026) on updated guidance for marketing authorization holders of paracetamol products, and the UK MHRA has publicly discussed exploring legislative actions to restrict excessive sales. This points to greater emphasis on compliant pack architectures, clearer dosing communication, and controlled-channel strategies across Europe.
Recent Industry Developments in Paracetamol Market
- May 2026: GlaxoSmithKline Pharmaceuticals Ltd (GSK India) reported that supply chain disruptions across the fiscal year ended March 31, 2026 constrained availability of certain key products and accelerated efforts to strengthen resilience through diversified sourcing and contingency planning. The disclosure indicates that continuity-of-supply execution is becoming a competitive differentiator for high-volume analgesics where substitution and retailer switching are easy.
- August 2025: The Federal Register listed the withdrawal of approval for 39 NDAs, including Ofirmev (acetaminophen) 1000 mg/100 mL. The action reinforced lifecycle compliance and documentation rigor for legacy paracetamol brands, and can shift hospital procurement toward actively maintained filings and alternative suppliers.
- February 2025: Australia enacted tighter non-prescription paracetamol pack-size limits, restricting non-pharmacy retail to 16 tablets and pharmacy sales to 50 tablets without pharmacist oversight. The policy change directly alters unit economics and channel mix for OTC players and elevates the importance of pack architecture, labeling, and pharmacist-mediated supply models.


Paracetamol Market Report Scope and Research Methodology
Market Definition and Coverage
For this methodology, the paracetamol market is defined as the global value of paracetamol sold for pain and fever care, across common dosage forms and routes, and tracked through key healthcare distribution channels.
Scope exclusions: We do not count adjacent analgesic molecules, combination therapies where paracetamol is not the primary active, or non-therapeutic chemical uses.
Segments Covered in This Report
- By Dosage Form
- Tablets
- Capsules
- Liquid Suspensions
- Powders & Granules
- By Application
- Pain Management
- Fever Reduction
- Cold & Flu
- Others (Dental, Post-operative, etc.)
- By Route of Administration
- Oral
- Rectal
- Intravenous
- By Distribution Channel
- Retail Pharmacies
- Hospital Pharmacies
- Online Pharmacies
- By Geography
- North America
- United States
- Canada
- Mexico
- Europe
- Germany
- United Kingdom
- France
- Italy
- Spain
- Rest of Europe
- Asia-Pacific
- China
- Japan
- India
- Australia
- South Korea
- Rest of Asia-Pacific
- Middle East & Africa
- GCC
- South Africa
- Rest of Middle East & Africa
- South America
- Brazil
- Argentina
- Rest of South America
- North America
Data Sources, Market Sizing, and Validation
Desk Research
We begin by building a fact base on demand, policy signals, and supply availability, so the model starts with real-world constraints rather than just trend lines. Public sources such as WHO medicine guidance, US FDA safety communications, European regulator safety notices, and national health statistics portals are used to understand usage patterns and labeling rules. We also refer to sources such as UN Comtrade and national customs portals to observe trade flows for key intermediates and finished formats where reporting is available.
Alongside that, we review company annual reports, investor presentations, and association websites to map product availability, channel mix, and major capacity additions. Paid subscription sources for company financials and market intelligence are used to confirm ownership structures and approximate revenue exposure when public disclosures are limited. These desk sources are not exhaustive, and many other references are used for data collection, cross-checks, and clarification during the work.
Primary Interviews and Surveys
Primary work focuses on validating what drives value, not only volume, since pricing and channel mix can change the market total quickly. We speak with participants across manufacturing, formulation, distribution, and retail channels, then we recheck assumptions by region to reflect differences in OTC access, hospital use, and route preferences. These conversations also help finalize realistic price progression and substitution behavior during periods of supply tightness.
Distribution of primary research fieldwork respondents
| Company type | Respondent position | Region |
|---|---|---|
| Top tier: 25% | CXOs: 14% | APAC: 45% |
| Mid tier: 61% | Functional/Unit leaders: 32% | EMEA: 35% |
| Smaller Players: 14% | Managers: 54% | Americas: 20% |
Market-Sizing & Forecasting
Sizing starts with a top-down demand pool build using population-linked consumption signals and healthcare access indicators, which are then converted into value using region-specific pricing logic. For paracetamol, practical inputs that tend to matter most include OTC versus hospital channel share, typical pack sizes and strength mix, the split of oral versus IV usage, and cold-and-flu seasonality that affects near-term pull. We also track trade and supply signals as a reasonableness check, since disruptions in API availability can show up as short-lived price lifts and channel rationing.
Those results are corroborated with selective bottom-up approximations, where we roll up a sample of supplier and channel revenues, and we test implied volumes using average selling price times estimated units. When company disclosures are incomplete, gaps are handled through peer ratios, capacity-based plausibility checks, and follow-up questions to keep totals realistic. For forecasting, we mainly use scenario analysis, where baseline demand is adjusted using agreed assumptions on inflation, channel mix shifts, and route adoption, and then the path is reviewed with experts so the growth story stays consistent with what buyers and sellers expect.
Data Validation & Update Cycle
Validation is done in steps so issues are caught early and corrected before sign-off. We compare modeled totals against independent signals like import and export direction, major price moves, and noticeable changes in route or channel mix, then investigate any large variance. If an input looks unstable, respondents are re-contacted and the assumption is rewritten so the change is traceable.
Each report is refreshed annually, and interim updates are made when there is a material event such as a major capacity change, supply disruption, or a significant regulatory action affecting usage. Before delivery, an analyst runs a fresh pass through the model and notes to ensure the latest updates are reflected in the final numbers clients receive.
Mordor Intelligence's Paracetamol Market Size Measured Against Other Published Estimates
Published market sizes for paracetamol can look far apart even when they are talking about the same medicine, because the boundary choices are rarely identical. Differences usually come from what is counted as market value, which channels are included, and how pricing is handled across countries and over time.
By tracking route and channel splits and then refreshing ASP assumptions through interviews, Mordor Intelligence keeps the paracetamol total tied to finished-dose demand rather than mixing it with narrower API-only views or growth-only statements.
Benchmark comparison
| Source | Market Size | Gaps in Research Methodology |
|---|---|---|
| Mordor Intelligence | USD 11.59 B (2025) | |
| Global Consultancy A | USD 0.83 B (2025) | This estimate appears to size a narrower value pool that aligns more with API or a limited product coverage, which can exclude retail finished-dose revenue and understate the impact of distribution channel mix. |
| Market Research Publisher B | USD 0.73 B (2024) | The figure is anchored to a different base year and a smaller scope definition, and it is presented in USD millions with a limited segmentation lens, which can miss cross-channel pricing and higher-value routes. |
The spread mainly comes down to what each study counts and how value is constructed from volume and pricing. When scope is kept consistent across dosage forms, routes, and channels, and the price logic is checked against real purchasing behavior, the resulting market size becomes easier to reproduce and explain.


Key Questions Answered in the Report
How large will the paracetamol market be by 2031?
It is forecast to reach USD 14.93 billion by 2031, growing at a 4.38% CAGR from 2026.
Which dosage form is growing fastest?
Liquid suspensions are expected to expand at a 4.86% CAGR through 2031, driven by pediatric demand and advanced taste-masking.
Why is intravenous paracetamol gaining usage?
Multimodal surgical guidelines show it can cut opioid consumption by about 30% in the first four hours post-procedure.
What impact do pack-size limits have on sales?
Australia’s 2025 restriction is expected to trim unit volumes, and similar rules under review in Europe could modestly dampen per-capita consumption.
How are environmental rules shaping production?
ECHA’s 2025 assessment of paracetamol metabolites encourages solvent-free and zero-liquid-discharge technologies, influencing API plant design in Europe.
Page last updated on:


 Your data is secure and never sold or shared.


