
Topical Analgesic Market Size and Share
Market Overview
| Study Period | 2020 - 2031 |
|---|---|
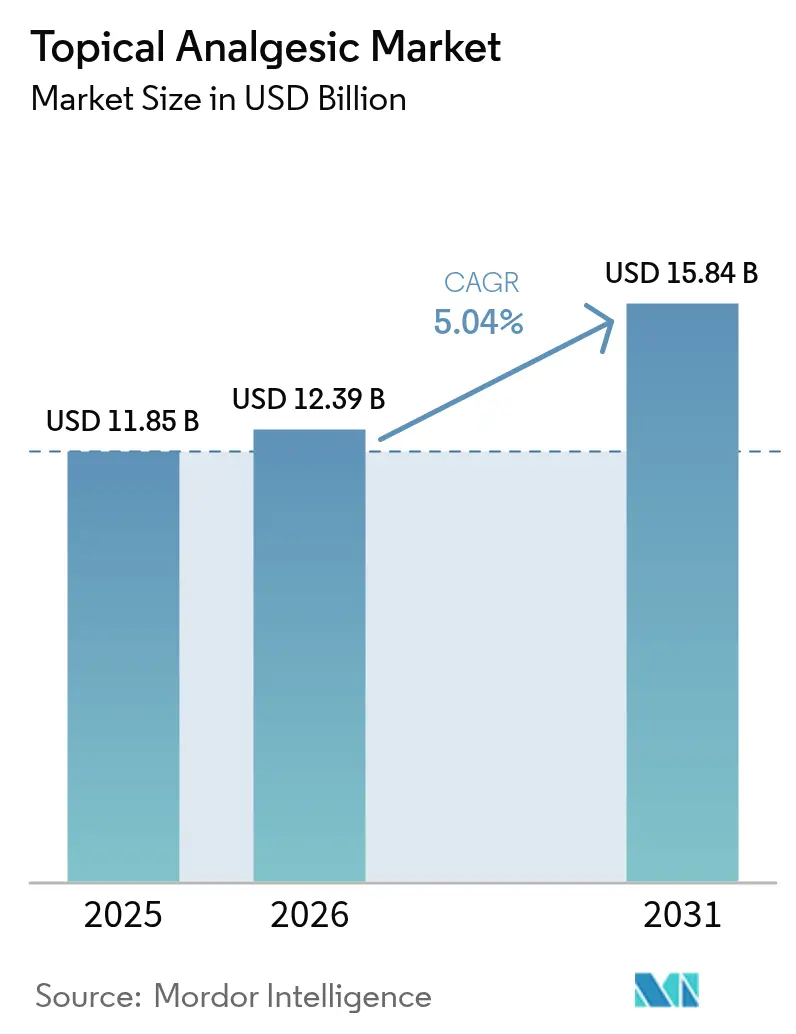
| Market Size (2026) | USD 12.39 Billion |
| Market Size (2031) | USD 15.84 Billion |
| Growth Rate (2026 - 2031) | 5.04 % |
| Fastest Growing Market | Asia Pacific |
| Largest Market | North America |
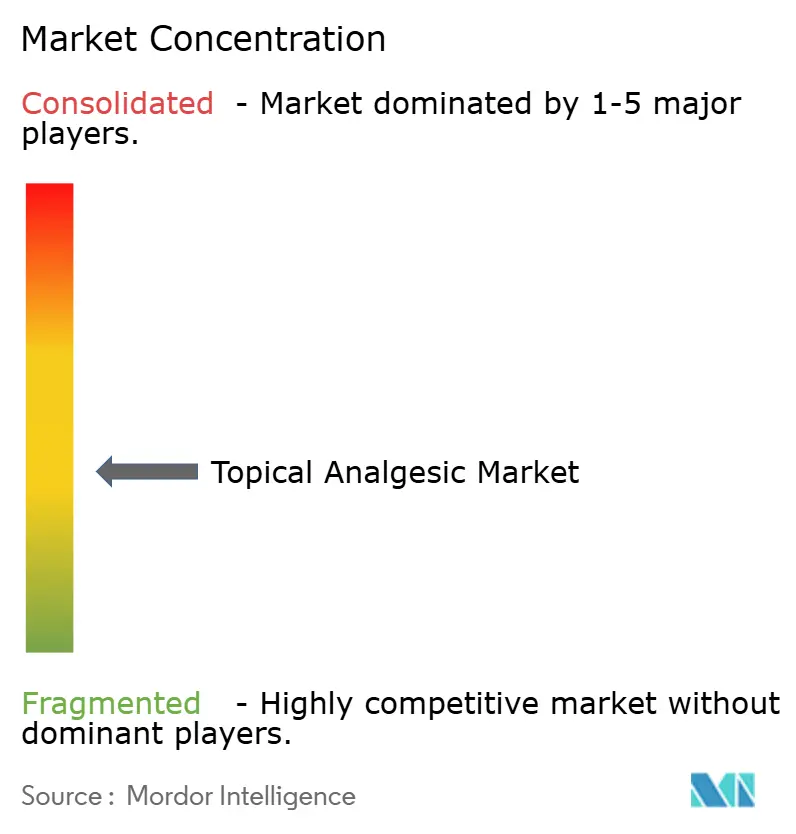
| Market Concentration | Medium |
Major Players *Disclaimer: Major Players sorted in no particular order Image © Mordor Intelligence. Reuse requires attribution under CC BY 4.0. | |
Topical Analgesic Market Analysis by Mordor Intelligence
The Topical Analgesic Market size is expected to increase from USD 11.85 billion in 2025 to USD 12.39 billion in 2026 and reach USD 15.84 billion by 2031, growing at a CAGR of 5.04% over 2026-2031.
Innovation is shifting value from commodity menthol rubs toward smart transdermal platforms that offer controlled release, sensor feedback, and lower systemic exposure. Regulatory agencies on three continents now require prescribers to exhaust topical options before initiating oral opioids, accelerating patch uptake among postoperative and chronic-pain patients. E-commerce, telehealth, and subscription models are reshaping channel economics by giving brands direct access to users, while vertical integration into menthol and capsaicin supply protects margins against crop volatility. Competition is tightening as retailer private labels undercut legacy OTC pricing, forcing incumbents to invest in patent-protected delivery systems that defend shelf space.
Key Report Takeaways
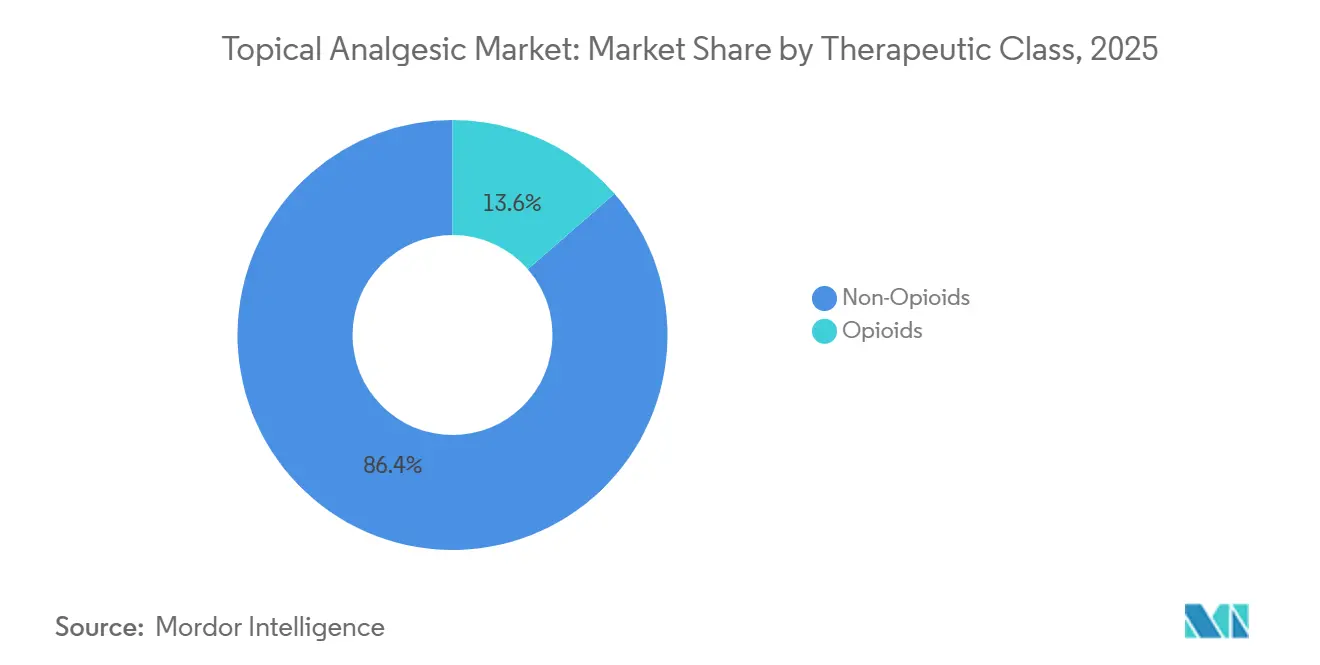
- By therapeutic class, non-opioids led with 86.42% of the topical analgesic market share in 2025, while opioid patches are advancing at a 7.06% CAGR through 2031.
- By formulation, creams and gels accounted for 45.71% of revenue in 2025; patches are the fastest-growing format, with a 9.03% CAGR to 2031.
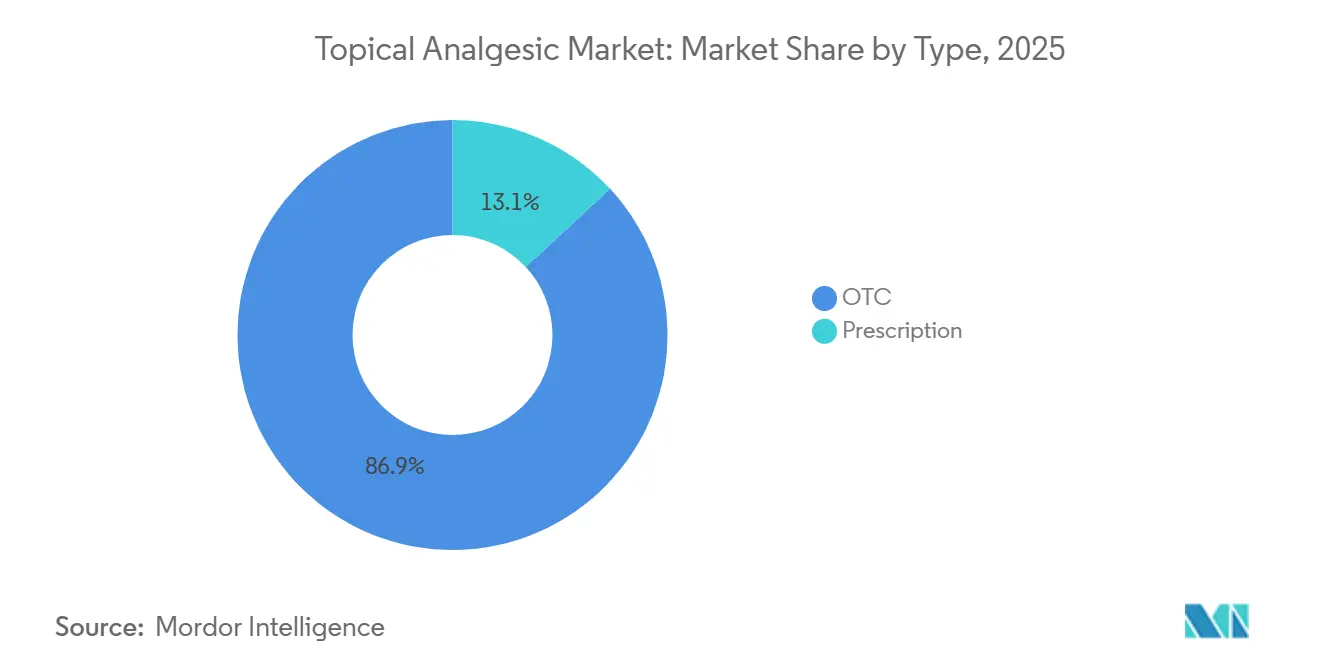
- By product type, OTC lines accounted for 86.92% of 2025 sales, yet prescription topicals are projected to grow at an 8.18% CAGR.
- By distribution channel, retail pharmacies accounted for 57.08% of revenue in 2025, while online pharmacies are expanding at an 8.41% CAGR.
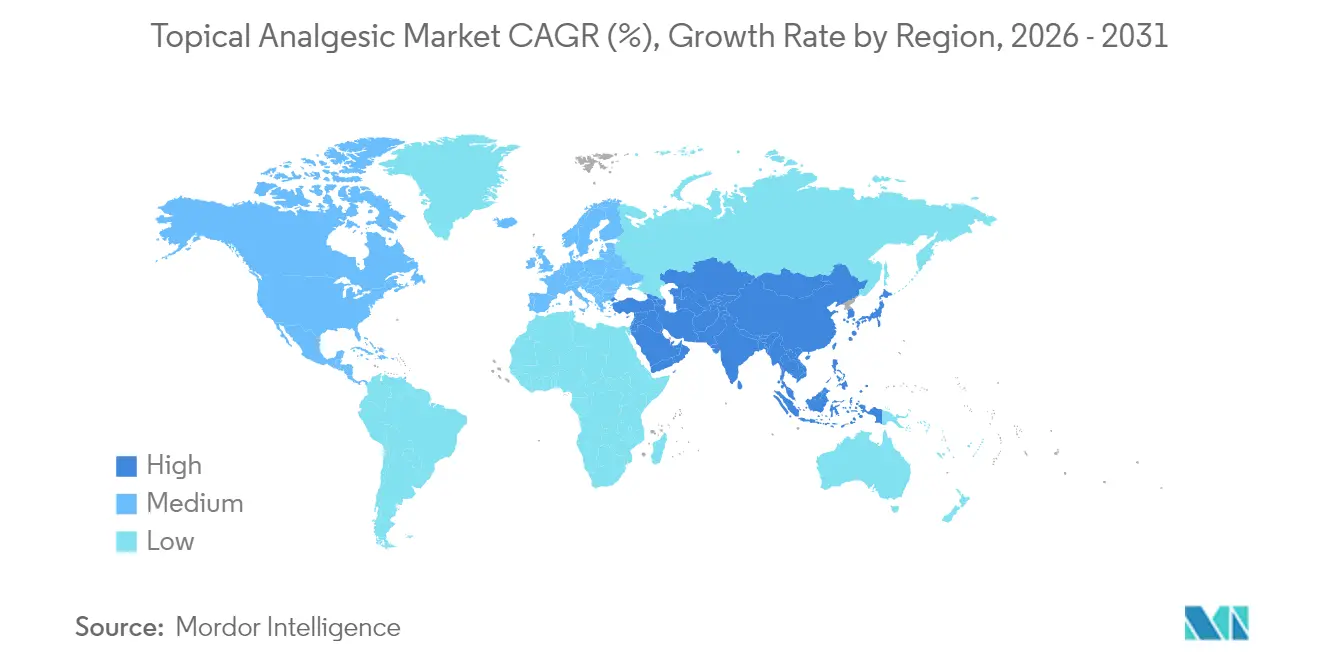
- By geography, North America dominated with 38.11% revenue in 2025, but Asia-Pacific is forecast to register the highest CAGR of 6.07% through 2031.
Note: Market size and forecast figures in this report are generated using Mordor Intelligence’s proprietary estimation framework, updated with the latest available data and insights as of 2026.
Market Trends and Insights
Drivers Impact Analysis of Topical Analgesic Market*
| Driver | (~) % Impact on CAGR Forecast | Geographic Relevance | Impact Timeline |
|---|---|---|---|
| Aging Population & Arthritis Prevalence | +1.2% | Global – highest in Japan, South Korea, Western Europe | Long term (≥ 4 years) |
| Preference for Non-Opioid Pain Management | +1.5% | North America, Europe, Australia | Medium term (2-4 years) |
| Transdermal & Formulation Technology Advances | +0.9% | Global – early uptake in North America, Asia-Pacific | Medium term (2-4 years) |
| OTC & E-Commerce Channel Expansion | +0.8% | Global – pronounced in Asia-Pacific and North America | Short term (≤ 2 years) |
| Smart-Patch Integration with Sports-Tech | +0.4% | North America, Western Europe, urban Asia-Pacific | Long term (≥ 4 years) |
| Regulatory Fast-Track for Localized Analgesics | +0.6% | United States, European Union, Japan | Medium term (2-4 years) |
| Source: Mordor Intelligence | |||
Aging Population & Arthritis Prevalence
Global osteoarthritis cases are projected to top 1 billion by 2050, with the steepest gains in Asia-Pacific where life expectancy growth outpaces orthopedic capacity.[1]R. Hunter et al., “Global Burden of Osteoarthritis,” Nature Medicine, nature.com Japan already reports 29.1% of its citizens aged 65+, creating sustained demand for diclofenac gels and capsaicin patches that avoid the side effects of oral NSAIDs. South Korea fast-tracked high-dose lidocaine patches in 2024 to curb outpatient musculoskeletal visits. In the United States, 32.5 million adults carry an osteoarthritis diagnosis, half of whom are seniors who favor topical therapy to limit polypharmacy. Packaging now emphasizes single-dose sachets and ergonomic pumps suited to dexterity limits in older hands.
Preference for Non-Opioid Pain Management
FDA guidance issued in 2025 requires comparative trials versus opioids before systemic approval, effectively elevating topical NSAIDs and anesthetic patches to first-line status for localized pain. CMS now offers higher facility payments when ambulatory centers achieve opioid-free discharge, a policy credited with doubling lidocaine-patch utilization year over year.[2]Centers for Medicare & Medicaid Services, “Opioid-Free Reimbursement Incentive,” cms.gov EMA and MHRA have echoed the stance, smoothing cross-border access for novel transdermals. Pharmaceutical R&D budgets are shifting toward polymers, permeation enhancers, and microneedles that meet these non-opioid mandates.
Transdermal & Formulation Technology Advances
Microneedle arrays that pierce 50-200 µm now deliver diclofenac over 72 hours without sting, as patent filings by Hisamitsu illustrate.[3]Japan Patent Office, “Microneedle Patch Patent JP-2024-33421,” jpo.go.jp Iontophoretic patches gained 510(k) clearance in 2025 for lidocaine, offering needle-free pain blocks during outpatient rehab sessions. Flexible 3-D-printed geometries matched to joint contours entered pilot roll-out in Europe in 2024. Phase-change gels that solidify on skin have improved retention on knees and elbows, driving premium pricing in sports channels. Collectively, these breakthroughs narrow efficacy gaps versus oral therapy and differentiate brands in an increasingly crowded topical analgesic market.
OTC & E-Commerce Channel Expansion
Online pharmacy revenue for topicals jumped 34% in 2024 and remained above 25% in 2025, aided by auto-replenishment plans that fit chronic-pain routines. Amazon Pharmacy’s Prime-integrated pain-management bundle reached 200 million U.S. members within weeks of launch. India and Brazil loosened rules on direct-to-consumer ads for topical NSAIDs, channeling marketing budgets into social platforms and live-commerce streams. Legacy brands are diverting slotting-fee budgets to search-engine optimization, marking a permanent shift in spend priorities across the topical analgesic market.
Restraints Impact Analysis of Topical Analgesic Market*
| Restraint | (~) % Impact on CAGR Forecast | Geographic Relevance | Impact Timeline |
|---|---|---|---|
| Variable Clinical Efficacy & Depth-Of-Pain Limits | −0.7% | Global – high in deep-joint pain prevalent cohorts | Medium term (2-4 years) |
| Skin Irritation / Unpleasant Sensory Attributes | −0.5% | Global – peak in humid tropical regions | Short term (≤ 2 years) |
| Stringent Global Quality & Approval Standards | −0.3% | Emerging markets – LATAM and MEA delays | Medium term (2-4 years) |
| Volatile Menthol & Capsaicin Supply | −0.4% | Global – acute for India, China sourcing corridors | Short term (≤ 2 years) |
| Source: Mordor Intelligence | |||
Variable Clinical Efficacy & Depth-Of-Pain Limits
Meta-analyses show topical NSAIDs cut pain 30-50% in superficial strains but fail to outperform placebo in hip osteoarthritis, limiting indications. Microdialysis studies confirm drug diffusion rarely exceeds 1.5 cm, challenging the treatment of deep joints in obese patients. Capsaicin patches cause burning severe enough for 15-20% drop-out rates, curbing repeat usage in neuropathic care. German and UK payers reimburse opioid patches only for oncology pain, restricting broader adoption. Developers now test combo formulas (NSAID + lidocaine) but must prove synergy to satisfy regulators, elongating timelines in the topical analgesic market.
Skin Irritation / Unpleasant Sensory Attributes
Contact dermatitis occurs in 2-8% across formulations, peaking in propylene glycol blends. Initial capsaicin burning deters adherence; 60% of first-time users report discomfort that overshadows efficacy. Menthol’s cooling is pleasant for some yet irritating for others, complicating positioning of counterirritant SKUs. Multi-day patches can trap sweat and cause folliculitis in humid climates, limiting penetration in Southeast Asia. Post-market vigilance mandates in Japan and Korea add compliance costs that weigh on smaller market entrants.
*Our forecasts treat driver/restraint impacts as directional, not additive. The impact forecasts reflect baseline growth, mix effects, and variable interactions.
Topical Analgesic Market Segment Analysis
By Therapeutic Class:
Opioid Patches Outpace as Abuse-Deterrent Designs MatureNon-opioids captured 86.42% revenue in 2025, anchored by generic diclofenac, ibuprofen gels, and menthol rubs. Yet opioid patches are projected to deliver a 7.06% CAGR, nearly 50% faster than non-opioid growth, propelled by buprenorphine and fentanyl systems that limit diversion risk with tamper-evident matrices. Buprenorphine received chronic-pain approval in 2024, and hospice protocols now use it to replace oral morphine, citing lower respiratory-depression rates. Fentanyl remains oncologic standard despite black-box labeling; new aversive-agent designs satisfy regulators and sustain hospital formularies. NSAIDs dominate non-opioids, but commoditization is pressuring brands to differentiate via penetration-enhancement polymers. Capsaicin serves a small yet profitable niche in neuropathic management; high-dose supervised patches exceed USD 180 million in sales. Counterirritants persist in sports-medicine OTC kits, while salicylates fade amid concerns about aspirin sensitivity.
Pipeline attention is turning toward combo patches, NSAID plus anesthetic or opioid plus permeation enhancer, to broaden indications. Yet regulators demand clear additive benefit, raising Phase III costs.



By Formulation:
Transdermal Dominates Growth CurveCreams and gels delivered 45.71% of 2025 revenue owing to consumer familiarity and rapid onset, but patches will log the highest 9.03% CAGR thanks to 72-hour dosing convenience. Matrix patches outstrip reservoir formats due to lower dose-dump risk and easier manufacturing. Microneedle prototypes nearing launch promise quicker onset, a feature expected to pull market share from gels in acute-pain use cases. Sprays and aerosols appeal to users wanting hands-free coverage on backs or hamstrings, yet face headwinds from propellant restrictions in Europe. Foams and ointments remain marginal but thrive in hospital wound-care settings where occlusion aids penetration.
Continuous-release polymers and phase-change carriers allow patches to deliver steady plasma levels competitive with oral dosing while avoiding gastrointestinal exposures. Manufacturers integrating Bluetooth sensors into backing layers create value-add for payers seeking adherence data in high-utilization cohorts.
By Type:
Prescription Class Accelerates on High-Potency EntriesOTC products owned 86.92% of topline in 2025, but regulatory fast-tracks for high-concentration capsaicin and lidocaine are lifting prescription CAGR to 8.18%. CMS reimbursement tied to opioid-free discharges is boosting hospital demand for prescription lidocaine infusion patches. Compounding pharmacies fill gaps with custom ketamine-lidocaine-gabapentin creams, though FDA scrutiny of 503A pharmacies may tighten this avenue. FDA’s 2024 switch guidance allows sponsors to reclassify prescription NSAIDs to OTC after safety accrual, enabling lifecycle management that maximizes revenue arcs. Prescription growth is concentrated in neuropathic and cancer pain, while OTC momentum remains in sports injuries and arthritis self-care.
By Distribution Channel:
Digital Disruption Redraws Access MapRetail pharmacies still lead with 57.08% share, but online pharmacies will post the fastest 8.41% CAGR. Amazon Pharmacy bundled topicals with virtual PT in 2025, enrolling 1.2 million chronic-pain members within six months. JD Health achieves same-day delivery in 300 Chinese cities, eroding brick-and-mortar advantage. Trade spend is migrating from in-store displays to digital search and influencer marketing, advantaging agile newcomers versed in e-commerce. Over the forecast horizon, online channels could control 25% of topical analgesic market sales, reshaping promotional economics across the industry.
Geography Analysis
North America Topical Analgesic Market
North America generated 38.11% of 2025 revenue, underpinned by high per-capita spend and payer mandates that favor topical approaches to curb opioid misuse. U.S. seniors, numbering 65 million, rely on diclofenac gels for arthritis and 5% lidocaine patches for neuropathic pain, while Canada’s public formularies added high-strength diclofenac in 2024. Mexico liberalized pharmacy-only status for 1% diclofenac in 2025, lifting OTC volume despite counterfeit concerns in informal retail channels.
APAC Topical Analgesic Market
Asia-Pacific is forecast to expand at 6.07% CAGR as Japan shifts from poultice plasters to electronics-enabled patches funded by JPY 8 billion in government grants. China approved 18 domestic topical SKUs in 2025, undercutting imported brands by up to 60% and extending reach into lower-tier cities. India sees 8.3% CAGR through 2031, led by Ayurvedic-inspired gels that blend turmeric and eucalyptus with modern permeation enhancers. Australia and South Korea are pioneering tele-rehab bundles that pair patches with remote physiotherapy, increasing adherence in rural areas.
Europe Topical Analgesic Market
Germany limits reimbursement for topical NSAIDs to systemic-failure cases, while the UK NHS delisted several branded gels in 2024, redirecting demand to OTC generics. France and Italy nurture a culture of compounding that offers bespoke formulations, yet regulatory oversight varies. Across regions, E-commerce is the equalizer, giving consumers in tier-two cities access to the same brands as capital markets, further integrating the global topical analgesic market.

Regulatory Landscape
Regulation for topical analgesics continues to tighten around quality, equivalence, and compliant commercialization across major markets. In the European Union, the EMA Guideline on Quality and Equivalence of Locally Applied, Locally Acting Cutaneous Products moved the region to an updated framework effective from April 2025, emphasizing stepwise evidence and greater reliance on in-vitro approaches such as IVRT and IVPT to support equivalence, which directly affects generic topical NSAIDs, anesthetic patches, and other locally acting analgesics.
In the United States, FDA oversight spans core drug requirements (including labeling and establishment registration) and ongoing enforcement against noncompliant topical pain products sold through multiple channels. In June 2026, a Federal Register update addressed requirements for submission of safety and effectiveness data for topical drug products, including procedures tied to time and extent applications under 21 CFR 330.14, adding procedural clarity for sponsors seeking to expand monograph coverage or support switches. Across regions, ICH Q13 remains a key reference point for continuous manufacturing expectations, influencing how large-volume topical and transdermal producers structure lifecycle controls and validation strategies.
Competitive Landscape
The topical analgesic market remains moderately fragmented. OTC price erosion from retailer private-label products forces incumbents to shift investment toward patent-protected smart patches that command premiums and deter generic entry. Haleon acquired an Indian patch plant in 2024 for USD 320 million, ensuring supply security and lowering the cost of goods. Grünenthal partners with academic labs to develop permeation-enhanced lidocaine patches targeting diabetic neuropathy, reinforcing its prescription niche.
Strategy bifurcates between scale-driven OTC portfolios and specialty platforms chasing high-margin, low-volume segments such as smart sports patches. Kenvue gained first-mover advantage in 2025 with an FDA-cleared Bengay patch that modulates menthol release based on skin temperature, blending legacy brand equity with digital medicine. Hisamitsu channels microneedle research into future launches while maintaining salonpas dominance in Asia. Retailers' store brands complicate shelf dynamics, but incumbents retain strengths in regulatory affairs, pharmacovigilance, and global QC networks that smaller challengers struggle to replicate.
Venture capital is pouring into digital-therapeutic hybrids that integrate sensors and analytics, though reimbursement ambiguity keeps most startups in pilot mode. OEM partnerships allow tech firms to piggy-back on pharma distribution, but intellectual property around drug-device combinations gives established players legal levers to defend territory.
Topical Analgesic Industry Leaders
Johnson & Johnson
Sun Pharmaceutical Industries Ltd
Haleon plc
Sanofi
Reckitt Benckiser Group plc
- *Disclaimer: Major Players sorted in no particular order
Topical Analgesic Market Companies Covered in this Report
- Amneal Pharmaceuticals
- Biofreeze
- Church & Dwight
- Endo International
- GlaxoSmithKline
- Grünenthal GmbH
- Haleon plc
- Haw Par Corporation Ltd.
- Hisamitsu Pharmaceutical
- Johnson & Johnson
- Kenvue Inc.
- Novartis
- Perrigo Company
- Performance Health Holding Inc.
- Reckitt Benckiser Group
- Rohto Pharmaceutical Co., Ltd.
- Sun Pharmaceuticals Industries
- Sanofi
- Teva Pharmaceutical Industries
- Viatris

Market Opportunities and Future Outlook
Whitespace is expanding at the intersection of differentiated delivery, channel reshaping, and brand adjacency into pain management. Patches and advanced topical systems are a clear innovation and commercialization lane, supported by market behavior that already favors convenience and adherence, with patches identified as the fastest-growing formulation in the category and online pharmacy momentum reinforced by subscription and bundled care models. Recent product activity also signals room for premiumization via multi-mechanism offerings: ThermaCare extended into Heat + Max Strength Lidocaine (4% lidocaine combined with heat therapy) in June 2026, and KT entered pain relief in July 2026 with 4% lidocaine and menthol-based topical formats, showing established consumer brands moving into topical analgesics with differentiated claims and formats.
Targeted M&A and licensing are creating additional routes to scale branded topical assets and strengthen portfolios in prescription-adjacent and switch-friendly products. In January 2026, Acertis Pharmaceuticals acquired US commercial rights to Licart (diclofenac epolamine topical system 1.3%) from IBSA, highlighting continued interest in established topical systems with defensible positioning. Clinical and institutional-use niches also offer room for tailored packaging and infection-control design, illustrated by Nuance Medicals June 2026 launch of HurriCaine ONE Lidocaine unit-dose topical anesthetic, aligning topical use with single-use workflows in healthcare settings.
Recent Industry Developments in Topical Analgesic Market
- June 2026: Sun Pharmaceutical Industries Ltd. signed an agreement to acquire 100% of Innovcare Lifesciences for about USD 28.7 million, with completion targeted by July 31, 2026. The transaction broadens Sun's platform in branded and specialty medicines across additional geographies, strengthening commercial reach that can support topical and pain-related portfolio execution.
- September 2025: Kenvue launched the Tylenol Precise Pain Relieving Patch, a transparent and flexible 4% lidocaine topical patch positioned for targeted relief. The launch reinforces the markets shift toward premium patch formats and intensifies competition for shelf space and online search visibility in non-opioid topical pain management.
- April 2024: Haleon acquired an Indian patch manufacturing plant for USD 320 million to secure supply and lower cost of goods for transdermal formats. This vertical integration move supports scale-up of patch-led analgesic strategies and increases competitive pressure on brands reliant on third-party manufacturing.


Topical Analgesic Market Report Scope and Research Methodology
Market Definition and Coverage
For this methodology, the topical analgesic market covers pain-relief medicines that are applied on the skin to reduce localized pain, such as creams, gels, sprays, sticks, and patches sold through prescription and OTC routes.
Scope exclusions: We exclude oral analgesics, injectable pain medicines, and device-only pain relief products that do not involve a topical drug formulation.
Segments Covered in This Report
- By Therapeutic Class
- Non-Opioids
- NSAIDs
- Local Anesthetics
- Capsaicinoids
- Counterirritants
- Salicylates
- Opioids
- Buprenorphine Patch
- Fentanyl Patch
- Tramadol Topical/Formulations
- Morphine Gel/Compound
- Dihydrocodeine Topical Preparations
- Non-Opioids
- By Formulation
- Cream & Gel
- Patch
- Spray / Aerosol
- Roll-on & Stick
- Others (Foam, Ointment)
- By Type
- Prescription
- OTC
- By Distribution Channel
- Hospital Pharmacies
- Retail Pharmacies & Drug Stores
- Online Pharmacies
- Other End Users
- By Geography
- North America
- United States
- Canada
- Mexico
- Europe
- Germany
- United Kingdom
- France
- Italy
- Spain
- Rest of Europe
- Asia-Pacific
- China
- Japan
- India
- Australia
- South Korea
- Rest of Asia-Pacific
- Middle East & Africa
- GCC
- South Africa
- Rest of Middle East & Africa
- South America
- Brazil
- Argentina
- Rest of South America
- North America
Data Sources, Market Sizing, and Validation
Desk Research
Desk research was used to build the base structure of the market and to anchor it to observable healthcare and consumer health indicators. We referred to public sources such as the US FDA drug databases and safety communications, CDC health statistics for pain and musculoskeletal conditions, and NIH or PubMed literature for topical actives and usage patterns.
To keep the regional model grounded, we also reviewed trade and macro signals using sources such as UN Comtrade for relevant pharmaceutical trade flows, World Bank and OECD health spending indicators, and government tariff and customs portals where available. Company annual reports, investor presentations, and reputable press were used to map portfolios and route-to-market shifts, and a paid subscription for company financials and patent databases was used selectively to validate product activity and innovation intensity. This list is illustrative, and many other public sources were also checked for data collection, validation, and clarification.
Primary Interviews and Surveys
Primary work focused on cross-checking demand signals and pricing logic across OTC and prescription topical analgesics. We spoke with manufacturers, distributors, pharmacy channel participants, and healthcare-facing respondents across APAC, EMEA, and the Americas to confirm assumptions around channel mix, average selling prices, and adoption trends, then adjusted the model inputs where needed.
Distribution of primary research fieldwork respondents
| Company type | Respondent position | Region |
|---|---|---|
| Top tier: 32% | CXOs: 12% | APAC: 40% |
| Mid tier: 50% | Functional/Unit leaders: 38% | EMEA: 34% |
| Smaller Players: 18% | Managers: 50% | Americas: 26% |
Market-Sizing & Forecasting
Sizing starts with a top-down build where healthcare spending patterns and self-care demand indicators are translated into an addressable pool for topical pain relief, and then filtered by penetration of topical formats across key pain conditions. Once the demand pool is set, it is allocated across regions and channels using observed pharmacy access, OTC share, and reimbursement and prescribing tendencies.
To keep totals realistic, we corroborated them with selective bottom-up checks, such as sampled price points for common formats, unit-volume proxies from channel discussions, and supplier and portfolio rollups for key geographies where information was clearer. Key inputs in this market include the mix of OTC versus prescription sales, the share of patches versus creams and gels, average pack sizes and price ladders, online pharmacy contribution, and the prevalence trend for chronic joint and muscle pain in aging populations.
Forecasts are built using scenario analysis supported by simple time-series smoothing on mature regions, and then adjusted with expert views on pricing progression and channel shifts. Where bottom-up evidence is thinner for smaller countries, we use regional analogs and per-capita normalization before final totals are locked.
Data Validation & Update Cycle
Model outputs are cross-checked against independent signals such as public health spending direction, reported product availability changes, and channel-level growth narratives captured in interviews. If a country or segment shows an unusual jump in volume or pricing, the assumptions are revisited, and respondents are re-contacted to confirm whether it is a real shift or a modeling artifact.
Before sign-off, the work is reviewed in multiple steps, starting with logic checks inside the model, followed by peer review for scope alignment and unit consistency, and then final analyst review for reasonableness at the region and global levels. Reports are refreshed annually, and interim updates are made when material events occur, with a final pre-delivery pass so clients receive the latest updated view.
Mordor Intelligence's Topical Analgesic Market Size Compared Against Other Published Estimates
Published market sizes for topical analgesics can differ even when the topic sounds identical, because the cut of the market and the way prices and volumes are combined are not always the same. Differences usually show up around what is counted as a topical analgesic, how OTC and prescription channels are treated, and how the base year is chosen.
Evidence from channel mix checks and observed format splits (patches versus creams and gels), followed by price-point validation across regions, is what ties Mordor Intelligence to a defined demand pool that aligns with topical pain-relief drugs only, rather than broader pain management adjacencies. Other estimates can move up or down when they widen scope to include adjacent topical pain categories, apply different currency timing, or use more aggressive assumptions on price growth and online pharmacy expansion.
Benchmark comparison
| Source | Market Size | Gaps in Research Methodology |
|---|---|---|
| Mordor Intelligence | USD 12.39 B (2026) | |
| Global Consultancy A | USD 12.89 B (2026) | Uses a broader definition with many additional splits (such as pain type, age group, and composition) that can lead to double counting when totals are aggregated back to one number, and the pricing pathway is less clearly tied to channel-level checks. |
| Industry Research Group B | USD 11.21 B (2025) | Anchors the market to a different base year and may apply a narrower country coverage and a more conservative demand pool for topical formats, which can compress the starting value even if the longer-term growth rate looks similar. |
The spread in the table mainly comes from scope boundary choices, base-year selection, and how price and volume are validated across formats and channels. By keeping the steps traceable to a small set of observable signals and then re-checking the sensitive assumptions through interviews, the final number stays practical to replicate and easier to defend in planning discussions.


Key Questions Answered in the Report
What CAGR is forecast for the topical analgesic market through 2031?
The topical analgesic market is projected to expand at a 5.04% CAGR between 2026-2031, rising from USD 12.39 billion in 2026 to USD 15.84 billion by 2031.
Which formulation will grow fastest over the next five years?
Transdermal patches are expected to post the highest 9.03% CAGR as continuous-release polymers and sensor integration improve adherence and clinical outcomes.
Why are opioid patches gaining traction despite opioid-reduction goals?
Abuse-deterrent buprenorphine and fentanyl patches localize delivery, lower diversion risk, and are favored in oncology and hospice care where oral opioids cause intolerable side effects.
How is e-commerce affecting sales channels?
Online pharmacies are forecast to grow at 8.41% CAGR by bundling auto-replenishment and telehealth services, expanding their share of total topical sales from 13% in 2025 to a projected 25% by 2031.
Which region will record the fastest growth?
Asia-Pacific is set to lead with a 6.07% CAGR, driven by aging demographics in Japan and South Korea and expanding middle-class purchasing power in China and India.
Page last updated on:





