Morphine Market Size and Share
Market Overview
| Study Period | 2020 - 2031 |
|---|---|
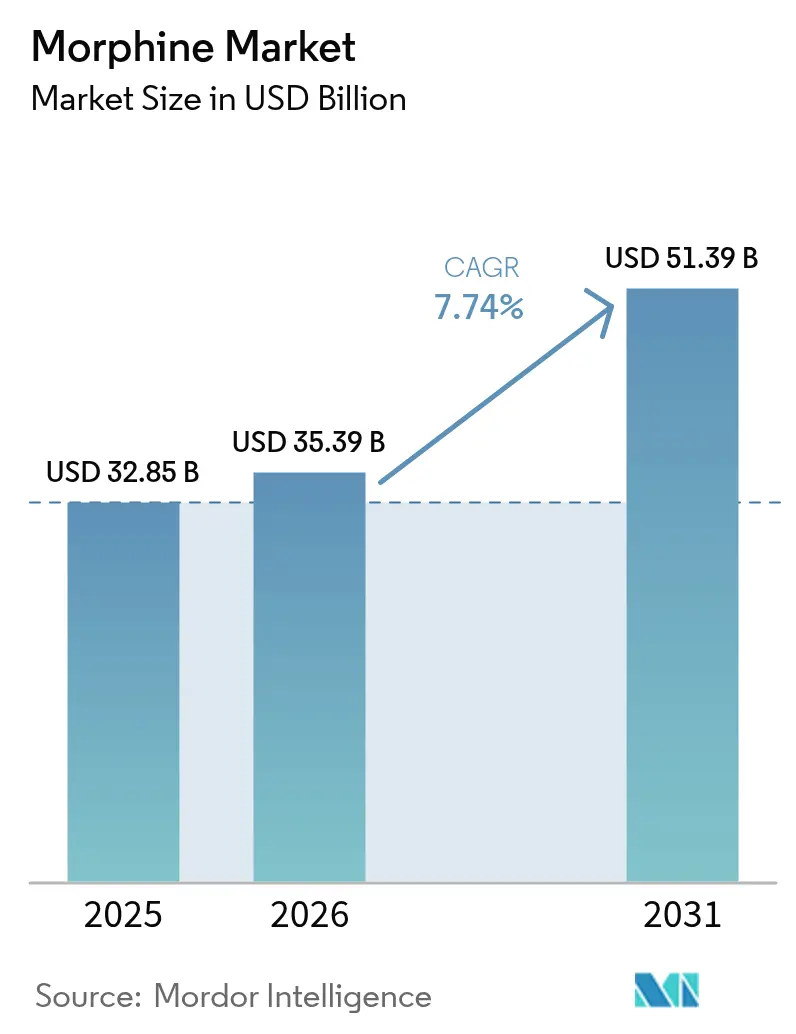
| Market Size (2026) | USD 35.39 Billion |
| Market Size (2031) | USD 51.39 Billion |
| Growth Rate (2026 - 2031) | 7.74% CAGR |
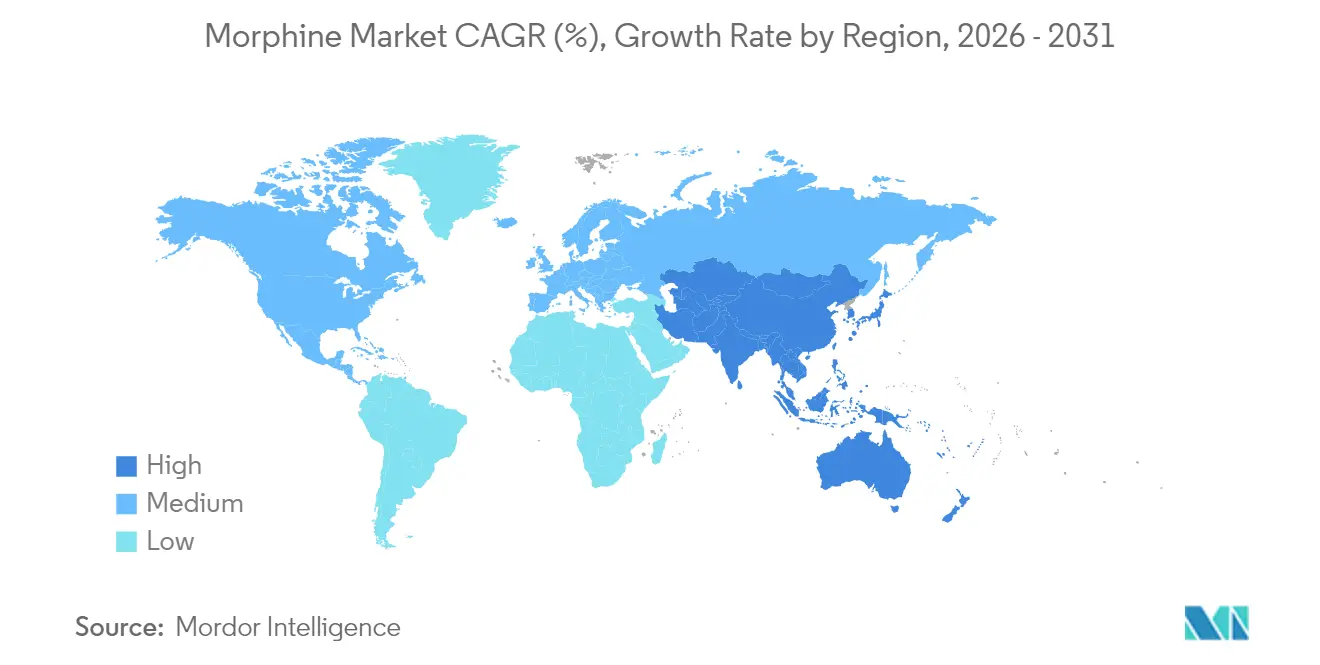
| Fastest Growing Market | Asia-Pacific |
| Largest Market | North America |
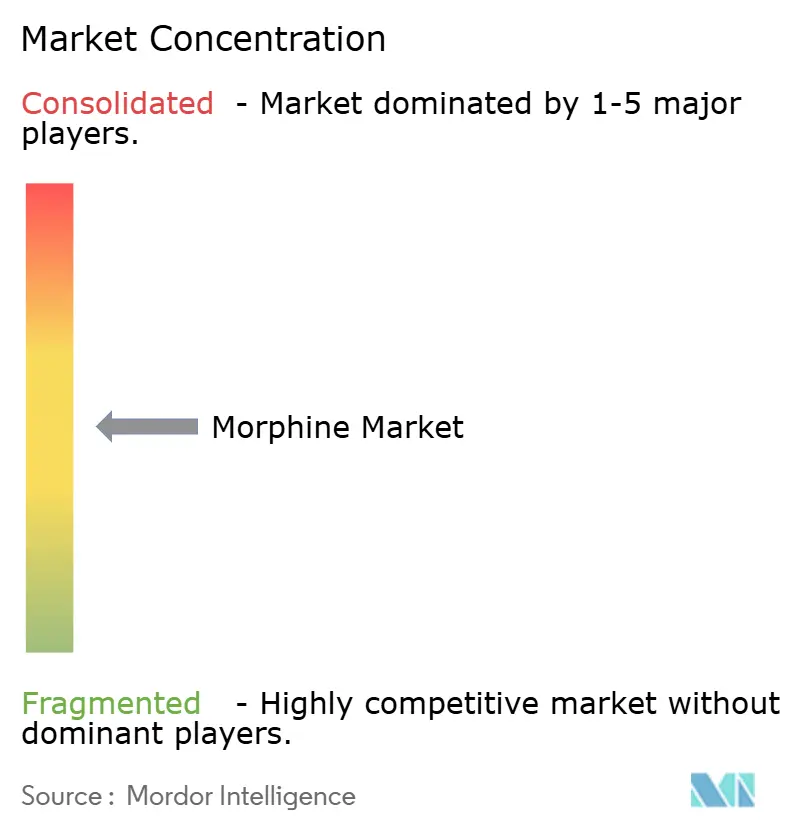
| Market Concentration | Medium |
Major Players *Disclaimer: Major Players sorted in no particular order Image © Mordor Intelligence. Reuse requires attribution under CC BY 4.0. | |
Morphine Market Analysis by Mordor Intelligence
The Morphine Market size was valued at USD 32.85 billion in 2025 and estimated to grow from USD 35.39 billion in 2026 to reach USD 51.39 billion by 2031, at a CAGR of 7.74% during the forecast period (2026-2031). This expansion rests on an aging population that requires more surgical and palliative procedures, the emergence of abuse-deterrent formulations that reassure regulators, and the rapid digitalization of hospital drug-delivery systems. Supply constraints triggered by Afghanistan’s poppy restrictions have elevated raw-material costs but also curbed illicit competition, strengthening manufacturer pricing power. Meanwhile, specialty-generic leaders pursue mergers to gain scale and compliance expertise; the Mallinckrodt–Endo tie-up underscores this consolidation push. Digitally enabled patient-controlled analgesia pumps are reducing adverse drug reactions by 79.2%, making smart infusion technology a pivotal selection factor for hospitals. Despite tougher oversight, robust demand from hip and knee replacements and broad hospice expansion continues to propel the morphine market trajectory.
Key Report Takeaways
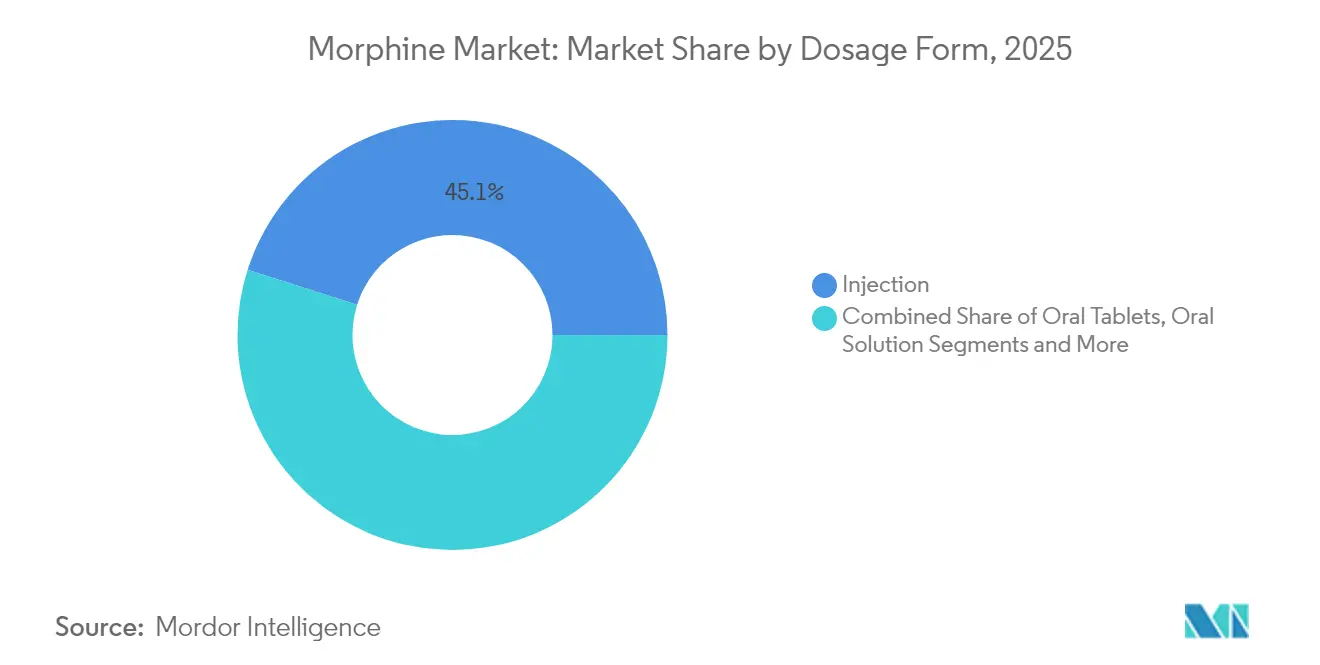
- By dosage form, injectable products captured 45.10% of morphine market share in 2025; oral solutions are projected to expand at an 8.14% CAGR to 2031.
- By release type, immediate-release drugs led with 60.05% revenue share in 2025, while extended-release formulations are forecast to rise at 9.22% CAGR through 2031.
- By route of administration, intravenous delivery accounted for 57.40% of the morphine market size in 2025; intrathecal delivery is set to grow at 12.98% CAGR between 2026-2031.
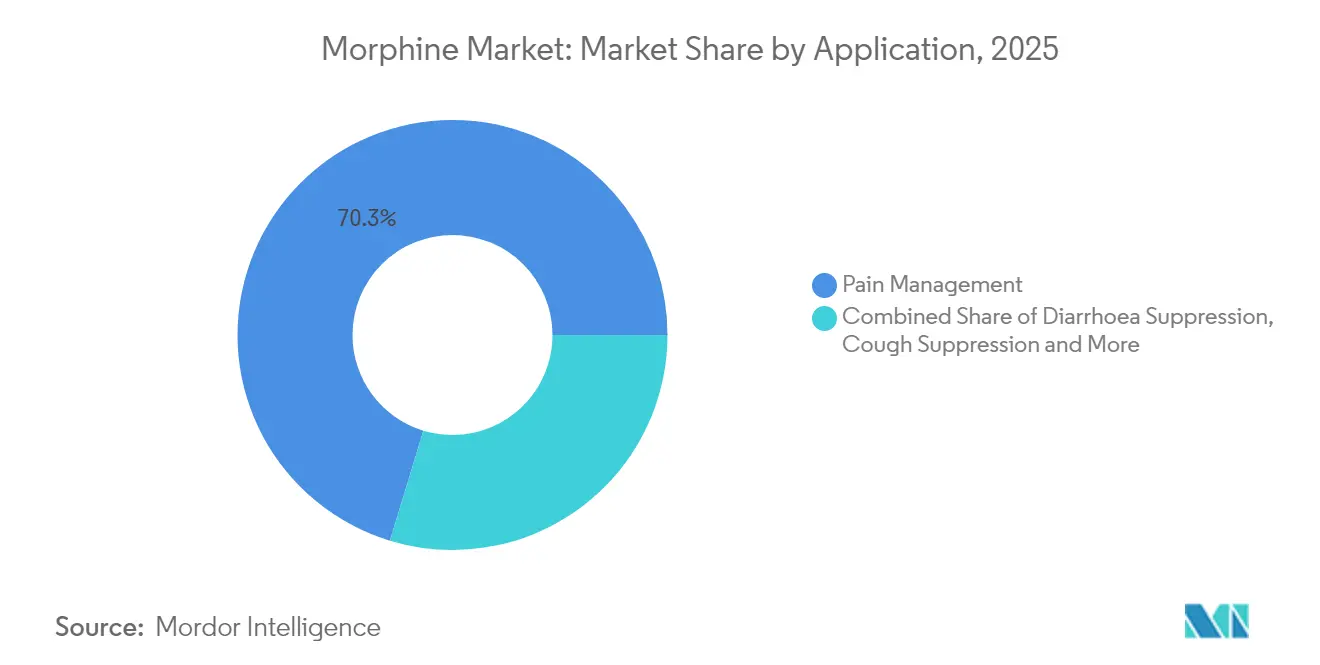
- By application, pain management dominated with 70.30% revenue share in 2025; cough suppression is advancing at an 8.49% CAGR through 2031.
- By end-user, hospitals held 38.35% share of the morphine market size in 2025, whereas online pharmacies are on track for an 8.01% CAGR to 2031.
- By geography, North America led with a 34.45% share of the morphine market in 2025, although Asia-Pacific is pacing at a 9.48% CAGR toward 2031.
Note: Market size and forecast figures in this report are generated using Mordor Intelligence’s proprietary estimation framework, updated with the latest available data and insights as of 2026.
Global Morphine Market Trends and Insights
Drivers Impact Analysis*
| Driver | (~) % Impact on CAGR Forecast | Geographic Relevance | Impact Timeline |
|---|---|---|---|
| Launch Of Abuse-Deterrent Extended-Release (ER) Formulations | +1.5% | North America & Europe, regulatory spillover to APAC | Short term (≤ 2 years) |
| Escalating Global Hip & Knee Replacement Procedures | +1.2% | North America & Europe, expanding to APAC | Medium term (2-4 years) |
| Digitally-Enabled PCA Pumps Driving Injectable Demand In Hospitals | +0.9% | Global, led by developed markets | Medium term (2-4 years) |
| Rapid Expansion Of Hospice & Palliative-Care Beds In Various Regions Globally | +0.8% | Global, with highest growth in APAC and MEA | Long term (≥ 4 years) |
| Emerging Micro-Spherical Depot R&D To Prolong Analgesia | +0.6% | North America & Europe, early adoption phase | Long term (≥ 4 years) |
| Source: Mordor Intelligence | |||
Launch Of Abuse-Deterrent Extended-Release (ER) Formulations
FDA approval of RoxyBond’s updated REMS in November 2024 set a safety benchmark that now covers all ER opioids, morphine included[1]U.S. Food and Drug Administration, “Approval Letter 209777Orig1s010,” accessdata.fda.gov. SentryBond technology, validated across 2,000 tamper-tests, curtails intranasal and intravenous misuse, giving manufacturers a competitive edge. Hospitals and insurers accept premium prices because liability risk falls when prescribers choose abuse-deterrent products. Early uptake improves revenue per dose and raises barriers for low-tech rivals. As regulatory authorities in Asia-Pacific adopt similar labeling rules, global diffusion accelerates near-term sales momentum.
Rapid Expansion Of Hospice & Palliative-Care Beds In Various Regions Globally
CMS lifted hospice payments 2.6% for FY 2025, injecting USD 705 million into end-of-life care budgets[2]Centers for Medicare & Medicaid Services, “FY 2025 Hospice Wage Index and Payment Rate Update,” federalregister.gov. Uzbekistan opened its first children’s hospice, signaling demand in lower-income settings. A Chinese survey scored home hospice care needs at 115.70 points, underscoring unmet demand in the world’s second-largest economy. The WHO’s May 2025 guideline urging wider controlled-medicine access may prompt regulatory reform that smooths supply chains. These structural shifts broaden the morphine market as palliative beds multiply and prescribers standardize opioid protocols.
Digitally-Enabled PCA Pumps Driving Injectable Demand In Hospitals
Smart infusion pumps introduced to 1,327 beds achieved 100% drug-library compliance and cut dosing alerts to 0.79%, cementing the devices as a patient-safety necessity. Wi-Fi oral PCA units trim nurse administration time by 84%, turning capital outlays into rapid labor savings. Cloud-linked pumps sustain ±6.47% infusion accuracy and enable real-time audits that hospitals use during procurement. Because morphine dominates acute pain regimens, every new smart pump effectively lifts injectable volumes. Vendors that bundle morphine with interoperable devices enjoy stickier contracts and better formulary access.
Escalating Global Hip & Knee Replacement Procedures
WHO Resolution WHA77.4 pushes health systems to expand surgical capacity, indirectly lifting perioperative morphine needs. Ontario Health’s 2024/25 plan to shorten wait times shows how regional policy converts into procedure growth. Patient-controlled analgesia in emergency departments increased satisfaction without raising adverse events, reinforcing morphine’s role in postoperative care. As minimally invasive techniques cut hospital stays, clinicians still rely on morphine for breakthrough pain, so rising surgery counts keep the morphine market on an upward track.
Restraints Impact Analysis*
| Restraint | (~) % Impact on CAGR Forecast | Geographic Relevance | Impact Timeline |
|---|---|---|---|
| Prescription Opioid Diversion & Black-Market Resale | -1.8% | Global, most severe in North America | Short term (≤ 2 years) |
| National-Level REMS and Tighter FDA and EMA Labeling Requirements | -1.1% | North America & Europe, regulatory spillover globally | Medium term (2-4 years) |
| Supply Bottlenecks In Poppy Raw-Material (Papaver Somniferum) Cultivation | -0.7% | Global supply chain, price volatility in all regions | Long term (≥ 4 years) |
| Source: Mordor Intelligence | |||
Prescription Opioid Diversion & Black-Market Resale
DEA seized 2.7 million fentanyl pills in New Mexico in April 2025, reflecting the scale of illicit trades that suppress legitimate prescriptions[3]DEA Headquarters, “DEA Seizes Record-Setting Number of Fentanyl Pills,” dea.gov. Prosecutions of clinicians for theft raise professional liability fears and reduce prescribing enthusiasm. The DOJ links more than 110,000 overdose deaths to opioids, prompting quota tightening and reporting burdens that delay distribution. Higher compliance cost slows shipments, shaving near-term growth from the morphine market.
Supply Bottlenecks In Poppy Raw-Material Cultivation
Taliban enforcement shrank Afghan poppy fields 67% from 2023 to 2024 and drove opium to USD 750 per kilogram, up tenfold from 2022. Badakhshan now contributes over half of remaining output, concentrating risk in a remote area with poor logistics. Six-point-nine million Afghans depend on opium for income, so ban durability is uncertain, placing inventory planning in flux. Lacking alternative farms of similar scale, pharmaceutical buyers face persistent cost inflation, trimming long-term margins across the morphine market.
*Our forecasts treat driver/restraint impacts as directional, not additive. The impact forecasts reflect baseline growth, mix effects, and variable interactions.
Segment Analysis
By Dosage Form: Injectable Dominance Drives Hospital Adoption
Injectable products commanded 45.10% of morphine market share in 2025 on the strength of rapid onset and fine-tuned dose control essential in operating rooms and emergency wards. Smart infusion-pump interoperability trimmed medication-error rates by 15.4% to 90.5%, adding clinical justification for high-value injectable contracts. Oral solutions, supported by hospice expansion, are projected to post an 8.14% CAGR through 2031, closing part of the accessibility gap in palliative settings.
Rising shortages of injectable opioids compel hospital pharmacists to shift some patients to oral formats, indirectly accelerating oral adoption. Nonetheless, sustained surgical growth keeps the injectables line firmly ahead in absolute dollars, ensuring the morphine market retains a balanced product mix.


By Release Type: Extended-Release Innovation Accelerates Growth
Immediate-release formulations held 60.05% share in 2025 due to deep prescriber familiarity and insurance ease. Yet extended-release drugs, fortified with abuse-deterrent layers, are set for 9.22% CAGR, the highest among release categories. The morphine market size for extended-release products is projected to climb markedly as health insurers view lower diversion risk as cost-saving over the therapy cycle.
FDA-monitored REMS intensify training and record-keeping. Manufacturers willing to invest in nano-carrier or microsphere technologies can price at a premium while aligning with REMS goals. Flexible licensing paths encourage regional players to partner with global innovators, enriching the formulation pipeline across the morphine market.
By Route of Administration: Intrathecal Growth Reflects Specialized Applications
Intravenous modalities generated the bulk of hospital revenue, representing 57.40% of the morphine market size in 2025. Nevertheless, intrathecal systems will outpace all others at a 12.98% CAGR, propelled by chronic cancer pain cases where systemic dosing fails. Depot-based naloxone prodrugs under preclinical review offer future overdose safeguards that may encourage wider intrathecal adoption.
Epidural and subcutaneous routes keep niche positions in obstetrics and ambulatory care. Innovations that synchronize pump settings with electronic health-record alerts promise to lift dosing precision, reinforcing morphine’s role in multiple clinical pathways.
By Application: Pain Management Leadership Faces Therapeutic Diversification
Pain management generated 70.30% of 2025 revenues, keeping morphine the analgesic backbone for oncology, neuropathic, and osteoarthritis protocols. However, cough suppression is pacing at 8.49% CAGR, driven by respiratory-care integration where codeine alternatives fall short. Emerging formulations with lower histamine release aim to reduce antitussive side-effects.
Regulatory complexity hinders cancer-pain coverage in developing markets; a survey showed half the global population lives where opioid rules limit access. Side-effect management also shapes utilization: 30% of Japanese weak-opioid users experienced constipation in week one, prompting adjunct laxative development that loops back to morphine adherence. As clinical guidelines evolve, the morphine market diversifies without eroding its pain leadership.
By End-User: Online Pharmacies Drive Digital Transformation
Hospitals accounted for 38.35% of morphine market share in 2025, but online pharmacies hold the fastest lane with an 8.01% CAGR. Telehealth growth and prescription-upload functions make virtual channels appealing, particularly for chronic patients who require refill convenience. Yet controlled-substance logistics remain stringent; Walgreens booked USD 6.6 billion for opioid-related liabilities, underscoring compliance risk.
Wholesale giants like McKesson operate 27 DEA-regulated hubs and invest in blockchain pilot programs for track-and-trace. Their scale assures steady hospital supply while enabling e-pharmacy fulfillment partnerships.
Geography Analysis
North America anchored 34.45% of the morphine market in 2025 due to robust insurance coverage, advanced surgical volume, and stringent yet transparent FDA and DEA oversight. Abuse-deterrent uptake is highest here, aligning public-health mandates with manufacturer innovation. Digital PCA pumps see early adoption, further consolidating morphine’s clinical foothold.
Europe maintains a balanced regulatory climate under EMA coordination. Cross-country reimbursement frameworks vary, yet broad palliative-care availability safeguards baseline demand. Manufacturers leverage intra-EU supply channels to offset Afghan raw-material volatility, tempering cost spikes that ripple through the morphine market.
Asia-Pacific registers the swiftest rise at 9.48% CAGR, benefiting from large-scale hospital construction, aging demographics, and policy moves to loosen opioid access barriers. Malaysia recorded a 993.18% jump in overall opioid consumption, though fentanyl dominates; in Thailand and Vietnam, morphine remains the staple analgesic. WHO guidelines should accelerate approvals and procurement funding, expanding the morphine market size across lower-income segments.

Competitive Landscape
Industry consolidation accelerates as compliance hurdles rise. The 2025 Mallinckrodt–Endo merger formed a USD 3.6 billion revenue platform with expanded controlled-substances franchises. Mallinckrodt’s specialty generics division grew 23% in 2024, aided by resilient morphine volumes despite raw-material cost inflation.
Differentiation centers on formulation technology. Ensysce Biosciences advances PF614 with Trypsin-Activated Abuse Protection, targeting oral overdose reduction along with sustained efficacy. Meanwhile, generic players in India and Turkey face capital challenges to retrofit plants for REMS-grade output, keeping entry barriers high and helping incumbents preserve pricing.
Supply-chain resilience now defines competitiveness. Firms with diversified poppy sources in Australia, France, and Spain mitigate Afghan shocks, while those lacking alternative farms accept slimmer margins. Digital traceability and cold-chain analytics rise as procurement criteria, pushing manufacturers to intertwine IT and quality-assurance roadmaps.
Morphine Industry Leaders
Pfizer Inc.
Verve Health Care Ltd.
AbbVie Inc.
Mallinckrodt Pharmaceuticals
Sun Pharma Industries Ltd
- *Disclaimer: Major Players sorted in no particular order

Recent Industry Developments
- September 2024: Pharmascience Canada launched pms-MORPHINE SULFATE 5 mg and 10 mg tablets for chronic severe pain in adults.
- April 2024: Japan’s Ministry of Health issued updated medical narcotic guidance built on WHO recommendations to foster appropriate morphine use in cancer care.


Research Methodology Framework and Report Scope
Market Definitions and Key Coverage
Our study defines the morphine market as the global annual sales value of pharmaceutical-grade morphine, across all strengths, release profiles, and dosage forms, dispensed for analgesia, anesthesia adjunct, cough suppression, or diarrhea control through hospital, retail, and online channels. The value counts both branded and unbranded finished doses reaching end users within a calendar year.
Scope Exclusions: Raw poppy alkaloid trading, heroin, veterinary morphine, and standalone API toll manufacturing are excluded.
Segmentation Overview
- By Dosage Form
- Injection
- Oral Tablets / Capsules
- Oral Solution / Drops
- Suppositories
- By Release Type
- Immediate-Release (IR)
- Extended-Release (ER) / Controlled-Release
- By Route of Administration
- Intravenous
- Intramuscular / Sub-cutaneous
- Epidural
- Intrathecal
- By Application
- Pain Management
- Cancer Pain
- Neuropathic Pain
- Osteoarthritis & Musculoskeletal Pain
- Other Pain Segments
- Diarrhoea Suppression
- Cough Suppression
- Adjunct to Anaesthesia
- Pain Management
- By End-User
- Hospitals
- Retail Pharmacies
- Home-Care / Hospice Centres
- Online Pharmacies
- Geography
- North America
- United States
- Canada
- Mexico
- Europe
- Germany
- United Kingdom
- France
- Italy
- Spain
- Rest of Europe
- Asia-Pacific
- China
- Japan
- India
- South Korea
- Australia
- Rest of Asia-Pacific
- Middle East and Africa
- GCC
- South Africa
- Rest of Middle East and Africa
- South America
- Brazil
- Argentina
- Rest of South America
- North America
Detailed Research Methodology and Data Validation
Primary Research
Mordor analysts interviewed anesthesiologists, oncology pharmacists, hospice nurses, regulators, and wholesalers across North America, Europe, Asia-Pacific, and Latin America. The calls refined utilization patterns, average selling prices, diversion losses, and likely impacts of upcoming REMS updates that rarely surface in documents.
Desk Research
We began with authoritative public datasets from the World Health Organization, United Nations Office on Drugs and Crime, US FDA, Eurostat, and national narcotics boards that outline production quotas, adverse events, and prescription rules. Industry color was layered in through company 10-Ks, hospital tender portals, peer-reviewed journals on postoperative pain, and proprietary feeds from D&B Hoovers and Dow Jones Factiva, which revealed price spreads and channel mix shifts. These examples illustrate our desk inputs; analysts tapped many additional resources while building the evidence base.
Market-Sizing & Forecasting
A top-down model transforms country-level controlled-substance quotas and hospital discharge counts into an annual milligram demand pool, which is reconciled with sampled ex-factory prices gathered through supplier roll-ups to yield revenue. Key drivers, cancer incidence, hip and knee replacement volumes, geriatric share of population, prescription-monitoring adoption, and average length of stay, feed a multivariate regression that forecasts demand to 2030. Limited bottom-up checks on selected manufacturers' shipment files and channel audits close remaining gaps before final alignment.
Data Validation & Update Cycle
Outputs pass variance checks against import logs and prescription audits; material deviations trigger re-contact with respondents and senior review. Reports refresh each year, with interim updates when quota cuts, major recalls, or pricing shocks occur.
Why Our Morphine Baseline Stands Up to Scrutiny
Published estimates often diverge because firms pick different dosage forms, channels, price years, and refresh rhythms. Mordor anchors its 2025 value on controlled-substance quotas and validated ASPs, thereby reducing hidden exclusions that suppress many competitor totals.
Key gap drivers include omission of institution-only injectables, linear growth extrapolation from older bases, retail-only point-of-sale tracking, and uniform global ASP assumptions.
Benchmark comparison
| Market Size | Anonymized source | Primary gap driver |
|---|---|---|
| USD 32.85 bn (2025) | Mordor Intelligence | - |
| USD 23.86 bn (2023) | Global Consultancy A | Extended-release forms excluded, 2023 to 2025 growth linearly stretched |
| USD 22.46 bn (2023) | Trade Journal B | Relies on retail pharmacy data, omits hospital bulk tenders |
| USD 20.88 bn (2025) | Industry Association C | Uses single world ASP, ignores regional cost variation |
Taken together, the comparison shows that when scope, pricing, and refresh cadence are harmonized, Mordor's disciplined framework delivers a balanced, transparent baseline that decision-makers can trace back to clear variables and repeatable steps.


Key Questions Answered in the Report
What is the current value of the morphine market?
The morphine market stands at USD 35.39 billion in 2026 and is forecast to climb to USD 51.39 billion by 2031.
Which dosage form dominates global sales?
Injectable formulations lead with 45.10% of morphine market share in 2025 due to hospital demand for rapid and precise analgesia.
Why are extended-release formulations growing faster than immediate-release?
Abuse-deterrent technologies, coupled with new REMS frameworks, make extended-release morphine safer and more attractive, driving a 9.22% CAGR through 2031.
Which region shows the fastest market growth?
Asia-Pacific posts the highest regional CAGR at 9.48%, supported by healthcare infrastructure investment and regulatory modernization.
How are smart infusion pumps influencing morphine usage?
Smart PCA systems cut severe adverse drug reactions by 79.2% and reduce nurse administration time, encouraging hospitals to favor injectable morphine supplied with interoperable devices.
What risks threaten sustained market expansion?
Rising diversion of prescription opioids and supply shocks from poppy cultivation bans create regulatory and cost headwinds that may temper growth rates over the next two years.
Page last updated on:


