OSS BSS Market Size and Share
Market Overview
| Study Period | 2020 - 2031 |
|---|---|
| Market Size (2026) | USD 28.14 Billion |
| Market Size (2031) | USD 54.06 Billion |
| Growth Rate (2026 - 2031) | 13.95% CAGR |
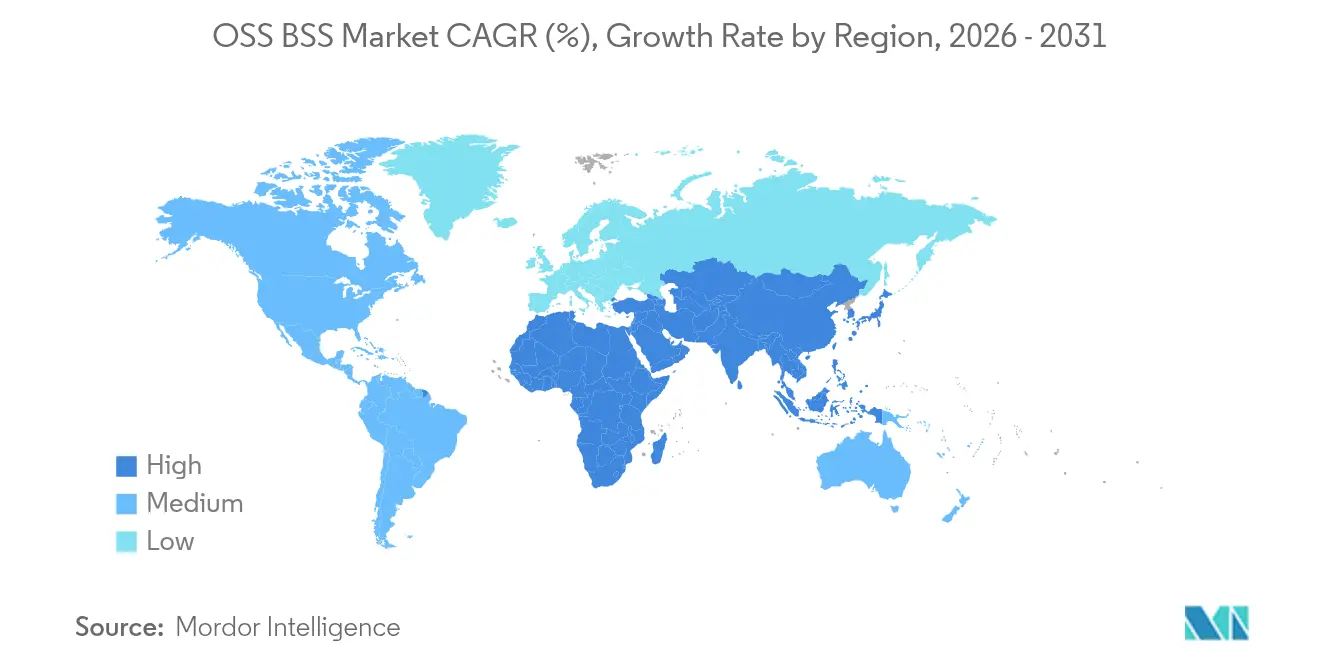
| Fastest Growing Market | Asia Pacific |
| Largest Market | North America |
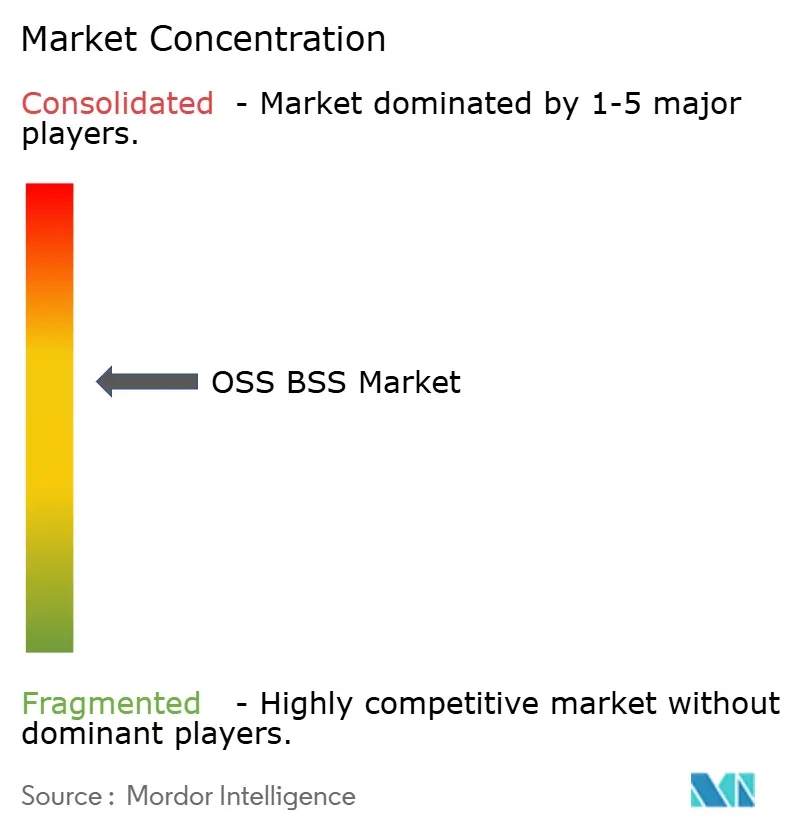
| Market Concentration | Medium |
Major Players *Disclaimer: Major Players sorted in no particular order Image © Mordor Intelligence. Reuse requires attribution under CC BY 4.0. | |
OSS BSS Market Analysis by Mordor Intelligence
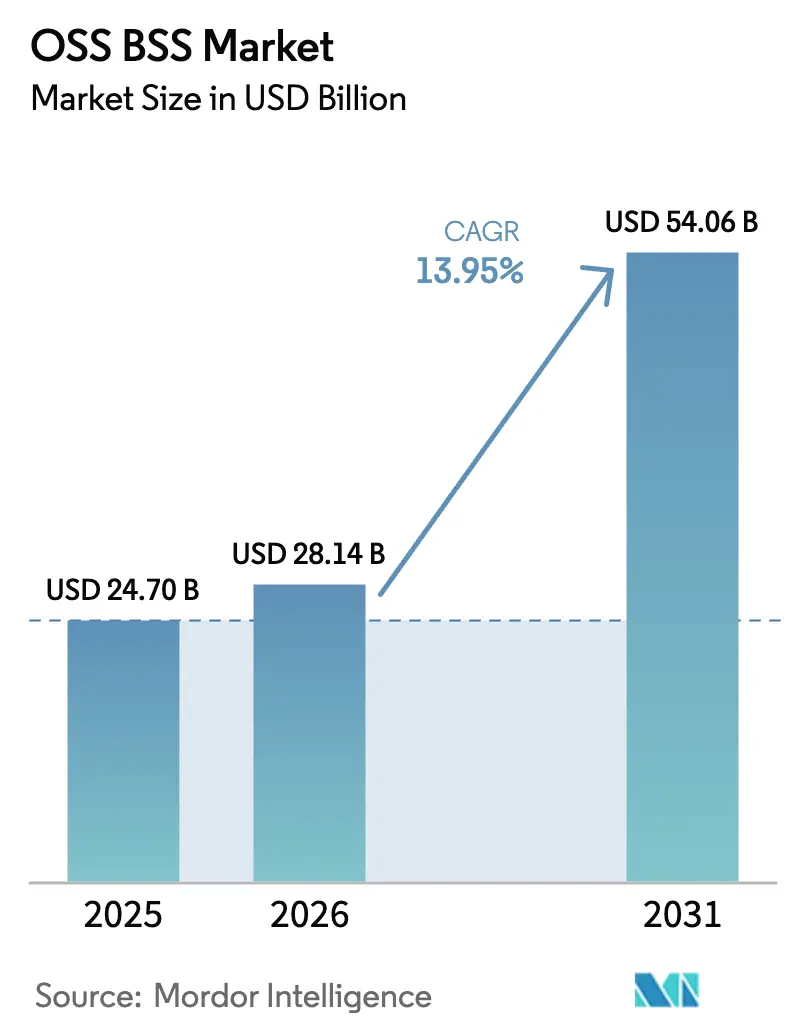
The OSS BSS market size was valued at USD 24.70 billion in 2025 and estimated to grow from USD 28.14 billion in 2026 to reach USD 54.06 billion by 2031, at a CAGR of 13.95% during the forecast period (2026-2031). Robust growth reflects how essential these platforms are for service provisioning, billing, and network management in 5G and IoT environments. Cloud-native architectures are replacing monolithic stacks, cutting time-to-market and lowering capital outlays. Convergent charging and real-time analytics are turning customer data into revenue opportunities, while network-slice monetization frameworks are opening fresh business models. Competitive pressure from digital-native entrants is pushing operators toward open APIs and AI-enabled automation, and ongoing consolidation among leading vendors is reshaping pricing power and innovation cycles within the OSS BSS market.
Key Report Takeaways
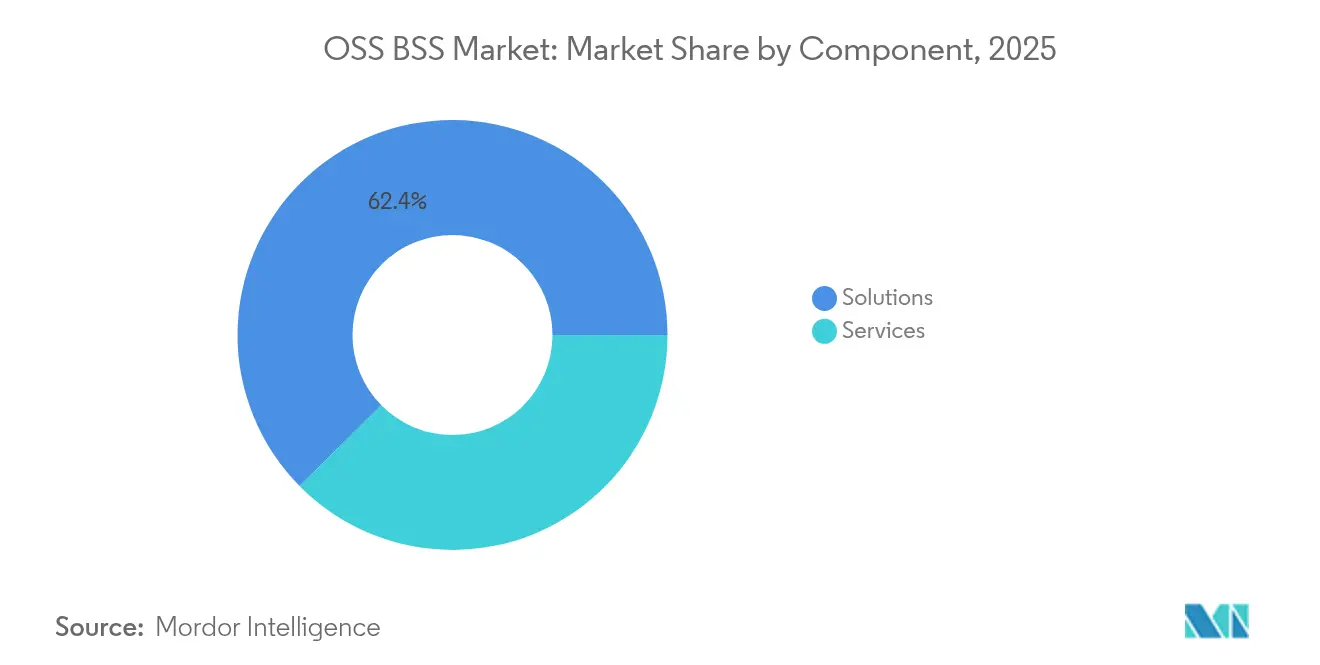
- By component, Solutions led with 62.40% of OSS BSS market share in 2025; Services are projected to post a 14.85% CAGR through 2031.
- By deployment mode, on-premise captured 57.65% of the OSS BSS market size in 2025, whereas cloud deployments are projected to expand at an 17.55% CAGR.
- By enterprise size, large enterprises accounted for 70.55% of revenue in 2025, while SMEs are set to grow at a 16.25% CAGR.
- By industry vertical, IT and Telecom held 45.90% revenue share in 2025; retail and e-commerce are expected to advance at a 22.65% CAGR to 2031.
- By geography, North America commanded 34.45% share of the OSS BSS market in 2025, and Asia-Pacific is forecast to log a 19.10% CAGR over the same period.
Note: Market size and forecast figures in this report are generated using Mordor Intelligence’s proprietary estimation framework, updated with the latest available data and insights as of 2026.
Global OSS BSS Market Trends and Insights
Driver Impact Analyis*
| Driver | (~) % Impact on CAGR Forecast | Geographic Relevance | Impact Timeline |
|---|---|---|---|
| Growing adoption of cloud-native OSS/BSS platforms | +3.6% | Global, with early adoption in North America and Europe | Medium term (2-4 years) |
| Rapid 5G rollout driving network-slicing monetization | +2.8% | North America, Europe, Advanced Asia-Pacific markets | Medium term (2-4 years) |
| Rising demand for convergent billing and IoT monetization | +2.4% | Global, with concentration in developed markets | Medium term (2-4 years) |
| Customer-experience analytics investments by CSPs | +2.1% | Global, with higher impact in competitive markets | Short term (≤ 2 years) |
| AI-driven autonomous network operations | +1.7% | North America, Europe, Advanced Asia-Pacific markets | Long term (≥ 4 years) |
| Telco-to-TechCo transformation budgets for unified stacks | +1.4% | Global, with early adoption in developed markets | Long term (≥ 4 years) |
| Source: Mordor Intelligence | |||
Growing adoption of cloud-native OSS/BSS platforms
Microservices and containerization are redefining operational agility, allowing operators to spin up new services in days rather than months. Gartner projects that 95% of digital workloads will reside on cloud-native foundations by 2025. Early movers report lower total cost of ownership as scale-out clusters handle demand spikes without overprovisioning. However, 57% of carriers cite skills gaps in DevOps and Kubernetes orchestration, prompting heightened demand for managed services and vendor training programs [1]Ericsson, “Cloud native: Unlock the full potential of 5G,” ericsson.com.
Rapid 5G rollout and network-slice monetization
Operators are banking on differentiated service tiers built on network slicing to unlock premium pricing for low-latency and high-throughput use cases. Healthcare, manufacturing, and automotive segments are early adopters, reinforcing the need for dynamic charging, policy, and assurance functions inside converged OSS BSS market solutions.
Customer-experience analytics investments by CSPs
Low Net Promoter Scores have spurred 73% of telecom leaders to reprioritize customer-centric strategies. Predictive analytics pinpoints churn risks, while AI-enabled virtual agents resolve queries in multiple languages, cutting call-center costs. Around 48% of carriers deploy AI specifically for customer-experience gains. Integration of CX insights with charging and fulfillment modules is closing the feedback loop between marketing and operations.
AI-driven autonomous network operations
Level 4 self-healing networks promise to trim outage durations and defer capital spending. Communications service providers are investing nearly USD 14.7 billion annually to cloudify network functions, with Nokia estimating average yearly savings of USD 800 million per operator by 2025. Digital-twin models and large language models improve fault prediction accuracy and accelerate remediation
Restraint Impact Analysis*
| Restraint | (~) % Impact on CAGR Forecast | Geographic Relevance | Impact Timeline |
|---|---|---|---|
| High migration and integration costs from legacy stacks | 1.5% | Global, with higher impact in markets with older infrastructure | Short term (≤ 2 years) |
| Multi-cloud security and compliance complexities | 1.1% | Global, with higher impact in highly regulated markets | Medium term (2-4 years) |
| Shortage of telco-grade AI/ML talent | 0.8% | Global, with severe impact in emerging markets | Medium term (2-4 years) |
| Vendor lock-in risk from supplier consolidation | 0.7% | Global, with higher impact on smaller operators | Long term (≥ 4 years) |
| Source: Mordor Intelligence | |||
High migration and integration costs from legacy stacks
Full-scale platform renewal can reach hundreds of millions of USD and stretch over five years. Many legacy workflows are hard-coded, demanding painstaking data mapping and staff retraining. A McKinsey study finds top performers pursue end-to-end modernization instead of “lift-and-shift” moves, aligning IT transformation with process redesign to capture cost and agility benefits.
Multi-cloud security and compliance complexities
Distributing sensitive customer and network data across several hyperscalers raises audit burden and expands the attack surface. Zero Trust Architecture is emerging as the baseline, authenticating every transaction regardless of location. Ericsson underlines how APT groups target integration points when policies differ between private and public clouds [2]Ericsson, “Evolving the security posture for critical infrastructure,” ericsson.com. Continuous monitoring, secure software pipelines, and unified policy engines are therefore prerequisites for safe OSS BSS market migration strategies.
*Our forecasts treat driver/restraint impacts as directional, not additive. The impact forecasts reflect baseline growth, mix effects, and variable interactions.
Segment Analysis
By Component: Services expand beyond foundational software
The Solutions tier generated 62.40% OSS BSS market share in 2025, supplying core catalog, charging, and assurance platforms essential for telco operations. However, Services are projected to log a 14.85% CAGR through 2031, outpacing the overall OSS BSS market. Convergent billing rollouts, cloud-native migrations, and AI-model tuning require specialised expertise that most carriers lack in-house. Integration projects that span policy, charging, and analytics now account for a growing slice of the OSS BSS market size, while managed-services contracts guarantee KPIs and free operators to focus on product innovation.
Professional-service providers bundle DevOps toolchains, reference architectures, and outcome-based SLAs. The Infovista-CSG partnership announced in February 2025 shows how vendors combine strengths—policy control, automated assurance, and customer-data synchronisation—to shorten deployment and improve service reliability. As implementations scale, recurring optimisation and AI training services will underpin long-term revenue streams for service specialists.


By Deployment Mode: Cloud accelerates cost-efficient scaling
On-premise systems still held 57.65% of the OSS BSS market size in 2025, reflecting the telco tradition of maintaining tight control over mission-critical stacks. Yet public and hybrid clouds are forecast to post an 17.55% CAGR through 2031, thanks to flexible pay-as-you-go models that convert capex to opex. Operators leveraging cloud resources report launch cycles shrinking from months to weeks, while elastic clusters prevent idle capacity during off-peak hours.
Multi-cloud strategies mitigate vendor lock-in and address sovereignty mandates by distributing workloads across different regions. SaaS-based BSS suites with pre-integrated catalog, charging, and CRM modules deliver enterprise-grade reliability without heavy up-front integration fees. Early adopters of cloud-hosted OSS BSS platforms credit open APIs for faster partner onboarding and easier monetisation of 5G network slices, reinforcing the cloud’s strategic role in the OSS BSS market.
By Enterprise Size: SMEs close capability gaps
Large enterprises commanded 70.55% OSS BSS market share in 2025 because of hefty budgets and complex service portfolios. Small and medium enterprises, however, are forecast to grow at a 16.25% CAGR as cloud-native delivery lowers barriers to entry. Modular building blocks allow SMEs to start with essential billing and customer-care functions, then layer on analytics, assurance, and inventory as business expands.
Vendors such as Radius, Flolive, and Blue Planet offer templated OSS BSS bundles that can be activated in weeks and scaled linearly with subscriber volumes. These pay-per-use models make enterprise-grade operations accessible without large capex outlays, enabling regional carriers and MVNOs to compete on customer experience and niche service offerings. As SME adoption rises, long-tail demand will add incremental momentum to the overall OSS BSS industry.

By Industry Vertical: Retail catalyses cross-sector growth
IT & Telecom dominated with 45.90% OSS BSS market share in 2025, yet retail & e-commerce is projected to expand at a staggering 22.65% CAGR to 2031. Subscription commerce, loyalty programmes, and omnichannel fulfilment drive demand for telecom-grade billing, catalog, and customer-data management. Retailers adopt OSS BSS capabilities to orchestrate complex promotions, manage real-time inventory, and personalise offers, all while capturing granular usage data.
Flexible pricing engines and convergent charging frameworks underpin new revenue models such as buy-now-pay-later subscriptions and dynamic delivery fees. As industries blur, OSS BSS vendors reposition catalog and order-management modules to suit non-telco scenarios, opening fresh addressable segments and making retail one of the fastest multipliers for future OSS BSS market size expansion.
Geography Analysis
North America led with 34.45% revenue in 2025, driven by early 5G rollouts, deep fibre backbones, and a regulatory climate rewarding quality-of-service improvements. Many regional carriers deploy AI in support centres and network-operations hubs—48% already leverage AI for better customer experiences . Cloud migrations are accelerated by hyperscale data-centre footprints and well-defined security frameworks, allowing operators to monetise slices for industries such as healthcare and logistics.
Asia-Pacific is poised to deliver the fastest growth, with a 19.10% CAGR through 2031. China, India, Japan, and South Korea are deploying nationwide 5G and fibre networks under ambitious digital-economy plans. Cloud-native OSS BSS architectures help carriers manage massive subscriber bases and launch tiered enterprise offerings. Emerging markets leverage SaaS licensing to overcome capital constraints, while developed nations focus on advanced network-slice orchestration and AI-driven assurance.
Europe maintains meaningful influence in the OSS BSS market owing to strict data-privacy rules and a push for sovereign cloud ecosystems. Operators face profit-pressure from price regulation and competitive overbuilds, prompting infrastructure-sharing and value-added partnerships. The EU Digital Decade policy promotes interoperable, API-first solutions, driving demand for flexible OSS BSS stacks that satisfy cross-border compliance. Investments in rural broadband and private-5G for manufacturing will sustain steady platform adoption.

Competitive Landscape
Top players Amdocs, Huawei, Ericsson, Nokia, and Netcracker collectively control roughly 60% of global revenue, indicating moderate concentration. These incumbents bundle end-to-end portfolios, leverage large RandD budgets, and pursue acquisitions to extend cloud and AI capabilities. New entrants focusing on cloud-native microservices challenge legacy licensing models by promising shorter deployment cycles and lower ownership costs.
Strategic focus now centers on AI acceleration. Amdocs introduced its AI Factory and amAIz Suite in 2025, combining generative models with unified data fabrics to improve upsell targeting and network troubleshooting. Oracle’s pre-integrated BSS platform underscores a shift toward open ecosystems that let carriers monetize APIs and bundle third-party applications.
All vendors are weaving security into every software layer to address multi-cloud compliance and heightened geopolitical scrutiny. Partnerships with AWS, Google Cloud, and Microsoft Azure are standard, evidenced by Ericsson’s 2025 alliance renewal with AWS to co-optimize AI analytics, orchestration, and monetization services ericsson.com. These collaborations reinforce a services-led approach that converts one-time licenses into long-term recurring revenue streams, sharpening competitive edges.
OSS BSS Industry Leaders
Huawei Technologies Co., Ltd.
Nokia Corporation
Telefonaktiebolaget LM Ericsson
Amdocs Limited
Netcracker Technology Corporation
- *Disclaimer: Major Players sorted in no particular order

Recent Industry Developments
- April 2025: Cerillion unveiled a breakthrough Promotions Engine and generative-AI updates in its latest BSS/OSS suite, boosting personalized-offer agility.
- March 2025: Mavenir partnered with Tune Talk to roll out a cloud-native digital OSS BSS platform across Malaysia, streamlining service creation for regional operators.
- February 2025: Ericsson and AWS renewed their strategic collaboration to modernize core commerce, monetization, and analytics through cloud-native OSS/BSS software and generative AI.
- February 2025: Infovista linked with CSG to deliver integrated policy, charging, and assurance solutions aimed at boosting operational efficiency for CSPs.


Research Methodology Framework and Report Scope
Market Definitions and Key Coverage
Our study defines the OSS/BSS market as the aggregate revenue earned from purpose-built operations support system and business support system software plus associated implementation and maintenance services that telecom operators deploy to run networks, monetize connectivity, and manage customers. Mordor Intelligence captures only pure-play OSS/BSS platforms and their direct services, thereby reflecting the spend telecom carriers actually book in their IT budgets.
Scope exclusion: hardware controllers, generic IT service-management suites, and consulting programs that are not tied to an installed OSS/BSS license are left outside our numbers.
Segmentation Overview
- By Component
- Solutions
- Services
- By Deployment Mode
- On-Premise
- Cloud-Based
- By Enterprise Size
- Large Enterprises
- Small and Medium Enterprises
- By Industry Vertical
- IT and Telecom
- BFSI
- Media and Entertainment
- Retail and E-commerce
- Government and Public Sector
- Other Industry Verticals
- By Geography
- North America
- United States
- Canada
- Mexico
- South America
- Brazil
- Argentina
- Rest of South America
- Europe
- Germany
- United Kingdom
- France
- Italy
- Spain
- Russia
- Rest of Europe
- Asia-Pacific
- China
- Japan
- India
- South Korea
- Australia and New Zealand
- Rest of Asia-Pacific
- Middle East and Africa
- Middle East
- Saudi Arabia
- UAE
- Turkey
- Rest of Middle East
- Africa
- South Africa
- Nigeria
- Kenya
- Rest of Africa
- Middle East
- North America
Detailed Research Methodology and Data Validation
Primary Research
Targeted interviews with OSS product heads, billing architects, cloud-migration leads, and regional telecom regulators across North America, Europe, and Asia refine price points, deployment timelines, and pain-point prioritization. Follow-up surveys with mid-tier operators validate license versus subscription mixes and discount curves that are not visible in public filings.
Desk Research
We begin with structured searches across open datasets from bodies such as the International Telecommunication Union, GSMA Intelligence, and national telecom regulators, which inform subscriber bases, 5Grollout milestones, and average revenue per user. Trade associations, including TM Forum and the European Telecommunications Network Operators' Association, provide technology adoption benchmarks, while company 10-Ks, investor presentations, and reputable press track vendor contract wins. Paid resources like D&B Hoovers and Dow Jones Factiva give us audited financial trails that anchor vendor revenue splits. This list is illustrative; numerous other sources support data collection, cross-checks, and clarification.
The breadth of public and paid inputs lets our junior analysts build a fact pattern before a single model equation is written, and it highlights early inconsistencies that primary work must resolve. We keep every citation archived so clients can retrace critical assumptions.
Market-Sizing & Forecasting
A top-down penetration-rate demand pool assessment starts with operator counts, subscriber lines, and typical OSS/BSS spend per subscriber; results are then corroborated by selective bottom-up vendor roll-ups and sampled ASP × volume checks. Variables such as 5Gsubscriber additions, cloud-native deployment share, and evolving ARPU guide trend coefficients. Multivariate regression, reviewed with our expert panel, projects the 2025-2030 path and flags scenario ranges when capex cycles or regulation shift. Data gaps in smaller geographies are bridged using weighted regional proxies that are revisited once fresh inputs emerge.
Data Validation & Update Cycle
Outputs flow through anomaly dashboards, peer review, and a senior sign-off. Reports refresh each year, and an interim update triggers when material vendor wins, spectrum auctions, or policy moves alter the baseline.
Why Mordor's OSS BSS Baseline Commands Reliability
Published figures often diverge because firms mix scopes, currencies, and refresh cadences. Our disciplined focus on licensed software plus directly linked services, refreshed annually, keeps our baseline tight and transparent.
Key gap drivers include some publishers blending network equipment and broad digital transformation work, others assuming uniform global ASPs, and a few extrapolating multi-year deals without currency normalization.
Benchmark comparison
| Market Size | Anonymized source | Primary gap driver |
|---|---|---|
| USD 24.70 B (2025) | Mordor Intelligence | |
| USD 67.70 B (2023) | Global Consultancy A | Includes hardware support and professional service bundles |
| USD 65.81 B (2024) | Industry Research Firm B | Double counts multi-domain platform revenue and uses single exchange rate for all regions |
In short, our scoped, variable-based build makes Mordor Intelligence the dependable midpoint clients can trust when budgeting, benchmarking, or valuing opportunities in the rapidly evolving OSS/BSS arena.


Key Questions Answered in the Report
How big is the OSS BSS Market?
The OSS BSS Market size is expected to reach USD 28.14 billion in 2026 and grow at a CAGR of 13.95% to reach USD 54.06 billion by 2031.
What is driving the strong CAGR in the OSS BSS market?
The 13.95% CAGR through 2031 stems from cloud-native adoption, 5G network-slice monetization, and rising demand for AI-driven customer-experience analytics.
How large will the OSS BSS market be by 2031?
The market is projected to reach USD 54.06 billion by 2031, nearly doubling its 2025 value.
Which deployment model is growing fastest?
Cloud-based OSS/BSS solutions are expanding at an 17.55% CAGR as operators seek agility and lower capital outlays.
Why are retailers investing in OSS/BSS platforms?
Retailers need telecom-grade billing and customer-management tools to support omnichannel commerce and subscription services, fueling a 22.65% CAGR in that vertical.
How does AI influence competitive differentiation in OSS/BSS?
Vendors integrating generative AI for proactive care, autonomous operations, and personalized offers capture greater share by enabling carriers to reduce costs and boost customer loyalty.
Page last updated on:


