Open RAN Market Size and Share
Market Overview
| Study Period | 2020 - 2031 |
|---|---|
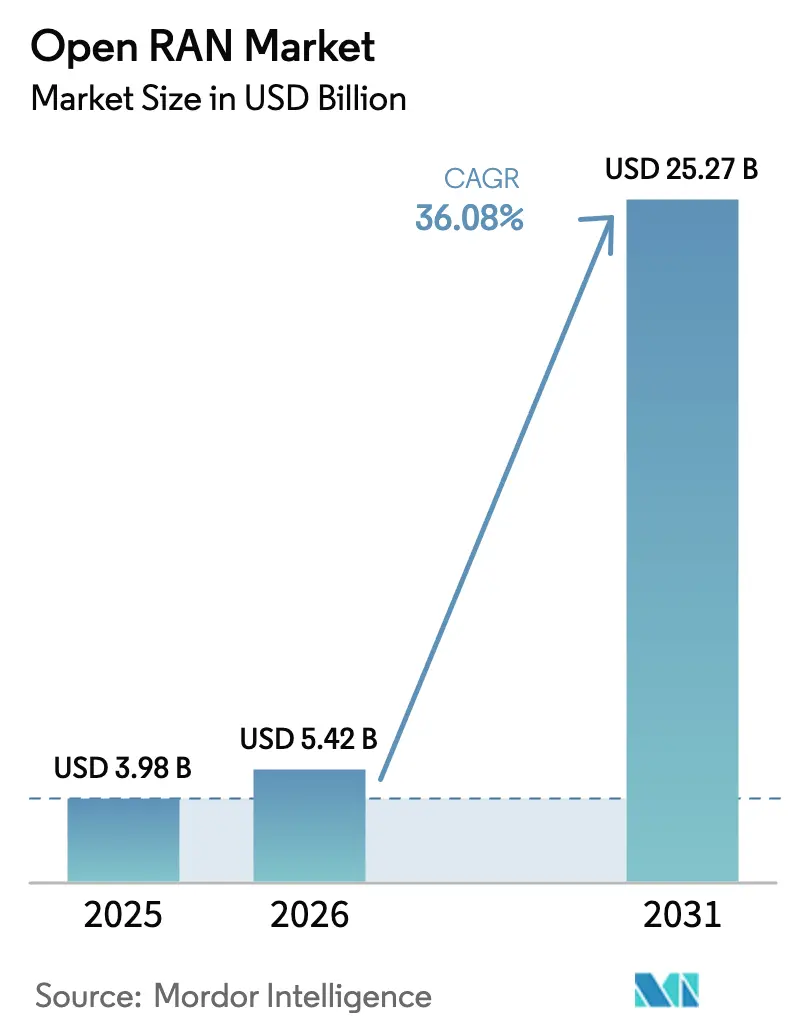
| Market Size (2026) | USD 5.42 Billion |
| Market Size (2031) | USD 25.27 Billion |
| Growth Rate (2026 - 2031) | 36.08% CAGR |
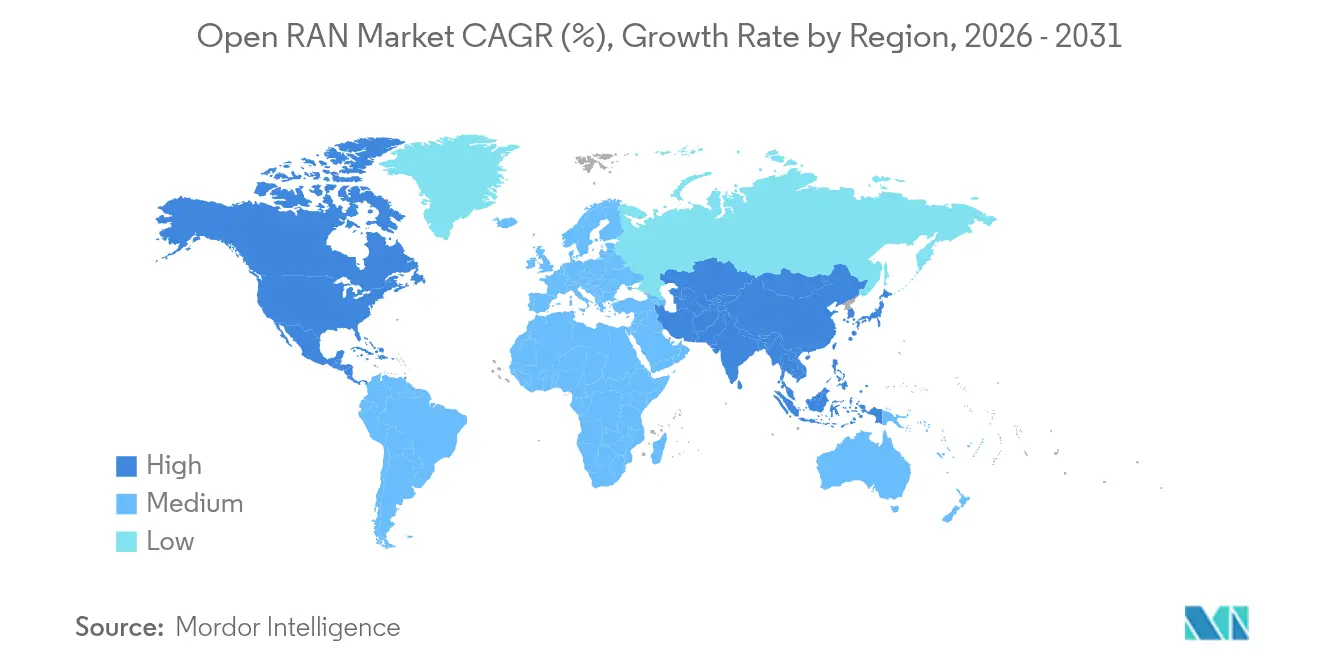
| Fastest Growing Market | Asia Pacific |
| Largest Market | Asia Pacific |
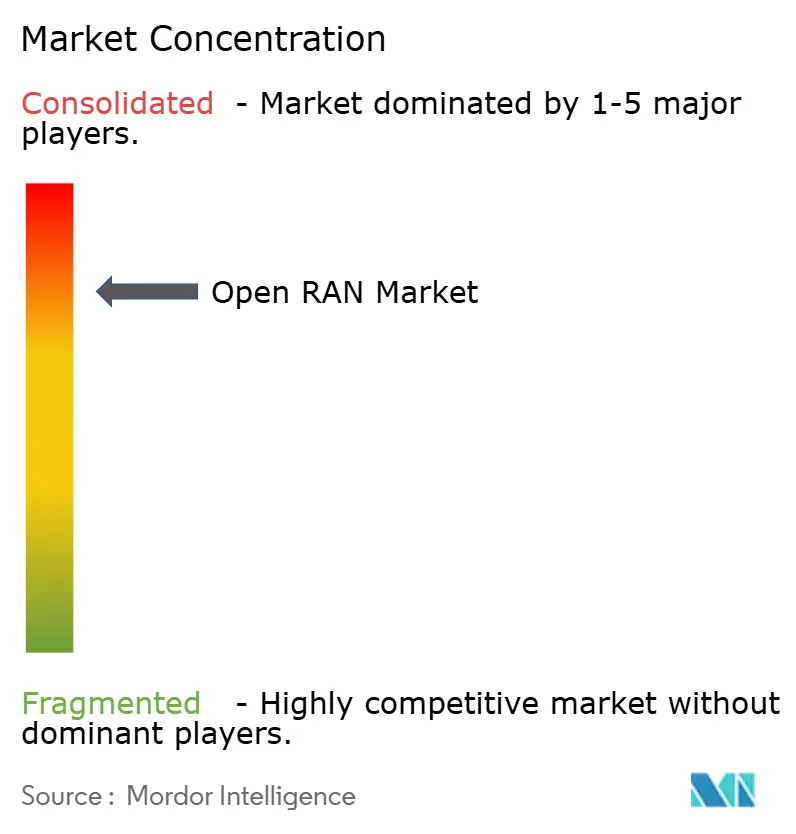
| Market Concentration | High |
Major Players *Disclaimer: Major Players sorted in no particular order Image © Mordor Intelligence. Reuse requires attribution under CC BY 4.0. | |
Open RAN Market Analysis by Mordor Intelligence
The Open RAN market size was valued at USD 3.98 billion in 2025 and estimated to grow from USD 5.42 billion in 2026 to reach USD 25.27 billion by 2031, at a CAGR of 36.08% during the forecast period (2026-2031). Commercial momentum stems from operators replacing proprietary stacks with disaggregated architectures that improve procurement flexibility, spur software innovation, and lower total cost of ownership. Global 5G densification, hyperscaler edge partnerships, and government-backed diversification mandates collectively accelerate deployments, while rapid silicon advances pull hardware costs down and make rural coverage economically feasible. At the same time, integration complexity, energy-efficiency gaps, and lingering security concerns temper adoption speed, causing many tier-one operators to pursue phased or “single-vendor-open” rollouts. Overall, the Open RAN market continues to evolve from early proofs of concept into large-scale commercial installations that integrate artificial intelligence and cloud-native orchestration to optimize spectrum usage and operational economics.
Key Report Takeaways
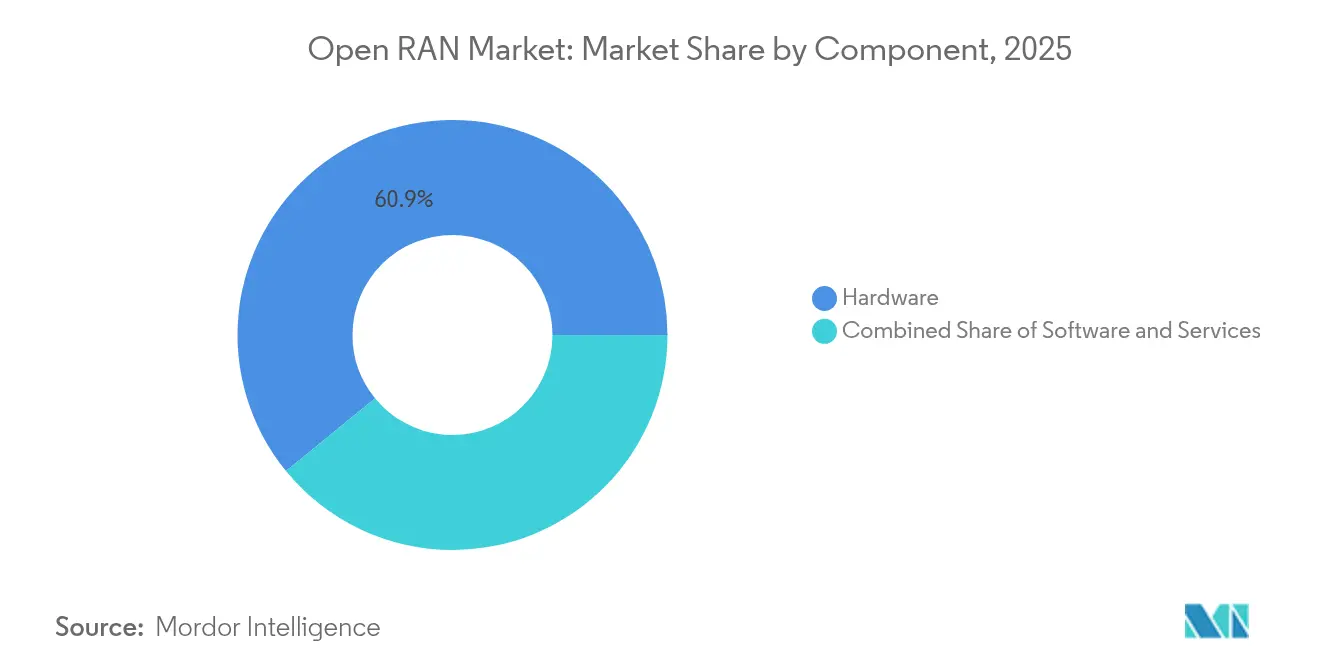
- By component, hardware held a 60.90% revenue share of the Open RAN market in 2025; software is projected to expand at a 27.95% CAGR through 2031.
- By network generation, 5G commanded 77.20% of the Open RAN market share in 2025 and is forecast to grow at a 35.10% CAGR to 2031.
- By deployment type, public macrocell infrastructure accounted for 56.60% of the Open RAN market size in 2025, whereas private enterprise networks lead growth at a 33.15% CAGR between 2026-2031.
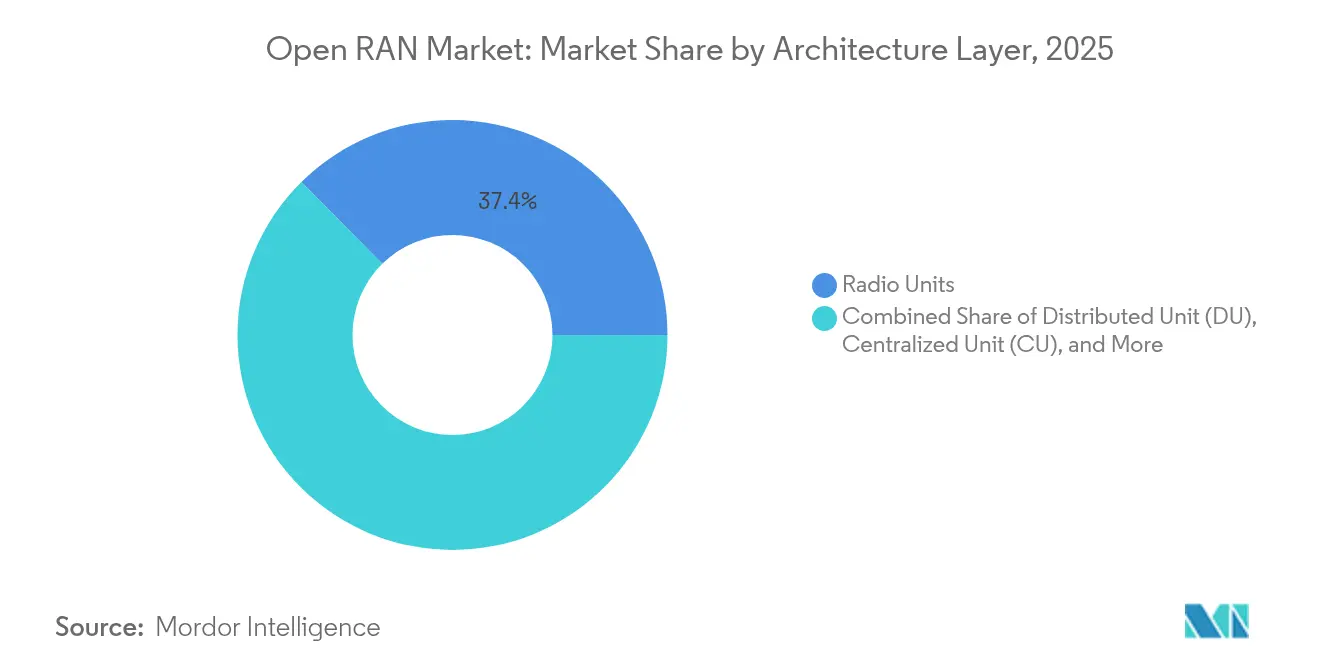
- By architecture layer, radio units contributed 37.40% of the Open RAN market size in 2025; the RAN Intelligent Controller is advancing at a 39.05% CAGR through 2031.
- By end user, mobile network operators represented 65.70% of demand in 2025, while enterprise and vertical segments are growing at 26.40% CAGR to 2031.
- By geography, Asia-Pacific held 40.20% of global revenue in 2025 and is forecast to grow at a 21.15% CAGR to 2031.
Note: Market size and forecast figures in this report are generated using Mordor Intelligence’s proprietary estimation framework, updated with the latest available data and insights as of 2026.
Global Open RAN Market Trends and Insights
Drivers Impact Analysis*
| Driver | (~) % Impact on CAGR Forecast | Geographic Relevance | Impact Timeline |
|---|---|---|---|
| 5G densification for urban and rural coverage | +8.5% | Global, strongest in Asia-Pacific and North America | Medium term (2-4 years) |
| Government-funded open-network programs | +6.2% | North America and EU, spill-over into Asia-Pacific | Long term (≥ 4 years) |
| Lower TCO from multi-vendor disaggregation | +5.8% | Global | Medium term (2-4 years) |
| Hyperscaler edge partnerships for vRAN | +4.3% | North America and EU, expanding into Asia-Pacific | Short term (≤ 2 years) |
| AI-enabled RIC spectral-efficiency gains | +3.7% | Global, early adoption in developed markets | Medium term (2-4 years) |
| Silicon diversification lowering RU costs | +2.9% | Global | Long term (≥ 4 years) |
| Source: Mordor Intelligence | |||
5G densification for urban and rural coverage
Mobile data consumption is doubling within four years as operators extend broadband and IoT services, and the Open RAN market is becoming a preferred route to densify both city cores and underserved rural corridors because its standardized radio units cut deployment costs by as much as 30% without sacrificing performance. Operators such as China Mobile have earmarked USD 416 million in 2025 to broaden 5G-Advanced coverage across 300 cities, accelerating the demand for modular radio footprints that can be sourced from multiple vendors. The economics are equally compelling in remote areas, where disaggregated architectures enable smaller suppliers to enter the market and help national regulators meet universal service goals. As rural connectivity becomes a social priority, disaggregated hardware and cloud-native software jointly reduce the cost per bit. Consequently, densification-driven Open RAN procurements span both macro and small-cell topologies, underscoring the architecture’s versatility across disparate population densities.
Government-funded open-network programs
Policy makers view Open RAN as a vehicle to diversify supply chains and enhance national security, prompting multi-year funding commitments that materially lift demand. The United States has allocated USD 1.5 billion via the Public Wireless Supply Chain Innovation Fund to foster open-interface development and commercialization [1]National Telecommunications and Information Administration, “Public Wireless Supply Chain Innovation Fund,” ntia.gov. Initial tranches totaling USD 273 million have gone to firms such as JMA Wireless and Nokia for open-radio prototypes, with the Department of Defense separately planning private 5G networks across 800 bases¬—a blueprint that validates performance and drives scale. The European Union, while more measured, still channels research and development grants toward vendor-neutral radio platforms, and Japan’s Digital Agency offers tax incentives for local carriers embracing multi-vendor architectures. These programs create early demand, encourage interoperability testing, and compress the payback period for ecosystem participants, thereby enlarging the global Open RAN market over the long term.
Lower TCO from multi-vendor disaggregation
Operators pursuing cost optimization recognize that component competition and cloud automation can trim both capex and opex by 20-40% compared with traditional single-vendor stacks. AT&T’s USD 14 billion, five-year open-interface framework with Ericsson illustrates how a tier-one carrier can keep ecosystem options open while locking in predictable unit pricing and software road-maps. Disaggregation lets procurement teams negotiate radio units, baseband cards, and RIC software independently, creating price tension across the supply chain. Verizon’s rollout of more than 130,000 O-RAN-ready radios reveals how massive-scale networks leverage open specifications for vendor diversification, and in parallel, software intelligence drives energy savings of roughly 15% across high-traffic clusters [2] Verizon Communications, “Verizon Deploys 130,000 O-RAN Radios,” verizon.com. Although integration complexity lifts professional-services spend, operators increasingly internalize those skills or rely on neutral-host integrators, keeping total cost trajectories well below legacy models over the system life cycle.
Hyperscaler edge partnerships for vRAN
Cloud-service providers are reshaping the Open RAN market by combining edge compute footprints with turnkey vRAN stacks, enabling carriers to deploy AI-infused network functions closer to end users. Verizon’s collaboration with NVIDIA brings real-time GPU acceleration into private 5G, unlocking advanced analytics and computer-vision applications that require single-digit millisecond latency. T-Mobile’s AI-RAN Innovation Center, co-developed with NVIDIA, Ericsson, and Nokia, accelerates algorithm training and simplifies DevOps pipelines for third-party developers. Hyperscalers supply automated orchestration, elastic compute, and global marketplace models that lower the entry barrier for enterprises demanding bespoke mobile networks. For telecom operators, renting cloud edge capacity sidesteps large data-center outlays and shortens time to revenue, making these alliances potent catalysts for virtualized RAN adoption during the next two years.
Restraints Impact Analysis*
| Restraint | (~) % Impact on CAGR Forecast | Geographic Relevance | Impact Timeline |
|---|---|---|---|
| Fragmented standards delaying interoperability | -4.8% | Global | Medium term (2-4 years) |
| Vendor IP and security concerns among tier-one MNOs | -3.2% | North America and EU | Short term (≤ 2 years) |
| Energy-efficiency gap versus proprietary RAN | -2.7% | Global | Medium term (2-4 years) |
| Operator SI skill shortages inflating deployment cost | -2.1% | Global, acute in emerging regions | Long term (≥ 4 years) |
| Source: Mordor Intelligence | |||
Fragmented standards delaying interoperability
Despite 74 new or revised O-RAN Alliance specifications released since mid-2024, practical interoperability tests still uncover disparate implementations that slow multivendor rollouts. Vodafone and Orange needed extensive lab work with Samsung, Wind River, and Dell to achieve even baseline 2G and 4G functionality in a joint Romanian pilot, illustrating how divergent software maturity can stretch integration budgets. As operators confront elongated test cycles, many retreat to “single-vendor-open” scenarios that erode the competitive diversity Open RAN was designed to foster. The result is an ecosystem where theoretical interface compliance does not equate to plug-and-play deployments. Certification programs are expanding, yet the cadence of silicon releases often outpaces standard harmonization, creating perpetual chasing of interoperability that depresses near-term Open RAN market growth.
Vendor IP and security concerns among tier-one MNOs
Opening previously closed interfaces inevitably broadens attack surfaces, and tier-one carriers remain cautious about exposing mission-critical control planes to third-party code. The O-RAN Alliance Security Working Group has published zero-trust guidelines and root-of-trust recommendations, but risk-averse operators continue to demand rigorous penetration testing before signing commercial contracts. Separate academic research suggests blockchain-based supply-chain verification could strengthen provenance tracking, yet such tools add latency and cost, further discouraging rapid adoption. Intellectual-property anxiety compounds the challenge, because traditional vendors fear that standardized APIs might reveal algorithmic trade secrets and erode their differentiation. The US Government’s latest purchasing guidelines recognize these risks, requiring continuous compliance audits, which prolong procurement timetables and modestly reduce the Open RAN market CAGR in the short term.
*Our forecasts treat driver/restraint impacts as directional, not additive. The impact forecasts reflect baseline growth, mix effects, and variable interactions.
Segment Analysis
By Component: Software Acceleration Drives Transformation
Hardware represented 60.90% of revenue in 2025, reflecting hefty radio and baseband outlays that remain indispensable to large-scale rollouts. Even so, software is now the fastest-moving component, compounding at 27.95% through 2031 as carriers infuse artificial intelligence into orchestration layers and shift signal processing toward cloud nodes. Integration services, though the smallest slice, are vital for multi-vendor harmonization, and their share climbs steadily as operators outsource complex testing and optimization tasks. Mavenir’s AI-infused RAN stack, jointly optimized with Intel FlexRAN, exemplifies how algorithmic innovation is anchored in software rather than silicon. Verizon’s Energy Saving Manager shows software can trim radio-site power draw by 15%, underscoring tangible opex benefits. Consequently, budget allocations gradually pivot from hardware line items toward subscription-based software licenses and outcome-oriented professional services.
Expanding virtualization also reshapes vendor dynamics. Disruptors such as Parallel Wireless compete on lightweight containerized code, while incumbent suppliers retrofit proprietary DSP pipelines to maintain performance leadership. The choice of micro-services versus monolithic virtual machines has ramifications for lifecycle management, patch cadence, and Kubernetes portability. In aggregate, the mix shift toward code and cloud layers signals that differentiation in the Open RAN industry will pivot on software road-maps and ecosystem alliances rather than commodity radio enclosures.


By Network Generation: 5G Dominance Accelerates
The Open RAN market size for 5G deployments accounted for 77.20% of global revenue in 2025 and is advancing at a 35.10% CAGR, catalyzed by operators eager to monetize mid-band spectrum and deliver network slicing for enterprise SLAs. Legacy 4G deployments persist in cost-sensitive zones, while 6G research top-ups comprise a negligible share but indicate future revenue potential. China’s carriers alone are budgeting nearly USD 3 billion in 2025 for 5G-Advanced upgrades that include AI-driven massive MIMO calibration to elevate spectral efficiency. Samsung’s successful verification of vRAN-based 5G RedCap underscores the continuous innovation cycle that keeps the generation relevant .
Operators are layering cloud RAN in high-density markets to support real-time extended-reality services, and private network integrators increasingly specify 5G-SA cores with open fronthaul to unlock deterministic latency. Governments often mandate 5G coverage for critical infrastructure, further cementing the generation’s primacy. Collectively, these initiatives ensure that 5G remains the revenue engine of the Open RAN market through 2031, even as standards bodies begin early-stage 6G harmonization.
By Deployment Type: Enterprise Networks Drive Innovation
Public macrocells commanded 56.60% of installations in 2025, supplying blanket coverage for consumer traffic; however, private enterprise networks are expanding at a striking 33.15% CAGR, signalling a wholesale shift toward on-premise connectivity that supports automation, quality monitoring, and mobile robotics. Cummins’ 1 million-square-foot factory deployment with Verizon Business demonstrates how neutral-host infrastructure can serve both public and private traffic while leveraging common Open RAN building blocks. China hosts more than 5,325 private 5G networks across at least 40 verticals, legitimizing industrial-grade service-level requirements and validating Open RAN for manufacturing, mining, and logistics.
Indoor systems such as distributed antenna solutions also benefit from open architectures, because integrators can swap radio heads without re-engineering baseband pools, lowering total project cost. As 5G-Advanced features like 1024-QAM become mainstream, enterprises increasingly value the ability to upgrade software over-the-air, avoiding forklift hardware swaps. Consequently, enterprise-grade small cells and neutral-host frameworks are pivotal catalysts for incremental Open RAN market revenue throughout the forecast horizon.
By Architecture Layer: RIC Emerges as Intelligence Hub
Radio units supplied 37.40% of market revenue in 2025, confirming that antennas and power amplifiers remain the biggest single cost center within cell sites. Yet the RAN Intelligent Controller is racing ahead at a 39.05% CAGR as carriers embed xApps and rApps to automate beam steering, slice admission, and energy governance. Verizon has field-tested a multi-vendor RIC stack that brings Samsung and Qualcomm analytics together, illustrating commercial viability at metropolitan scale. Third-party developers already monetize specialized algorithms for massive MIMO adaptation via marketplace models, pointing to a new economics where software royalties complement hardware sales.
Distributed and centralized units provide the computational substrate, and their migration from FPGA-centric boards to general-purpose processors accelerates cost deflation. In parallel, service-management and orchestration frameworks enforce policy across heterogeneous vendors, reducing mean time to recovery and fueling the appeal of disaggregation. Overall, the shift of control-plane intelligence toward RIC platforms not only lifts Open RAN market growth but also redefines where value accrues within the ecosystem.
By End User: Enterprise Adoption Accelerates
Mobile network operators formed 65.70% of 2025 spending, leveraging existing tower footprints and spectrum holdings to pilot open-interface solutions. Nevertheless, enterprise and industrial buyers are raising their cumulative contribution at a 26.40% CAGR as digital transformation agendas demand deterministic latency and robust security constraints that Wi-Fi cannot address. Boldyn Networks’ acquisition of Cellnex’s private-network portfolio, spanning more than 50 installations across Europe, reflects strategic positioning to target factories, ports, and energy sites .
Government and defense demand is also rising. The US Department of Defense plans to incorporate Open RAN across 800 bases, asserting that rigorous zero-trust frameworks can coexist with multivendor radio sourcing . Neutral-host providers fill a niche by operating shared infrastructure in sports venues and transport hubs, capturing incremental tenants without duplicating radio assets. In sum, these diversified buyer groups ensure broader revenue stability and mitigate the Open RAN market’s historical dependence on macro-cell refresh cycles.
Geography Analysis
Asia-Pacific held a commanding 40.20% of global revenue in 2025 and is growing at 21.15% CAGR as national operators pursue aggressive 5G-Advanced rollouts and policy makers champion domestic technology ecosystems. China alone supports more than 5,325 private 5G networks across 40 industries, affirming robust enterprise appetite for cloud-native radio architectures. Japan’s KDDI has deployed O-RAN-compliant virtual bases in Osaka, and Vietnam’s Viettel is scaling thousands of open sites to reduce reliance on external suppliers. Manufacturing density, combined with supportive industrial policy, positions the region as the principal engine of Open RAN market expansion for the rest of the decade.
North America ranks second, underpinned by USD 1.5 billion in federal innovation grants, ATandT’s USD 14 billion open-interface framework with Ericsson, and Verizon’s deployment of over 130,000 O-RAN-ready radios. Hyperscaler influence is pronounced, with AWS, Azure, and Google Cloud all offering validated cloud stacks for vRAN workloads, thereby shortening time-to-market for smaller regional carriers. Canada’s TELUS, partnering with Samsung, delivered the country’s first commercial fully virtualized Open RAN macro site, signaling a wider continental trend toward software-based modernization.
Europe remains cautious but active. Orange and Vodafone’s joint Romanian pilot, supported by Samsung radios and Dell servers, demonstrates progress despite extended integration cycles. Regulatory stances vary: the United Kingdom targets 35% of mobile traffic to traverse Open RAN infrastructure by 2030, whereas Germany permits continued Huawei deployments, slowing local demand for open alternatives. Middle East and Africa illustrate nascent but meaningful activity. Solutions by stc activated the first commercial Open RAN macro site in Saudi Arabia using Mavenir software, and Parallel Wireless surpassed 1,500 live sites across sub-Saharan Africa, where capex constraints elevate the appeal of low-cost, multi-vendor radios.

Competitive Landscape
The Open RAN market displays moderate concentration, because incumbent RAN suppliers still dominate procurement short lists even as new entrants attempt to disrupt. Huawei, Ericsson, Nokia, Samsung, and ZTE collectively command around 94% of the global RAN arena, and each now offers O-RAN-compliant options to shield share while extending managed-service contracts. Ericsson’s long-term strategic agreement with ATandT allows the vendor to act as system architect while keeping interfaces open for future third-party modules, illustrating how incumbents reshape their roles rather than concede revenue.
Samsung positions its virtualized RAN to surpass 53,000 live sites by end-2025, banking on AI-powered energy management and spectrum-sharing features to outpace peers. Nokia has refreshed its anyRAN portfolio with Cloud-RAN blueprints that integrate directly with hyperscaler Kubernetes frameworks, though competitive losses to Ericsson in North America raise questions on near-term momentum. Among challengers, Mavenir secured federal grants but implemented layoffs within its RAN division, underscoring the capital intensity and integration demands that hinder venture-backed suppliers.
Strategic partnerships remain a defining theme. NVIDIA and Qualcomm provide reference accelerator platforms for AI-enabled RIC functions, while IBM and Accenture expand managed-service offerings to compensate for operators’ skill gaps. Collectively, these alliances mitigate fragmentation risk, but they also anchor much of the value inside vertically integrated stacks led by entrenched suppliers. Progress toward true multi-vendor substitution is therefore incremental, suggesting that the Open RAN market will remain an oligopoly through the medium term even as interface compliance proliferates.
Open RAN Industry Leaders
Samsung Electronics Co. Ltd.
NEC Corporation
Fujitsu Limited
Mavenir Systems, Inc.
Nokia Corporation
- *Disclaimer: Major Players sorted in no particular order

Recent Industry Developments
- March 2025: Zain partnered with Rakuten Symphony to advance Open RAN initiatives, enhancing network flexibility.
- February 2025: Rakuten Symphony named Cisco, Airspan, and Tech Mahindra as inaugural members of its Real Open RAN licensing program.
- February 2025: Airspan completed the acquisition of Corning’s wireless business, broadening its DAS and small-cell portfolio for Open RAN.
- February 2025: Kyocera announced entry into the Open RAN market, diversifying its communications portfolio.


Research Methodology Framework and Report Scope
Market Definitions and Key Coverage
Our study defines the Open Radio Access Network (Open RAN) market as revenues generated from disaggregated, standards-based RAN solutions in which radio, distributed, and centralized units plus RAN Intelligent Controllers interoperate through open interfaces across public and private cellular networks operating on 2G through 5G spectrum portfolios.
Scope Exclusion: legacy "closed" RAN upgrades, proprietary small-cell backhaul, and standalone core-network software are not counted.
Segmentation Overview
- By Component
- Hardware
- Software
- Services
- By Network Generation
- 4G
- 5G
- Other
- By Deployment Type
- Public Macrocell
- Private / Enterprise Network
- Indoor Small Cell / DAS
- By Architecture Layer
- Radio Unit (RU)
- Distributed Unit (DU)
- Centralized Unit (CU)
- RAN Intelligent Controller (RIC)
- Service Management and Orchestration (SMO)
- By End User
- Mobile Network Operators
- Neutral-Host Providers
- Enterprises and Industry Verticals
- Government and Defense
- By Geography
- North America
- United States
- Canada
- Mexico
- South America
- Brazil
- Argentina
- Rest of South America
- Europe
- Germany
- United Kingdom
- France
- Italy
- Spain
- Russia
- Rest of Europe
- Asia-Pacific
- China
- Japan
- India
- South Korea
- Australia and New Zealand
- Rest of Asia-Pacific
- Middle East and Africa
- Middle East
- Saudi Arabia
- United Arab Emirates
- Turkey
- Rest of Middle East
- Africa
- South Africa
- Nigeria
- Egypt
- Rest of Africa
- Middle East
- North America
Detailed Research Methodology and Data Validation
Primary Research
We interviewed mobile-network-operator CTO offices, systems integrators, and Open RAN software stack suppliers across North America, Europe, and Asia-Pacific. Surveys of network-planning engineers and enterprise private-5G buyers validated cost-per-site assumptions, deployment pacing, and regional price dispersion, allowing us to tighten model inputs flagged as uncertain during desk work.
Desk Research
Analysts first gathered publicly available evidence from Tier-1 bodies such as the O-RAN Alliance, 3GPP, GSMA Intelligence, the International Telecommunication Union, and national telecom regulators, which outline shipment volumes, interface adoption, and spectrum awards fueling Open RAN uptake. Industry filings, investor decks, and earnings transcripts helped us capture vendor average selling prices and operator capital-expenditure trends. To benchmark vendor footprints, we mined D&B Hoovers and Dow Jones Factiva. Shipment trade-lane hints were pulled from Volza, while patent density around open fronthaul was checked through Questel. These examples illustrate the breadth of sources; many additional databases and press releases were referenced to complete and cross-verify the evidence base.
Market-Sizing & Forecasting
A balanced top-down view (telco RAN CAPEX pools reconstructed from annual reports and regulator data) is aligned with selective bottom-up checks such as sampled radio-unit shipments multiplied by blended ASP. Core model variables include: 5G macro-site additions, open-interface penetration rates, spectrum auction timelines, radio-unit price erosion curves, and enterprise private-network build counts. Gaps in bottom-up counts, common for greenfield private deployments, are filled through regional adoption ratios refined in expert calls before totals are reconciled. Multivariate regression, supplemented by scenario analysis for policy-driven spectrum releases, projects demand to 2030; coefficients are re-weighted annually when new shipment or CAPEX signals emerge.
Data Validation & Update Cycle
Every quarter, our team contrasts model outputs with fresh vendor disclosures, O-RAN Alliance compliance lists, and shipment anomalies; unusual variances trigger re-contact of key informants before numbers move to internal peer review. Mordor Intelligence refreshes published values yearly and issues interim updates when material events, large spectrum auctions or major brownfield conversions, shift baselines.
Why Mordor's Open RAN Baseline Commands Confidence
Published Open RAN values differ because firms adopt distinct scope filters, currency bases, and refresh cadences.
Some fold closed vRAN upgrades into totals, while others extrapolate multi-year purchase commitments rather than booked revenue.
Benchmark comparison
| Market Size | Anonymized source | Primary gap driver |
|---|---|---|
| USD 3.98 B | Mordor Intelligence | |
| USD 4.70 B | Global Consultancy A | Includes closed vRAN retrofit revenue and converts currencies at forecast-year averages |
| USD 6.53 B | Industry Journal B | Relies on vendor shipment pledges, applies single global ASP, limited geography checks |
| USD 3.18 B | Market Snapshot C | Excludes software licences, uses conservative 5G rollout pace |
These contrasts show that Mordor's disciplined scope selection, price-volume grounding, and annual refresh cadence provide a dependable baseline that avoids over-inflation yet captures the real momentum of the Open RAN opportunity.


Key Questions Answered in the Report
What is driving the rapid growth of the Open RAN market?
The surge is fueled by operators seeking lower TCO, government funding that de-risks early deployments, and hyperscaler partnerships that provide edge compute for AI-enabled services.
How large is the global Open RAN market in 2026?
The Open RAN market size stands at USD 5.42 billion in 2026, expanding toward USD 25.27 billion by 2031 at a 36.08% CAGR.
Which region commands the largest Open RAN deployment share?
Asia-Pacific leads with 40.20% of 2025 revenue, supported by China’s widespread 5G-Advanced initiatives and Japan’s early virtualization pilots.
What role do enterprises play in Open RAN adoption?
Enterprises, factories, and logistics hubs are deploying private networks at a 33.15% CAGR, leveraging Open RAN for low-latency automation and IoT.
How are legacy vendors responding to Open RAN?
Companies such as Ericsson, Nokia, and Samsung now offer O-RAN-compliant portfolios while bundling integration services, keeping them central in procurement cycles.
What are the main challenges facing Open RAN rollouts?
Fragmented standards, security and IP concerns, energy-efficiency gaps, and shortages of skilled systems integrators continue to restrain mass-market adoption.
Page last updated on:


