Oral Cancer Therapy Market Size and Share
Market Overview
| Study Period | 2020 - 2031 |
|---|---|
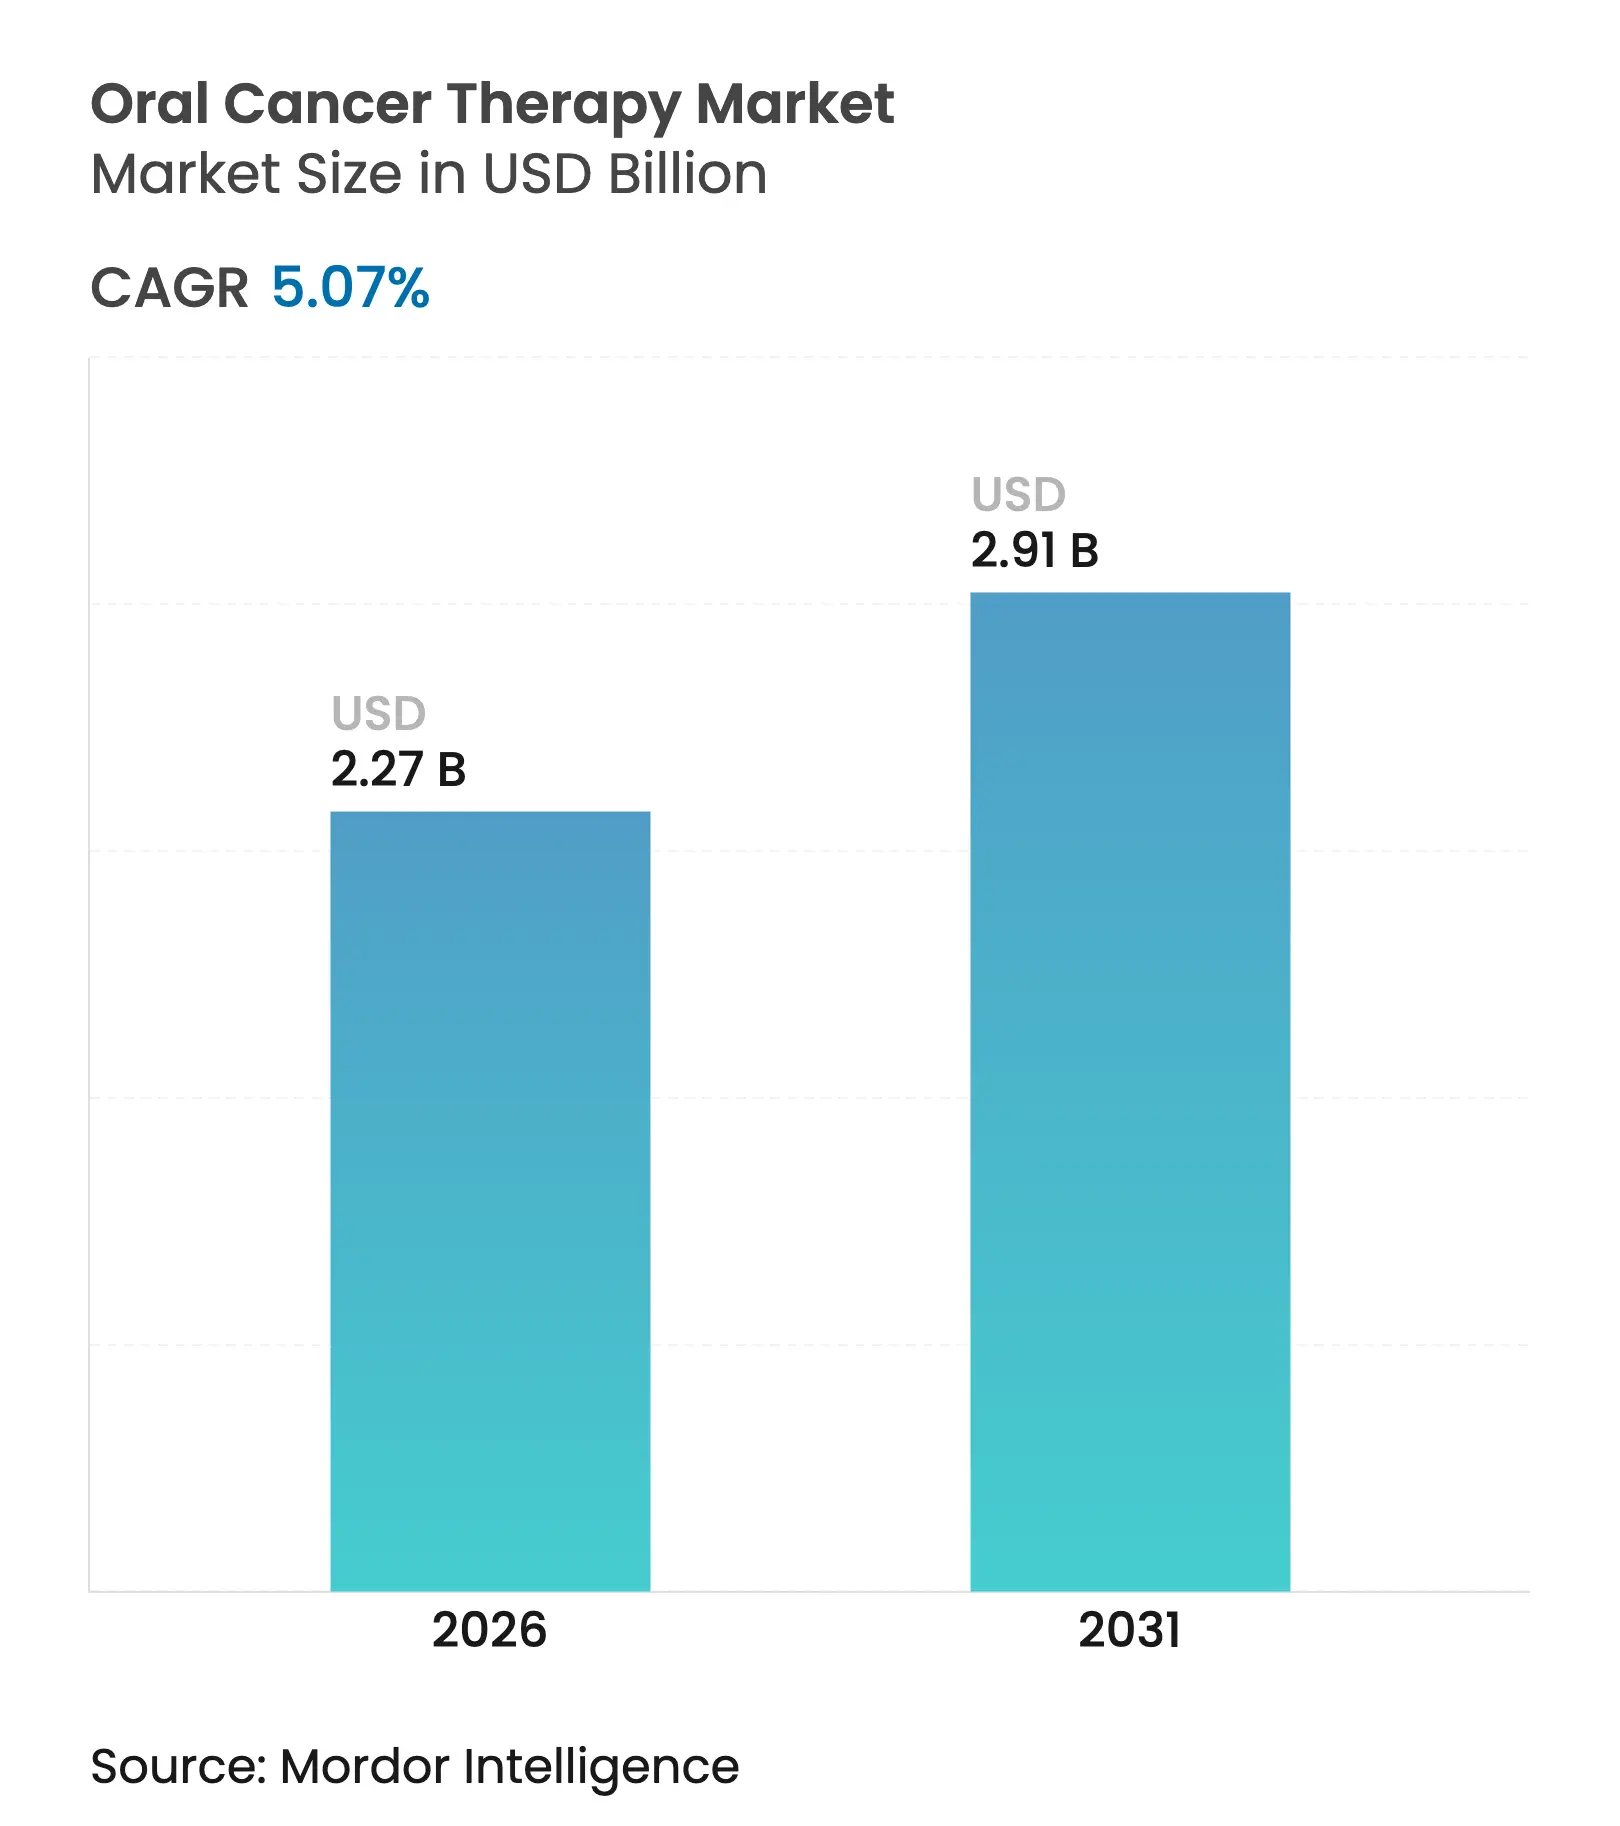
| Market Size (2026) | USD 2.27 Billion |
| Market Size (2031) | USD 2.91 Billion |
| Growth Rate (2026 - 2031) | 5.07 % CAGR |
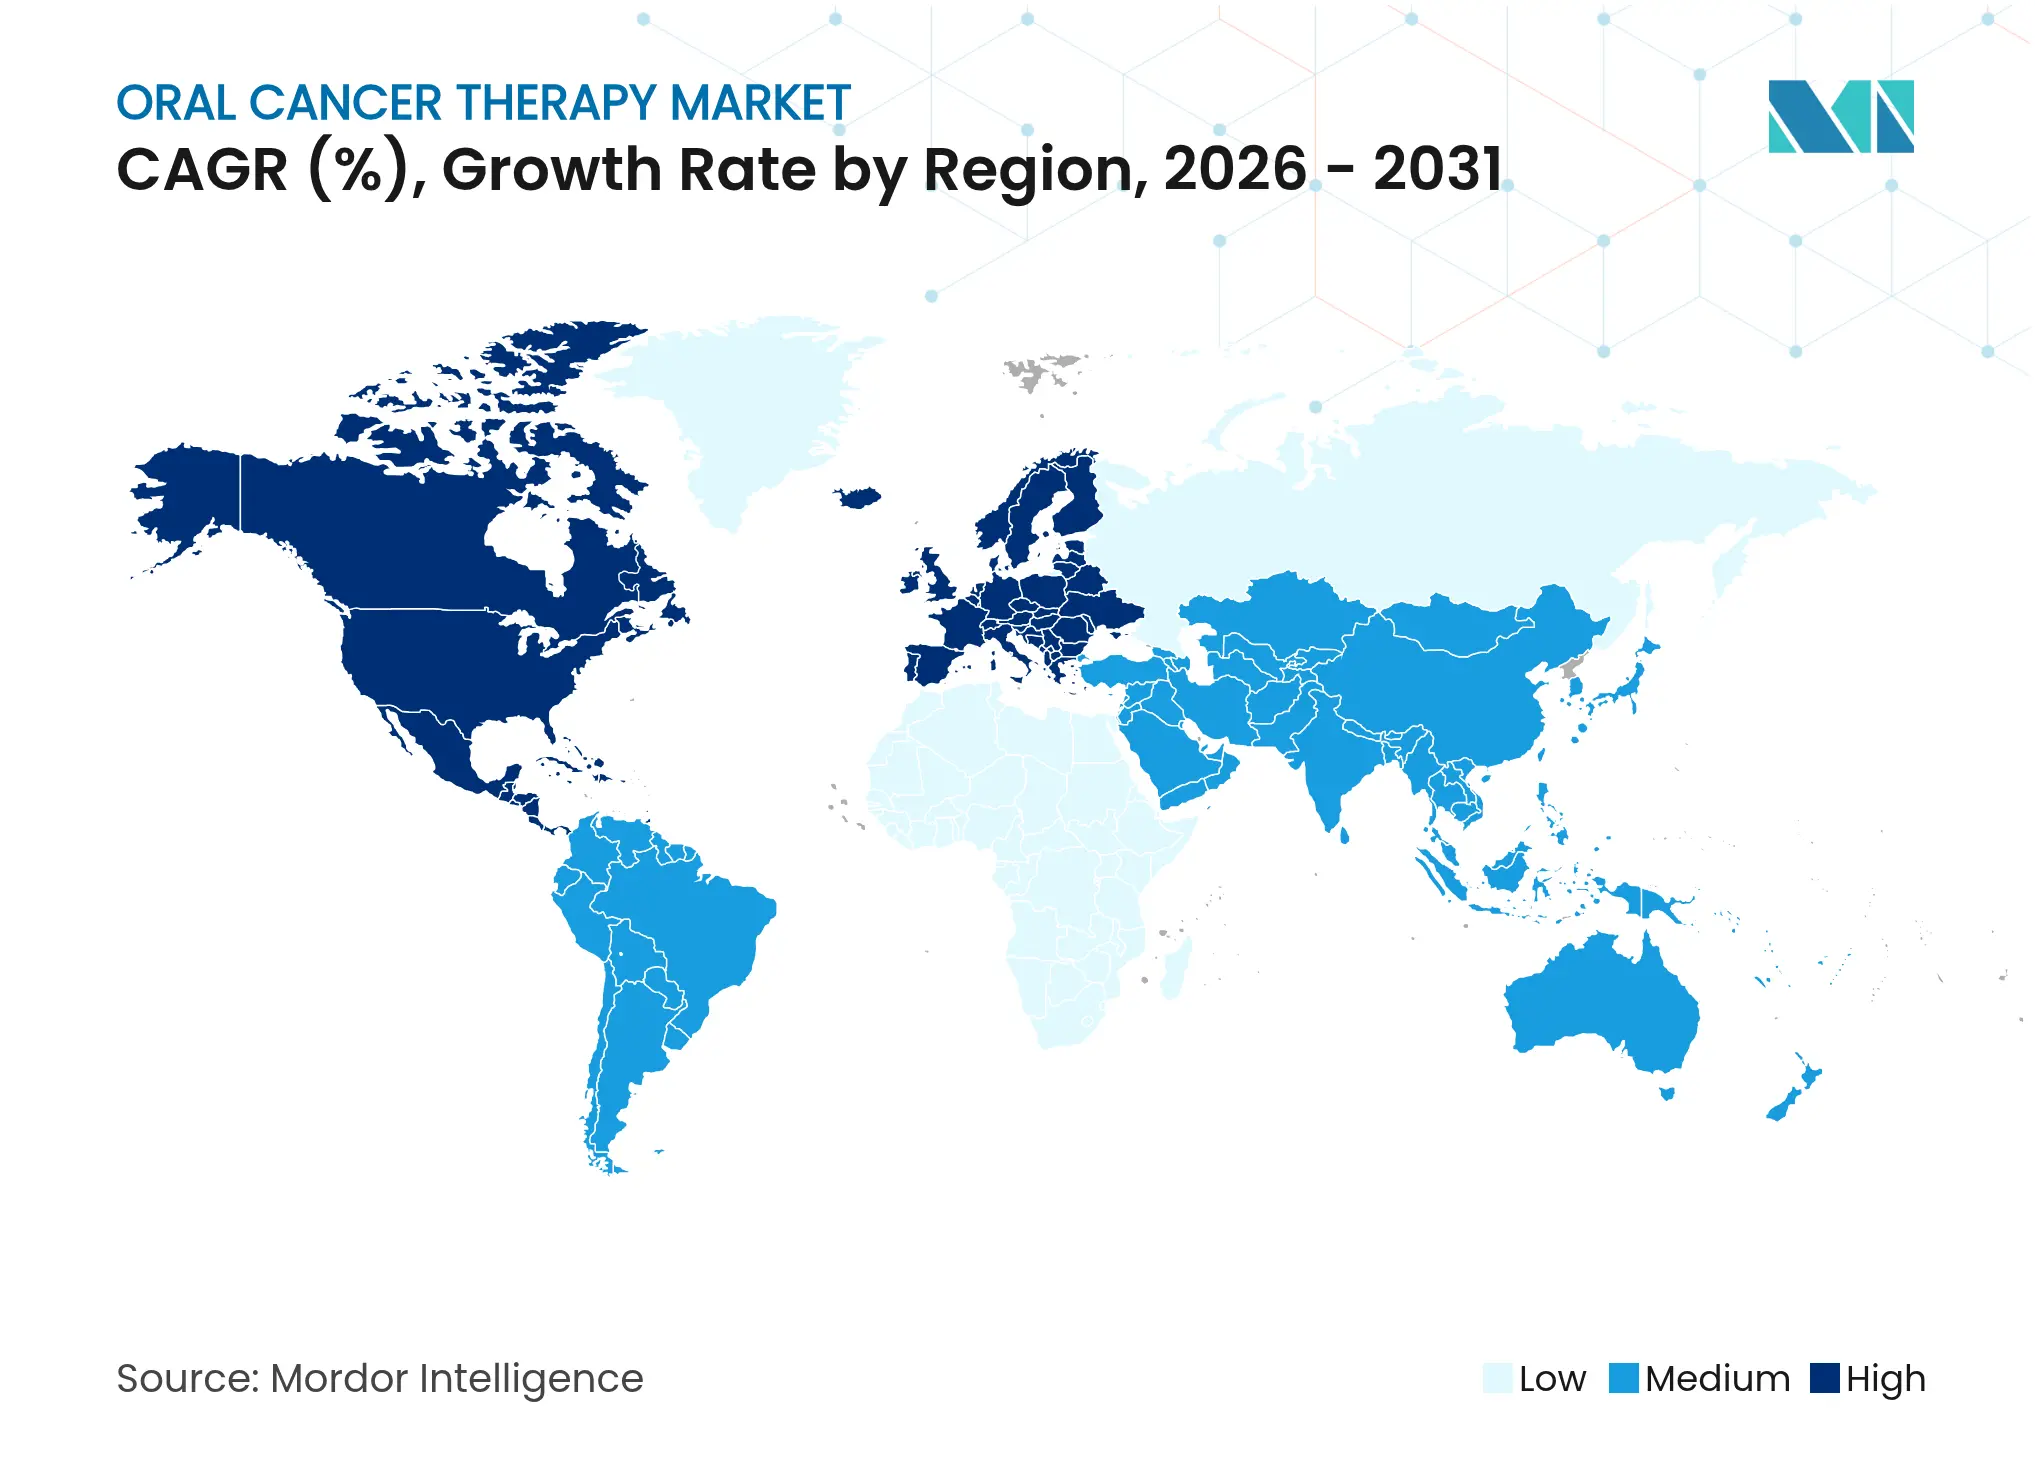
| Fastest Growing Market | Asia Pacific |
| Largest Market | North America |
| Market Concentration | Low |
Major Players *Disclaimer: Major Players sorted in no particular order. Image © Mordor Intelligence. Reuse requires attribution under CC BY 4.0. |
Oral Cancer Therapy Market Analysis by Mordor Intelligence
The oral cancer therapy market size is expected to grow from USD 2.16 billion in 2025 to USD 2.27 billion in 2026 and is forecast to reach USD 2.91 billion by 2031 at 5.07% CAGR over 2026-2031. Growth stems from a sharp rise in HPV-positive oropharyngeal cancers, expanded checkpoint-inhibitor approvals, and the spread of AI-driven diagnostics in dental clinics. A clear pivot toward precision immunotherapy is under way after the June 2025 perioperative approval of pembrolizumab, the first major head-and-neck advance in more than 20 years. Biologics and targeted small molecules are displacing legacy cytotoxics as biomarker testing becomes routine in treatment planning. Digital dispensing channels, especially online pharmacies, widen patient access and pressure incumbents to modernize distribution strategies.
Key Report Takeaways
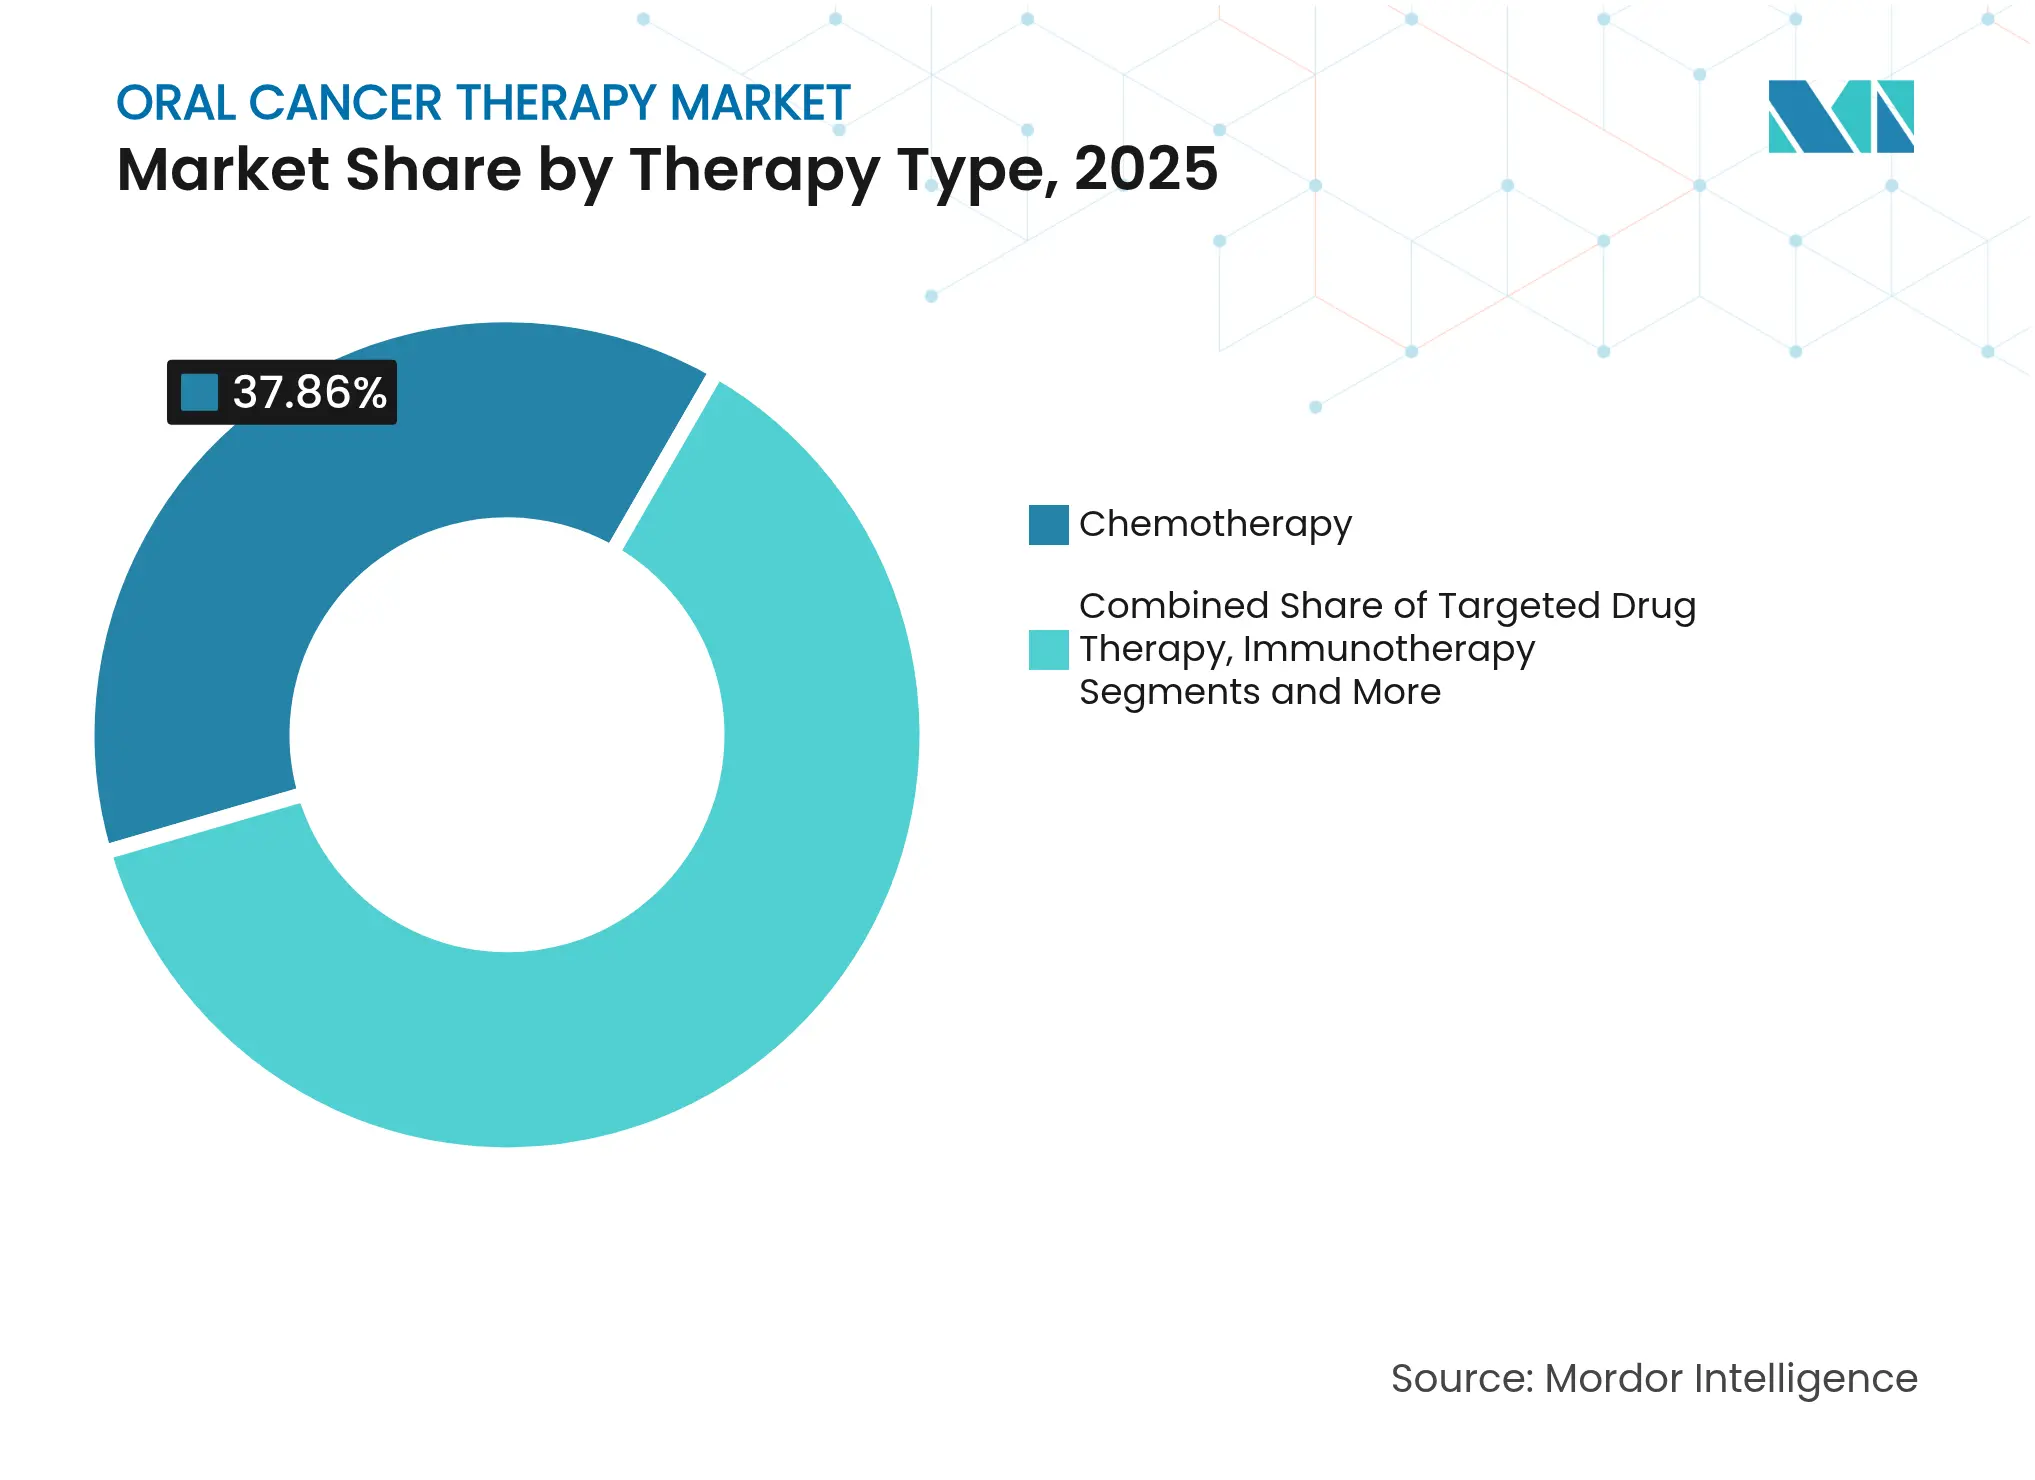
- By therapy type, chemotherapy led with 37.86% revenue share in 2025, while targeted therapy is projected to expand at a 5.9% CAGR to 2031.
- By administration route, injectable medicines held 61.12% of the oral cancer therapy market share in 2025; oral formulations post the fastest 5.61% CAGR through 2031.
- By end-user, hospitals commanded 47.68% share of the oral cancer therapy market size in 2025, whereas cancer centers deliver a 5.55% CAGR through 2031.
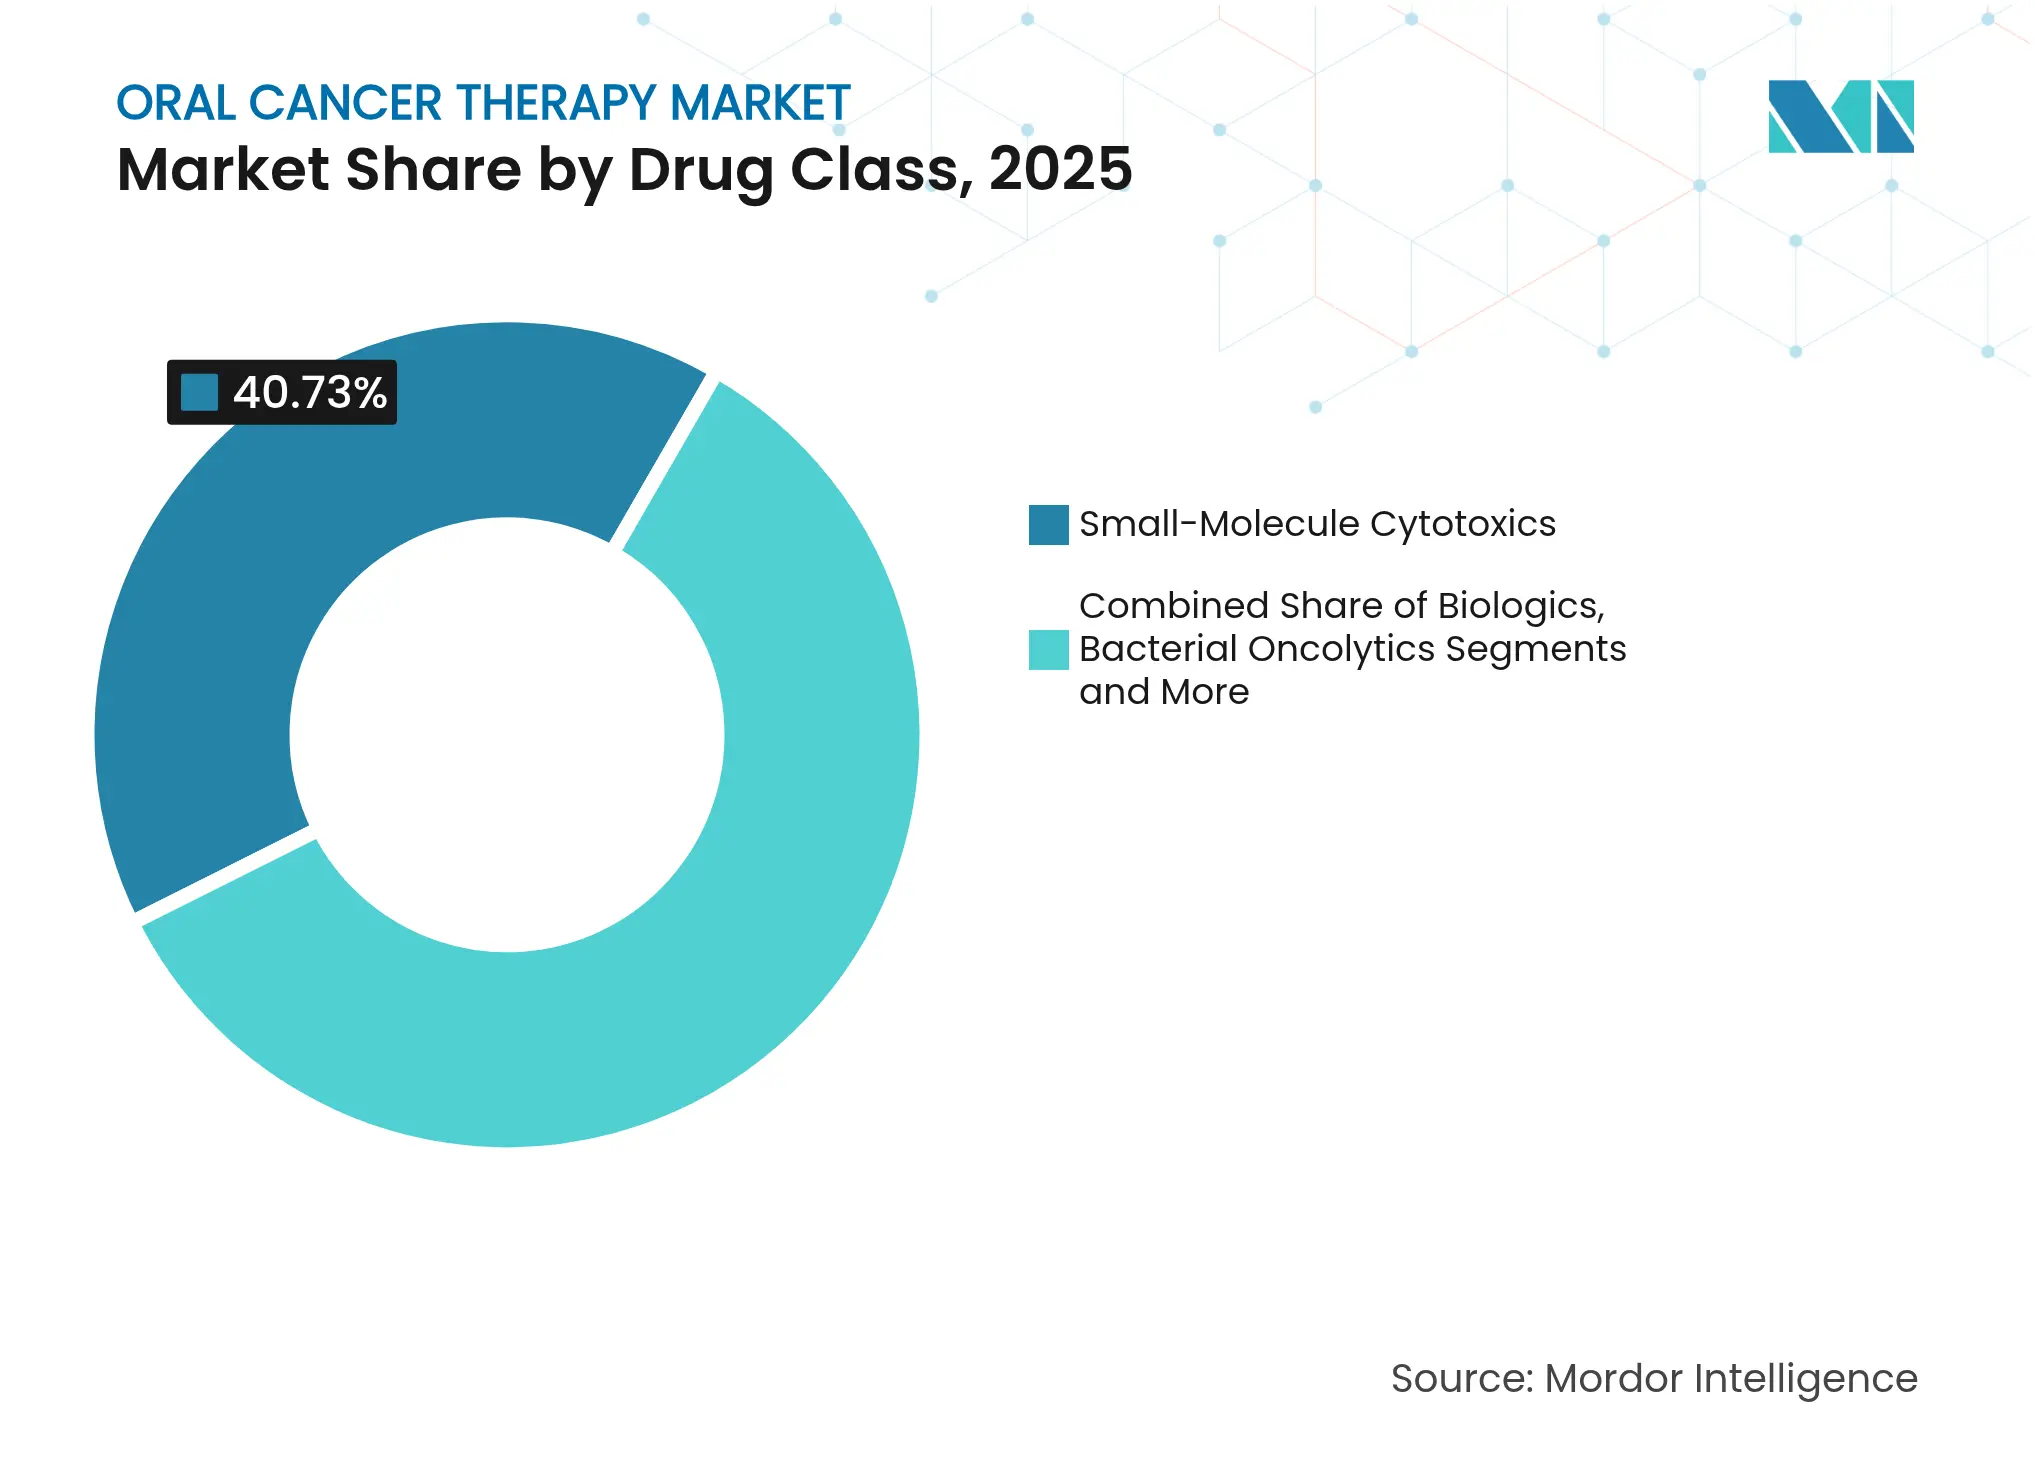
- By drug class, small-molecule cytotoxics captured 40.73% of oral cancer therapy market size in 2025, yet biologics grow at a 6.01% CAGR through 2031.
- By geography, North America contributed 42.15% market share in 2025; Asia-Pacific accelerates at a 6.27% CAGR to 2031.
Note: Market size and forecast figures in this report are generated using Mordor Intelligence's proprietary estimation framework, updated with the latest available data and insights as of 2026.
Global Oral Cancer Therapy Market Trends and Insights
Drivers Impact Analysis
| Driver | (~) % Impact on CAGR Forecast | Geographic Relevance | Impact Timeline | |||
|---|---|---|---|---|---|---|
Rise In HPV-Positive Oropharyngeal Cancer Prevalence
Rise In HPV-Positive Oropharyngeal Cancer Prevalence
| +0.8% | Global, with concentration in North America & Europe | Medium term (2-4 years) |
(~) % Impact on CAGR Forecast
:
+0.8%
|
Geographic Relevance
:
Global, with concentration in North America & Europe
|
Impact Timeline
:
Medium term (2-4 years)
|
Expanding Approvals Of Checkpoint Inhibitors &
Targeted Therapies
Expanding Approvals Of Checkpoint Inhibitors &
Targeted Therapies
| +1.2% | Global, led by North America, expanding to APAC | Short term (≤ 2 years) | |||
Growing Adoption Of Precision-Medicine Diagnostics
Growing Adoption Of Precision-Medicine Diagnostics
| +0.6% | North America & EU, spill-over to APAC | Medium term (2-4 years) | |||
Growing Oncology Spend & Screening In Emerging Markets
Growing Oncology Spend & Screening In Emerging Markets
| +0.9% | APAC core, spill-over to MEA | Long term (≥ 4 years) | |||
Breakthroughs In Oral-Microbiome Engineered Therapeutics
Breakthroughs In Oral-Microbiome Engineered Therapeutics
| +0.4% | Global, early adoption in North America | Long term (≥ 4 years) | |||
AI-Driven Early Lesion Detection Adoption In Dental
Clinics
AI-Driven Early Lesion Detection Adoption In Dental
Clinics
| +0.5% | North America & EU, expanding globally | Medium term (2-4 years) | |||
| Source: Mordor Intelligence | ||||||
Rise In HPV-Positive Oropharyngeal Cancer Prevalence
HPV-positive oropharyngeal cancer continues to climb, reshaping clinical practice because these tumors respond more effectively to radiation and immunotherapy than HPV-negative disease [1]PubMed, “HPV-Positive Oropharyngeal Cancer Epidemiology,” pubmed.ncbi.nlm.nih.gov. The epidemiology prompts interest in de-escalated radiation that lowers toxicity while maintaining outcomes. Pembrolizumab shows heightened activity in HPV-positive cases, reinforcing biomarker-guided regimens. Universal HPV testing now recommended by NCCN segments patients more precisely and accelerates uptake of companion diagnostics. The trend ultimately boosts demand for targeted drugs and supporting molecular tests.
Expanding Approvals Of Checkpoint Inhibitors & Targeted Therapies
The US-FDA cleared perioperative pembrolizumab for head-and-neck cancer in June 2025 after KEYNOTE-689 doubled median event-free survival versus standard care. Penpulimab-kcqx gained approval for nasopharyngeal carcinoma in April 2025, enlarging the PD-(L)1 class. Breakthrough therapy designations for combinations such as petosemtamab plus pembrolizumab signal further near-term label expansions. Tissue-agnostic pathways endorsed by new FDA guidance allow drug makers to pursue biomarker-defined populations across tumor sites, broadening commercial reach.
Growing Adoption Of Precision-Medicine Diagnostics That Match Patients To Targeted/Immune Therapies
PD-L1 scoring, tumor mutational burden, and MSI status testing are now standard in many centers, aligning patients with the therapies most likely to work. AI analytics achieve 93% accuracy and 91% sensitivity in oral cancer detection, reducing the time to accurate diagnosis. Liquid biopsies give real-time feedback on resistance, allowing earlier therapy adjustments.
Growing Oncology Spend & Screening In Emerging Markets
Asian governments ramp oncology budgets and deploy national screening programs, especially in India and China where oral cancer incidence is high. India’s home-grown CAR-T platforms cut treatment costs, helping close access gaps. Mobile health and tele-oncology projects extend specialist reach to rural areas, improving early detection and therapy uptake.
Breakthroughs In Oral-Microbiome Engineered Therapeutics
Engineered oral bacteria can deliver anticancer payloads directly to lesions, modulate immunity, and may cut systemic toxicity. Trials now evaluate probiotic and prebiotic regimens that restore microbial balance and heighten immunotherapy response.
AI-Driven Early Lesion Detection Adoption In Dental Clinics
Validation studies show AI-supported imaging tools in dental offices detect suspicious lesions with up to 100% accuracy, enabling same-visit referrals. Products like BeVigilant OraFusion earned FDA Breakthrough status, underscoring regulatory interest in front-line screening.
Restraint Impact Analysis
| Restraint | (~) % Impact on CAGR Forecast | Geographic Relevance | Impact Timeline | |||
|---|---|---|---|---|---|---|
High Cost Of Immunotherapies & Biologics
High Cost Of Immunotherapies & Biologics
| -1.1% | Global, most acute in emerging markets | Short term (≤ 2 years) |
(~) % Impact on CAGR Forecast
:
-1.1%
|
Geographic Relevance
:
Global, most acute in emerging markets
|
Impact Timeline
:
Short term (≤ 2 years)
|
Severe Treatment-Induced Toxicities
Severe Treatment-Induced Toxicities
| -0.7% | Global | Medium term (2-4 years) | |||
Stringent And Varying Regulatory Pathways
Stringent And Varying Regulatory Pathways
| -0.5% | Global, varying by region | Medium term (2-4 years) | |||
Limited Cold-Chain For Cell & Gene Therapies In
Low-Income Regions
Limited Cold-Chain For Cell & Gene Therapies In
Low-Income Regions
| -0.4% | Low-income regions globally | Long term (≥ 4 years) | |||
| Source: Mordor Intelligence | ||||||
High Cost Of Immunotherapies & Biologics
Many checkpoint inhibitors cost more than USD 100,000 per patient per year, challenging payers and limiting uptake outside wealthy health systems. Pembrolizumab’s incremental cost-effectiveness ratio exceeds accepted thresholds, prompting value-based contracts and managed‐entry agreements[2]European Journal of Oncology Pharmacy, “Pembrolizumab ICER Analysis,” ejop.eu. Biosimilars could moderate prices, but complex manufacturing slows competitive entry.
Severe Treatment-Induced Toxicities
Oral mucositis affects up to 90% of chemotherapy recipients, driving unplanned admissions and possible dose delays [3]Cancers Journal, “Oral Mucositis in Chemotherapy,” cancersjournal.org . Immunotherapy can trigger chronic oral adverse events, and radiation adds further morbidity. New supportive interventions such as antimicrobial photodynamic therapy aim to mitigate these toxicities.
Segment Analysis
By Therapy Type: Targeted Therapy Drives Innovation
Chemotherapy held 37.86% of the oral cancer therapy market share in 2025, reflecting entrenched clinical protocols. Targeted therapy is projected to rise at a 5.9% CAGR to 2031, signalling clinician preference for biomarker-guided approaches. The oral cancer therapy market size for immunotherapy is set to climb in lockstep with fresh perioperative and metastatic approvals. Combination regimens pairing checkpoint inhibitors with kinase inhibitors or radiation feature prominently in trial pipelines. Cytotoxic use persists but shifts toward combination backbones rather than standalone regimens. Cell and gene therapies, including ErbB- and MUC1-directed CAR-T programs, hold long-term disruptive potential.
Second-generation antibodies, antibody-drug conjugates, and bispecific formats underpin the speed of targeted segment gains. Clinicians increasingly stratify treatment on PD-L1 level, HPV status, and genomic signatures, ensuring optimal drug-patient matches. Precision positioning limits overtreatment, improves toxicity profiles, and heightens pay-for-value scrutiny.
Note: Segment shares of all individual segments available upon report purchase
By Administration Type: Oral Formulations Gain Momentum
Injectables represented 61.12% of revenue in 2025 due to the prevalence of monoclonal antibodies. Nonetheless, oral agents advance at a 5.61% CAGR through 2031 as companies formulate small-molecule PD-(L)1 inhibitors and employ prodrug designs to boost oral bioavailability. Oral regimens facilitate outpatient care, reduce infusion chair use, and improve adherence. The oral cancer therapy market size for oral formulations is forecast to benefit once first-in-class orally delivered checkpoint inhibitors clear late-phase trials.
Topical or trans-mucosal formats for early lesions could minimize systemic toxicity. Patient preference data consistently place convenience high on the decision tree, further reinforcing the trend toward self-administered therapies.
By End-User: Cancer Centers Accelerate Growth
Hospitals accounted for 47.68% of 2025 spending, a testament to their comprehensive surgical and radiation capabilities. Cancer centers, though smaller in absolute terms, hold the fastest 5.55% CAGR as precision care consolidates into high-volume hubs. Coordinate-care models, advanced molecular labs, and ready access to clinical trials drive referral inflows. Tele-oncology extends expert reach beyond metro areas, bringing sophisticated care into community settings.
Ambulatory centers and specialty clinics add capacity for less intensive regimens, supporting decentralized care pathways. Insurance networks in mature markets favor these lower-cost settings, amplifying their share over the forecast window.

Recognized by Experts. Trusted by Leaders.
A trusted intelligence partner to global decision-makers across 90+ countries.


By Drug Class: Biologics Transform Treatment Landscape
Small molecules still hold 40.73% market share, yet biologics expand 6.01% annually, fueled by rising checkpoint-inhibitor revenue and new antibody-drug conjugate launches. The oral cancer therapy market size for biologics accelerates as perioperative immunotherapy becomes mainstream. Viral and bacterial oncolytics as well as cell-modifying platforms spark long-term innovation, offering unique mechanisms that bypass traditional resistance pathways.
Bispecific antibodies that bridge tumor and immune cells demonstrate potent activity in early trials. Drug developers increasingly combine biologics with radiotherapy, chemotherapy, or other immune effectors to counter adaptive resistance.
Note: Segment shares of all individual segments available upon report purchase
By Distribution Channel: Online Pharmacies Disrupt Traditional Models
Hospital pharmacies continue to dominate with 55.89% share thanks to cold-chain handling of high-value biologics. Online pharmacies, however, post a 6.06% CAGR, bringing specialty drug fulfilment into direct-to-patient models. Integration with tele-oncology platforms enhances adherence tracking and side-effect monitoring. Retail pharmacy chains build specialty units to stay competitive, offering nurse-hotlines and financial navigation.
Medically integrated dispensing models inside oncology practices streamline therapy initiation and improve data capture for value-based agreements. Stronger regulations on internet pharmacy operations will be critical to ensure safety and counter counterfeit risks.
Geography Analysis
North America contributed 42.15% to 2025 revenue, supported by large insured populations, rapid FDA approvals, and an expansive clinical-trial ecosystem. Pembrolizumab’s 2025 perioperative clearance underscores the region’s role as the first market for innovative regimens. The United States accounts for the bulk of sales, while Canada and Mexico gain from cross-border collaboration and gradually improving reimbursement schemes.
Asia-Pacific registers the highest 6.27% CAGR to 2031, propelled by rising disposable income, government health spending, and high oral-cancer incidence. China scales domestic production of biologics and cell therapies that trim costs. India’s frugal CAR-T programs illustrate the region’s capacity to innovate around affordability. Strengthening screening programs, particularly in Taiwan and Thailand, support earlier diagnosis and subsequent therapy demand.
Europe retains major weight owing to universal healthcare, but stringent price negotiations moderate revenue upside. Health-technology assessment agencies demand compelling cost-effectiveness, pushing drug makers toward innovative contracting. Germany and France host key manufacturing sites and high-throughput trial networks, while post-Brexit UK charts its own regulatory course but stays a leading research hub.

Competitive Landscape
Market Concentration
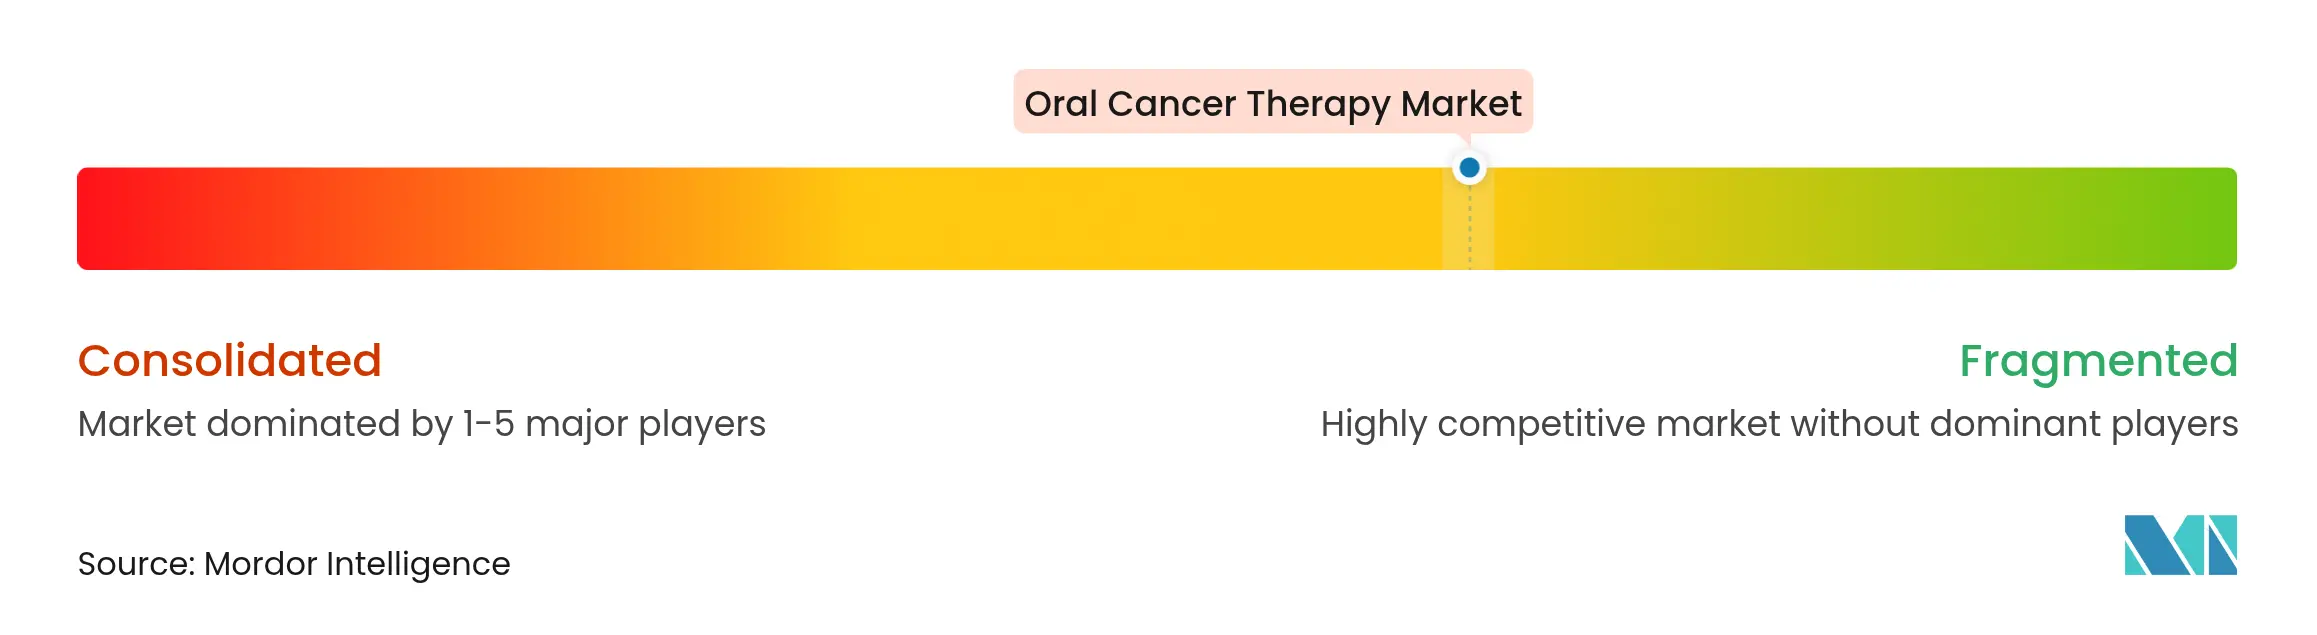
The oral cancer therapy market is moderately fragmented. Leaders such as Bristol Myers Squibb, Merck, and Roche dominate checkpoint-inhibitor sales and leverage scale to run broad perioperative and metastatic programs.
Partnerships remain a core growth lever, as shown by Bristol Myers Squibb’s USD 11.1 billion bispecific alliance with BioNTech. Roche’s acquisition of Poseida adds cell-therapy breadth, while Eli Lilly pursues radioligand deals.
Emerging firms focus on solid-tumor-directed CAR-T constructs, AI-enabled diagnostics, and microbiome-engineered therapeutics. Competitive intensity now hinges on clinical-data differentiation, speed to market-access agreements, and ability to meet cold-chain or digital-health infrastructure demands. Companies showing robust combination-therapy pipelines and diagnostics integration stand to gain share as precision treatment norms solidify.
Oral Cancer Therapy Industry Leaders

*Disclaimer: Major Players sorted in no particular order
Recent Industry Developments
- January 2024: Merck reported Gebasaxturev entered Phase II trials for oral cavity cancer.
- December 2023: Bristol Myers Squibb presented data showing improved outcomes with OPDIVO regimens in earlier oral-cancer stages.
- January 2023: Alkermes received an MHRA innovation passport for nemvaleukin alfa in mucosal melanoma.
Table of Contents for Oral Cancer Therapy Industry Report
1. Introduction
- 1.1Study Assumptions & Market Definition
- 1.2Scope of the Study
2. Research Methodology
3. Executive Summary
4. Market Landscape
- 4.1Market Overview
- 4.2Market Drivers
- 4.2.1Rise In Hpv-Positive Oropharyngeal Cancer Prevalence
- 4.2.2Expanding Approvals Of Checkpoint Inhibitors & Targeted Therapies
- 4.2.3Growing Adoption Of Precision-Medicine Diagnostics That Match Patients To Targeted/Immune Therapies
- 4.2.4Growing Oncology Spend & Screening In Emerging Markets
- 4.2.5Breakthroughs In Oral-Microbiome Engineered Therapeutics
- 4.2.6Ai-Driven Early Lesion Detection Adoption In Dental Clinics
- 4.3Market Restraints
- 4.3.1High Cost Of Immunotherapies & Biologics
- 4.3.2Severe Treatment-Induced Toxicities
- 4.3.3Stringent And Varying Regulatory Pathways
- 4.3.4Limited Cold-Chain For Cell & Gene Therapies In Low-Income Regions
- 4.4Value / Supply-Chain Analysis
- 4.5Regulatory Landscape
- 4.6Technological Outlook
- 4.7Porter’s Five Forces Analysis
- 4.7.1Bargaining Power of Suppliers
- 4.7.2Bargaining Power of Buyers/Consumers
- 4.7.3Threat of New Entrants
- 4.7.4Threat of Substitute Products
- 4.7.5Intensity of Competitive Rivalry
- 4.8Epidemiology Trends Analysis
- 4.9Patient Journey & Unmet Needs
5. Market Size & Growth Forecasts
- 5.1By Therapy Type
- 5.1.1Chemotherapy
- 5.1.2Targeted Drug Therapy
- 5.1.3Radiation Therapy
- 5.1.4Immunotherapy
- 5.1.5Cell & Gene Therapy
- 5.1.6Other Therapy Types
- 5.2By Administration Type
- 5.2.1Oral
- 5.2.2Injectable
- 5.2.3Topical / Trans-mucosal
- 5.2.4Other Administration Types
- 5.3By End-User
- 5.3.1Hospitals
- 5.3.2Cancer Centres
- 5.3.3Others
- 5.4By Drug Class
- 5.4.1Small-Molecule Cytotoxics
- 5.4.2Biologics (mAbs, ADCs)
- 5.4.3Viral & Bacterial Oncolytics
- 5.4.4Cell & Gene-Modifying Therapies
- 5.5By Distribution Channel
- 5.5.1Hospital Pharmacies
- 5.5.2Retail Pharmacies & Drug Stores
- 5.5.3Online Pharmacies
- 5.6By Geography
- 5.6.1North America
- 5.6.1.1United States
- 5.6.1.2Canada
- 5.6.1.3Mexico
- 5.6.2Europe
- 5.6.2.1Germany
- 5.6.2.2United Kingdom
- 5.6.2.3France
- 5.6.2.4Italy
- 5.6.2.5Spain
- 5.6.2.6Rest of Europe
- 5.6.3Asia-Pacific
- 5.6.3.1China
- 5.6.3.2Japan
- 5.6.3.3India
- 5.6.3.4Australia
- 5.6.3.5South Korea
- 5.6.3.6Rest of Asia-Pacific
- 5.6.4Middle East & Africa
- 5.6.4.1GCC
- 5.6.4.2South Africa
- 5.6.4.3Rest of Middle East & Africa
- 5.6.5South America
- 5.6.5.1Brazil
- 5.6.5.2Argentina
- 5.6.5.3Rest of South America
6. Competitive Landscape
- 6.1Market Concentration
- 6.2Market Share Analysis
- 6.3Company Profiles (includes Global level Overview, Market level overview, Core Segments, Financials as available, Strategic Information, Market Rank/Share for key companies, Products & Services, and Recent Developments)
- 6.3.1Bristol-Myers Squibb
- 6.3.2Merck & Co., Inc.
- 6.3.3Eli Lilly and Company
- 6.3.4F. Hoffmann-La Roche Ltd
- 6.3.5Pfizer Inc.
- 6.3.6Novartis AG
- 6.3.7GSK plc
- 6.3.8Takeda Pharmaceutical Co.
- 6.3.9Sanofi
- 6.3.10AstraZeneca plc
- 6.3.11Amgen Inc.
- 6.3.12Johnson & Johnson (Janssen)
- 6.3.13Daiichi Sankyo Co.
- 6.3.14Rakuten Medical Inc.
- 6.3.15Immutep Ltd.
- 6.3.16Bayer AG
- 6.3.17Astellas Pharma Inc.
- 6.3.18Regeneron Pharmaceuticals
7. Market Opportunities & Future Outlook
- 7.1White-space & Unmet-Need Assessment
Global Oral Cancer Therapy Market Report Scope
As per the scope of the report, oral cancer is a broad term for cancer that affects the mouth. There are various types of oral cancer, like lymphoma, mucosal melanoma, sarcomas, and others. The oral cancer market is segmented by therapy type (chemotherapy, targeted drug therapy, immunotherapy, radiation therapy, and other types), end-users (hospitals, cancer centers, research organizations, and other end-users), administration type (oral, injectable, and other administration types), and geography (North America, Europe, Asia-Pacific, the Middle East and Africa, and South America). The market report also covers the estimated market sizes and trends for 17 different countries across major regions globally.
The report offers the value (in USD) for the above segments.