Fiber Optic Test Equipment (FOTE) Market Size and Share
Market Overview
| Study Period | 2020 - 2031 |
|---|---|
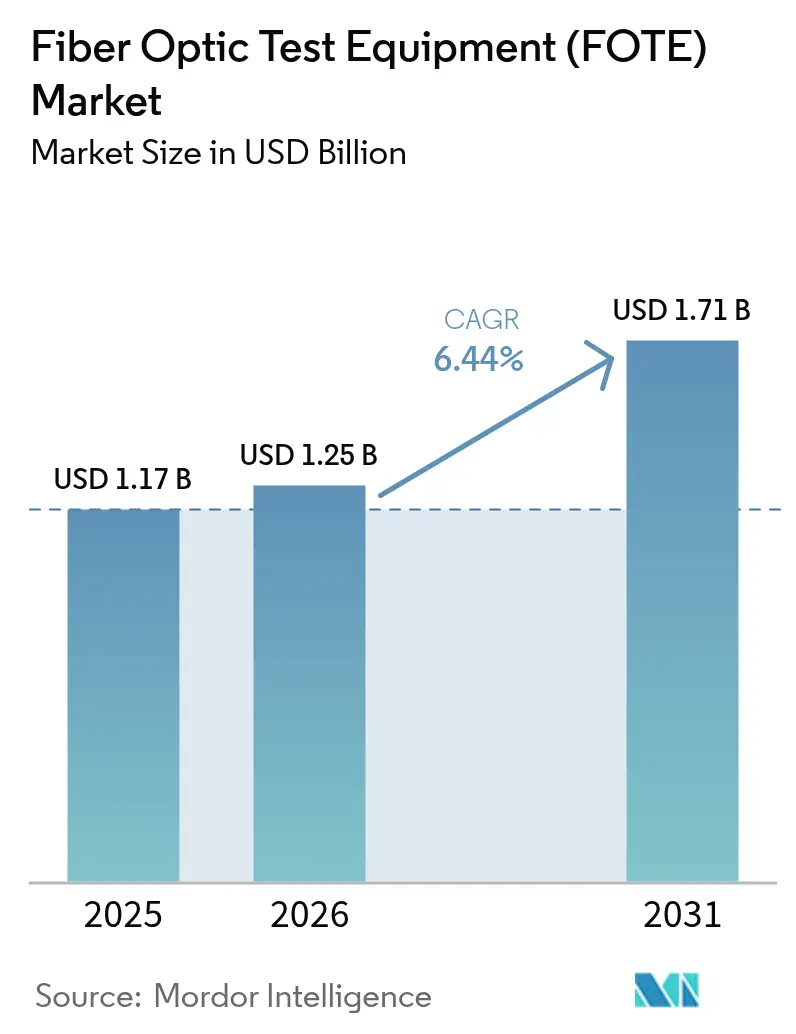
| Market Size (2026) | USD 1.25 Billion |
| Market Size (2031) | USD 1.71 Billion |
| Growth Rate (2026 - 2031) | 6.44% CAGR |
| Fastest Growing Market | Asia Pacific |
| Largest Market | Asia Pacific |
| Market Concentration | Low |
Major Players *Disclaimer: Major Players sorted in no particular order Image © Mordor Intelligence. Reuse requires attribution under CC BY 4.0. | |
Fiber Optic Test Equipment (FOTE) Market Analysis by Mordor Intelligence
The Fiber Optic Test Equipment Market size was valued at USD 1.17 billion in 2025 and estimated to grow from USD 1.25 billion in 2026 to reach USD 1.71 billion by 2031, at a CAGR of 6.44% during the forecast period (2026-2031).
Rising capital outlays for 5G fronthaul, hyperscale data-center upgrades to 800 G coherent optics, and government-funded rural broadband programs collectively expand the addressable base for test instrumentation. Vendors are shifting product roadmaps toward AI-ready platforms that shorten troubleshooting cycles and feed telemetry directly into network-orchestration software, a capability prized by operators running fiber-dense architectures. Remote fiber test systems see accelerating adoption as utilities, defense agencies, and smart-city integrators demand continuous monitoring of mission-critical links. Meanwhile, export-control scrutiny on advanced photonic components and a global shortage of certified fiber technicians curb near-term uptake but do not derail the longer growth trajectory as leasing and managed-test services partly bridge the investment gap. Emerging dual-use cases such as distributed acoustic sensing for both security and power-grid monitoring—further widen the market’s sector reach.
Key Report Takeaways
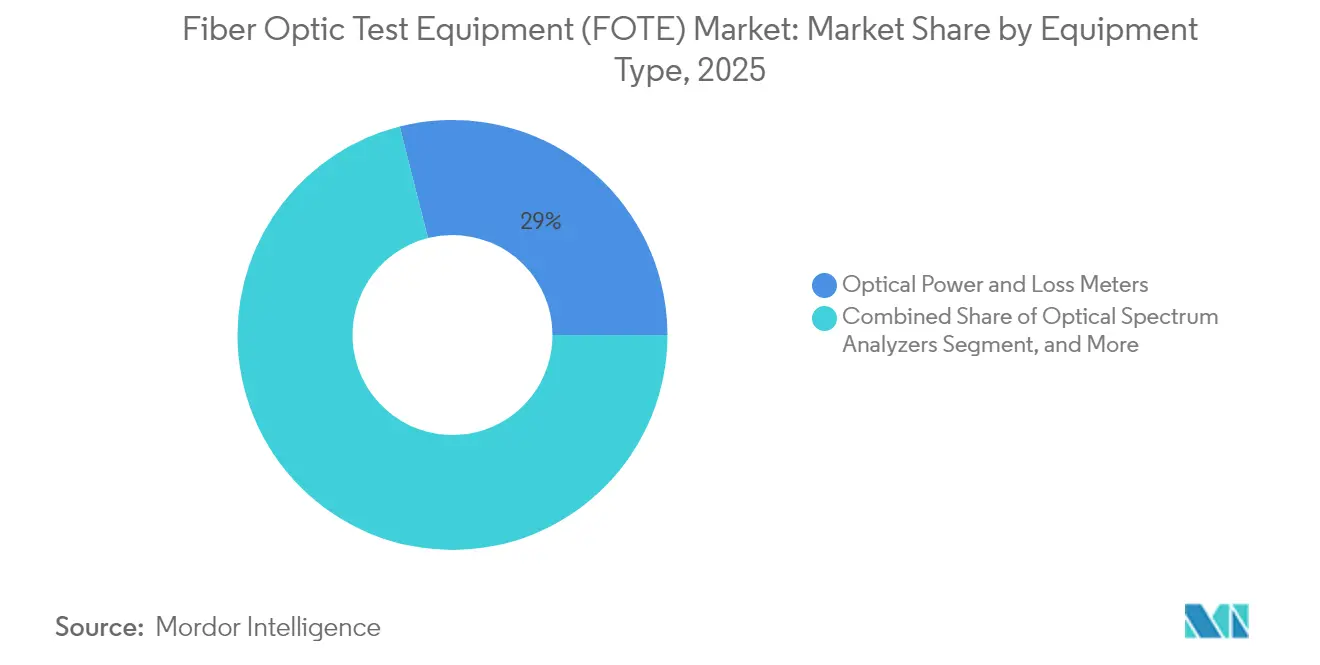
- By equipment type, optical power and loss meters led with 28.95% of fiber optic test equipment market share in 2025; remote fiber test systems are on course for the fastest 7.98% CAGR through 2031.
- By form factor, hand-held devices accounted for 51.45% of the fiber optic test equipment market size in 2025, while rack/module-based systems post the highest 7.62% CAGR through 2031.
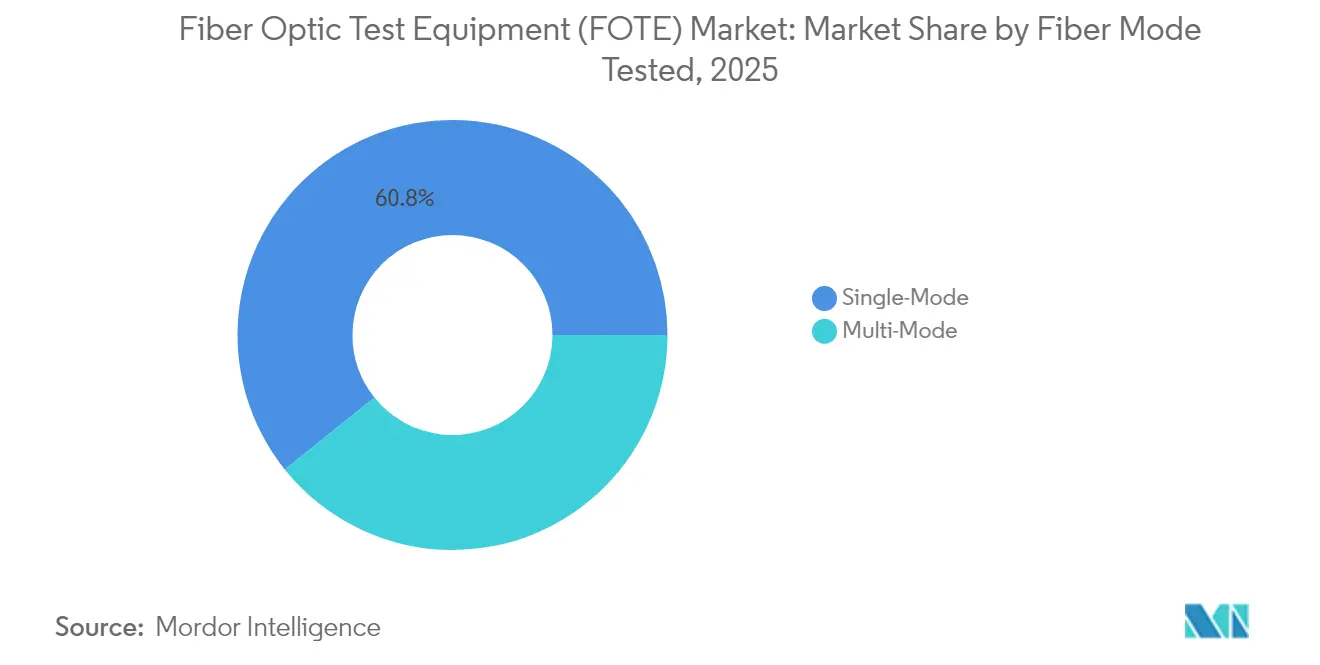
- By fiber mode, single-mode testing dominated with 60.75% share in 2025, whereas multimode testing is projected to advance at a 6.66% CAGR up to 2031.
- By end-user, telecommunications service providers captured 34.40% share of the fiber optic test equipment market size in 2025; energy and utilities deliver the quickest 6.97% CAGR to 2031.
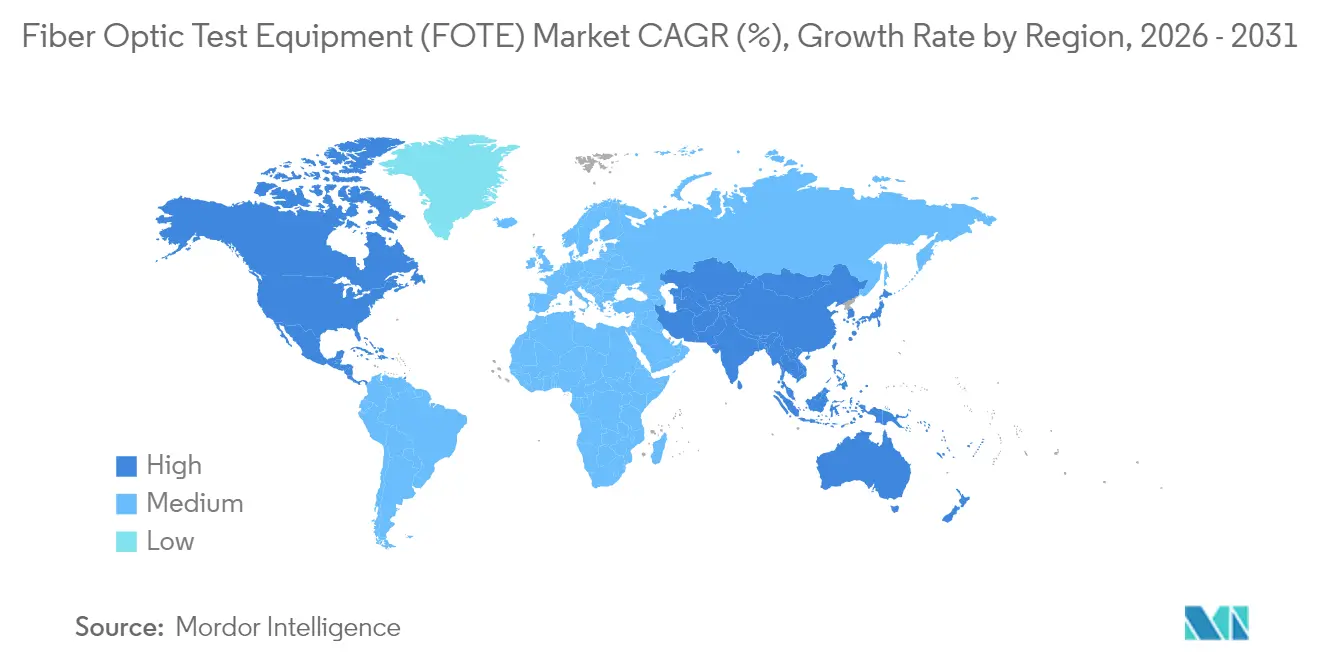
- By geography, Asia-Pacific retained a 38.20% fiber optic test equipment market share in 2025, but Middle East & Africa enjoys the briskest 7.88% CAGR through 2031.
Note: Market size and forecast figures in this report are generated using Mordor Intelligence’s proprietary estimation framework, updated with the latest available data and insights as of 2026.
Global Fiber Optic Test Equipment (FOTE) Market Trends and Insights
Drivers Impact Analysis*
| Driver | ( ~) % Impact on CAGR Forecast | Geographic Relevance | Impact Timeline |
|---|---|---|---|
| Proliferation of 5G fronthaul and backhaul fiber deployment | +1.8% | Global, with APAC and North America leading | Medium term (2-4 years) |
| Explosion of FTTH/B roll-outs in emerging economies | +1.5% | APAC core, spill-over to MEA and South America | Long term (≥ 4 years) |
| Government stimulus for rural broadband and power grid digitalization | +1.2% | North America and EU, selective APAC markets | Medium term (2-4 years) |
| Shift to PAM4 and 800G optics in hyperscale data centers | +0.9% | Global, concentrated in major cloud regions | Short term (≤ 2 years) |
| Defense adoption of tactical ruggedized fiber links | +0.6% | North America, EU, selective defense markets | Long term (≥ 4 years) |
| Growing need for automated, AI-driven remote fiber test systems | +0.8% | Global, early adoption in developed markets | Medium term (2-4 years) |
| Source: Mordor Intelligence | |||


Proliferation of 5G Fronthaul and Backhaul Fiber Deployment
Each standalone 5G macro or small cell multiplies fiber strands tenfold compared with 4G, triggering unprecedented demand for coherent OTDR platforms that validate sub-10 ms latency, high-order modulation integrity, and DWDM channel spacing. [1]Saudi Telecom Company, “2024 Annual Report,” stc.com.saSaudi Telecom Company added 8,035 dedicated fiber backhaul routes for 5G in 2024, illustrating the infrastructure intensity now routine among Tier-1 operators. Dense urban builds face frequent civil-works disruptions, making automated fault-localization and real-time reflectometry indispensable for service-level compliance. Equipment vendors answer with dual-port designs that support simultaneous upstream and downstream testing, reducing truck rolls and accelerating mean-time-to-repair. The push toward 5.5G and even 6 GHz spectrum refarming sustains the need for higher-bandwidth fiber, thereby underpinning test-instrument replacement cycles across operator footprints.
Explosion of FTTH/B Roll-outs in Emerging Economies
Public-sector digital-inclusion targets are fueling multi-country FTTH extensions well beyond primary metros. Nigeria’s roadmap to stretch backbone fiber from 35,000 km to 125,000 km underscores the scale, demanding lightweight, battery-efficient meters technicians can operate after minimal training. Enrollment in BICSI’s Installer 2—Optical Fiber curriculum has surged, reflecting how certification uptake directly boosts procurement of compatible test gear.[2]BICSI, “Installer 2—Optical Fiber Certification Growth,” bicsi.org Local-content mandates in Gulf Cooperation Council economies reward regional assembly partnerships that keep device lead times short and service logistics local. As fiber footprints permeate suburban and rural clusters, optical loss and automated end-face inspection become mandatory to meet contractual KPIs tied to government subsidies.
Government Stimulus for Rural Broadband and Power-Grid Digitalization
The USD 42.45 billion BEAD program in the United States ties grant eligibility to stringent performance verification, elevating demand for ruggedized instruments that endure extreme temperatures and long-haul attenuation spans. [3]Phoenix Communications Inc., “Distributed Acoustic Sensing for Power Infrastructure,” phoenixcomm.com Utilities layering distributed acoustic sensing on dark fiber concurrently purchase high-dynamic-range OTDRs able to detect subtle strain variations along power corridors. Vendor roadmaps increasingly meld telecom and utility test requirements into hybrid platforms that certify optical performance and process vibration data for grid-health analytics. The resulting cross-sector pull benefits suppliers positioned to meet both broadband and energy-sector specifications without separate product lines.
Shift to PAM4 and 800 G Optics in Hyperscale Data Centers
Cloud operators racing to support AI workloads deploy 800 G coherent lines and PAM4 modulation, forcing lab and rack-based testers to hit picometer wavelength resolution and 70 GHz electrical bandwidth. EXFO’s 2025 release of an AI-enabled validation suite demonstrates vendor adaptation to fiber counts that top 100,000 per campus. Accurate characterization of microring-resonator switch fabrics mandates integrated tunable lasers and low-noise wavemeters, pushing ASPs upward yet saving operators millions in avoided downtime. Machine-readable output compatible with data-center orchestration stacks allows AIOps platforms to trigger remedial workflows without human intervention, cementing the ROI narrative for automated, software-centric testing.
Restraints Impact Analysis*
| Restraint | (~) % Impact on CAGR Forecast | Geographic Relevance | Impact Timeline |
|---|---|---|---|
| High CAPEX for coherent-ready OTDR and OSA platforms | -0.8% | Global, particularly impacting Tier-2/3 operators | Medium term (2-4 years) |
| Shortage of certified fiber technicians in Tier-2/3 cities | -0.6% | Global, acute in emerging markets | Long term (≥ 4 years) |
| Displacement by integrated DSP-based self-test in transceiver modules | -0.4% | Global, concentrated in data center applications | Long term (≥ 4 years) |
| Geo-political export controls on advanced photonic components | -0.5% | China-US trade corridor, selective global markets | Medium term (2-4 years) |
| Source: Mordor Intelligence | |||
High CAPEX for Coherent-Ready OTDR and OSA Platforms
Transitioning to coherent optical systems obliges operators to invest in analyzers containing costly high-speed DSPs and ultra-narrow-linewidth lasers. Smaller carriers often resort to rental pools or managed-test services, elongating procurement cycles for new hardware. The burden is magnified by mandatory calibration routines and advanced user training that compound total cost of ownership. Vendors experiment with subscription models that bundle firmware updates, automated calibration, and AI fault-analytics to lower entry barriers, but price sensitivity among Tier-2/3 players persists until unit volumes rise.
Shortage of Certified Fiber Technicians in Tier-2/3 Cities
Global roll-out timetables clash with an estimated deficit of 205,000 qualified fiber professionals, creating bottlenecks in installation and maintenance schedules. Field teams in secondary cities often lack hands-on exposure to advanced OTDR interpretation, leading to higher revisit rates and extended mean-time-to-repair. BICSI and several OEMs respond with cloud-based training embedded in instruments that deliver guided workflows, yet workforce supply trails demand in fast-growth economies. The talent gap motivates greater interest in hands-free remote-test heads and AI-driven analytics that shift diagnostic tasks from scarce human resources to centralized NOCs.
*Our forecasts treat driver/restraint impacts as directional, not additive. The impact forecasts reflect baseline growth, mix effects, and variable interactions.
Segment Analysis
By Equipment Type: Remote Systems Drive Automation Shift
Remote fiber test systems, though only 16% of shipments, posted an 7.98% CAGR to become the fastest-expanding category. Operators prize their ability to localize faults across thousands of kilometers without dispatching crews, elevating productivity metrics and boosting network availability. Optical power and loss meters nonetheless retained a 28.95% fiber optic test equipment market share in 2025, underscoring their ubiquity during initial installation and periodic certification. EXFO’s OTH-7000 introduced cloud APIs that stream measurement packets into operator OSS suites, a capability replicated by rivals aiming to upsell analytics subscriptions.
The pivot toward automation is even clearer in procurement frameworks that now bundle remote monitoring nodes with hand-held kits for corrective work. As SLA penalties tighten, carriers consider real-time OTDR sweeps indispensable for metro rings and long-haul assets alike. Integrated DWDM channel analysis inside spectrum analyzers wins favor in regions where 400 G and 800 G deployments accelerate, while visual fault locators evolve into smartphone-app-controlled devices that auto-attach images to trouble-ticket systems.


By Form Factor: Portability Meets Automation Demands
Hand-held testers maintained a 51.45% stake in 2025 because field crews still constitute the frontline of fault isolation and acceptance testing. Weight reduction below 1 kg and eight-hour battery lives are now baseline specifications as technicians juggle multiple instruments during multi-site assignments. The rack/module-based class, however, is expanding at a 7.62% CAGR, propelled by hyperscale operators embedding test blades directly into top-of-rack switches to deliver always-on visibility. This practice supports closed-loop automation where orchestration software triggers pre-emptive fiber cleaning or rerouting.
Benchtop systems serve manufacturing and RandD environments where measurement dynamic range and spectral fidelity trump portability. Anritsu’s μOTDR module exemplifies miniaturization trends, slotting into PXI chassis to furnish OEMs with in-line production tests. Vendors increasingly adopt common firmware across form factors, allowing enterprises to leverage a single analytics cockpit regardless of device class, thereby reducing operator learning curves and support effort.
By Fiber Mode Tested: Single-Mode Dominance Reflects Infrastructure Reality
Single-mode test solutions represented 60.75% of revenue in 2025, mirroring the dominance of long-reach links in metro, access, and backbone topologies. Their continued primacy is reinforced by 400 G/800 G coherent upgrades that require tight dispersion budgets and accurate chromatic-dispersion testing. In contrast, multimode testing gains traction inside data centers and campus networks where cost pressures encourage OM4 and OM5 roll-outs.
Multimode devices must cope with higher modal-dispersion uncertainty, prompting OEMs to create hybrid units that switch seamlessly between 850 nm, 1300 nm, 1310 nm, and 1550 nm wavelengths. Bend-insensitive G.657 variants in single-mode lines drive demand for precision macrobend-testing channels, often at 1625 nm or 1650 nm live-traffic friendly bands. Educational institutions and vendor academies refresh curricula to address these nuanced wavelength-specific methodologies, aiming to shorten on-boarding cycles for new technicians.
By End-User Application: Energy Sector Emerges as Growth Driver
Telecom operators owned 34.40% of spending in 2025, still the largest buying center for core, metro, and access-network certification. Yet the energy and utilities vertical now expands at 6.97% CAGR as grid-modernization schemes embrace distributed acoustic sensing for intrusion detection, fault localization, and preventive maintenance of transmission lines. Phoenix Communications capitalized by integrating vibration-spectrum analytics directly into its commissioning instruments, satisfying dual telecom-utility requirements.
Hyperscale and enterprise data-center operators add momentum, procuring high-resolution wavemeters for 800 G coherent links while demanding RESTful APIs for instantaneous pass/fail logging. Defense customers, though numerically fewer, procure ruggedized testers rated for extreme temperatures and shock, commanding price premiums that inflate vendor operating margins. The cumulative diversification buffers suppliers against cyclical telecom capex dips and opens pathways for cross-sector solution suites.
Geography Analysis
Asia-Pacific contributed USD 0.45 billion to the fiber optic test equipment market size in 2025, reflecting unrelenting backbone expansion and the migration from GPON to 10G PON in markets such as China, Japan, and South Korea. Regional manufacturing capacity allows quick-turn customization, while national-security directives tilt procurement toward domestically produced optics. ASEAN countries add incremental demand as digital-economy policies broaden FTTH coverage, catalyzing hand-held OTDR sales. Academic collaboration between research labs in Japan and public institutes in South Korea accelerates innovations like coherent pluggables, sustaining local demand for high-precision measurement benches.
Middle East and Africa, though accounting for just USD 0.09 billion in 2025, registers the highest regional growth at 7.88% CAGR on the back of giga-projects requiring secure, high-capacity backbones. Saudi Telecom Company’s ORYX terrestrial system alone contributes hundreds of fiber-route-kilometers that mandate continuous monitoring platforms and ruggedized inspection scopes. Gulf operators pair 50G PON pilots with 400 G transport, creating downstream demand for dual-mode analyzers able to handle access and long-haul tests using a unified UI. Emerging African markets take cues from Nigeria’s national backbone targets, collaborating with equipment OEMs for tailored training and localization of consumables such as test leads and adaptors.
North America and Europe retain technological leadership in coherent-ready OTDR and optical-spectrum-analysis, collectively spending USD 0.47 billion on test gear in 2025. Federal grants in the United States incentivize purchase of devices that pass Build America, Buy America criteria, favoring vendors with domestic assembly. The European Union’s push for energy-efficient data centers triggers fresh demand for in-rack monitoring modules that feed real-time power-consumption data to orchestration stacks. South American carriers, meanwhile, pool procurement to secure volume discounts and shared logistics, a trend benefiting modular, multi-band testers that alleviate import-duty burdens.

Competitive Landscape
Competitive intensity remains moderate as the top five vendors command roughly 48% of global revenue. EXFO, VIAVI Solutions, and Anritsu leverage long-standing customer support networks and aggressive firmware-upgrade schedules to defend incumbency. Keysight’s USD 1.5 billion acquisition of Spirent extends its coverage from optical to Ethernet and Positioning, Navigation, Timing test, allowing cross-selling into carrier labs that evaluate converged services. VIAVI’s USD 150 million purchase of Inertial Labs underlines a trend toward multi-domain testing, useful for defense applications where optical links interoperate with navigation payloads.
Technology roadmaps converge on software-defined instrumentation able to push measurement packets to cloud dashboards via secure APIs. Market leaders differentiate on AI-powered anomaly detection, leveraging accumulated databases of OTDR signatures to flag latent faults before service degradation occurs. Smaller firms such as Shaanxi Aitelong Technology capture share in cost-sensitive emerging markets by bundling budget OTDRs with locally hosted service portals, exploiting lax import-duty regimes to undercut Western competitors.
Standardization exerts growing influence as carriers bake IEC 61300-3-35:2022 pass/fail criteria into RFPs, nudging buyers toward automated end-face-inspection platforms. Certification bodies and neutral labs partner with manufacturers to validate compliance, shortening sales cycles for pre-approved devices. Export-control risk surrounding advanced photonic integrated circuits forces some Chinese OEMs to dual-source lasers and DSPs, prompting Western suppliers to highlight secure supply chains as a competitive edge.
Fiber Optic Test Equipment (FOTE) Industry Leaders
EXFO Inc.
Anritsu Corporation
VIAVI Solutions Inc
VeEX Inc.
Yokogawa Electric Corporation
- *Disclaimer: Major Players sorted in no particular order

Recent Industry Developments
- March 2025: Teradyne acquired Quantifi Photonics to expand into photonic integrated-circuit testing.
- February 2025: VIAVI Solutions completed the USD 150 million purchase of Inertial Labs, adding precision navigation to its test portfolio.
- February 2025: EXFO released an AI-driven test suite for high-density data-center fiber infrastructures.
- January 2025: Saudi Telecom Company signed a SAR 32.64 billion contract for national secure telecom infrastructure build-out.


Global Fiber Optic Test Equipment (FOTE) Market Report Scope
The fiber optic test equipment market is defined by the revenue generated from the sale of fiber optic test equipment offered by different market players for a diverse range of end-user applications. The market trends are evaluated by analyzing the investments made in product innovation, diversification, and expansion. Further, the advancements in telecommunications, data centers, and industries are also crucial in determining the growth of the market studied.
The fiber optic test equipment market is segmented into equipment type (optical light sources, optical power and loss meters, optical time domain reflectometer, optical spectrum analyzers, remote fiber test system, and other equipment types), end-user application (telecommunications, data centers, industries [military and aerospace, manufacturing, oil & gas, energy and power], and other end-user applications) and geography (North America (United States, Canada), Europe (Germany, United Kingdom, France, Rest of Europe), Asia-Pacific (China, Japan India, Rest of Asia-Pacific), Latin America (Brazil, Argentina, Mexico, Rest of Latin America), Middle East & Africa (United Arab Emirates, Saudi Arabia, South Africa, Rest of Middle East and Africa)). The market size and forecasts are provided in terms of value (USD) for all the above segments.
| Optical Light Sources | LED Sources |
| Laser Sources | |
| Optical Power and Loss Meters | |
| Optical Time-Domain Reflectometers | |
| Optical Spectrum Analyzers | |
| Remote Fiber Test Systems | |
| Others (Inspection Microscopes, VFL, etc.) |
| Hand-held |
| Benchtop |
| Rack/Module-based |
| Single-mode |
| Multi-mode |
| Telecommunications Service Providers |
| Hyperscale and Enterprise Data Centers |
| Industrial and Manufacturing |
| Energy and Utilities (Smart-grid, Oil and Gas) |
| Government and Defense |
| Others (Broadcast, Healthcare, RandD) |
| North America | United States |
| Canada | |
| South America | Brazil |
| Argentina | |
| Mexico | |
| Europe | Germany |
| United Kingdom | |
| France | |
| Russia | |
| Asia-Pacific | China |
| Japan | |
| India | |
| South Korea | |
| Rest of Asia-Pacific | |
| Middle East and Africa | United Arab Emirates |
| Saudi Arabia | |
| South Africa |
| By Equipment Type | Optical Light Sources | LED Sources |
| Laser Sources | ||
| Optical Power and Loss Meters | ||
| Optical Time-Domain Reflectometers | ||
| Optical Spectrum Analyzers | ||
| Remote Fiber Test Systems | ||
| Others (Inspection Microscopes, VFL, etc.) | ||
| By Form Factor | Hand-held | |
| Benchtop | ||
| Rack/Module-based | ||
| By Fiber Mode Tested | Single-mode | |
| Multi-mode | ||
| By End-user Application | Telecommunications Service Providers | |
| Hyperscale and Enterprise Data Centers | ||
| Industrial and Manufacturing | ||
| Energy and Utilities (Smart-grid, Oil and Gas) | ||
| Government and Defense | ||
| Others (Broadcast, Healthcare, RandD) | ||
| By Geography | North America | United States |
| Canada | ||
| South America | Brazil | |
| Argentina | ||
| Mexico | ||
| Europe | Germany | |
| United Kingdom | ||
| France | ||
| Russia | ||
| Asia-Pacific | China | |
| Japan | ||
| India | ||
| South Korea | ||
| Rest of Asia-Pacific | ||
| Middle East and Africa | United Arab Emirates | |
| Saudi Arabia | ||
| South Africa | ||


Key Questions Answered in the Report
What is the projected value of the global fiber optic test equipment market in 2031?
It is expected to reach USD 1.71 billion by 2031, growing at a 6.44% CAGR during 2026-2031.
Which region is expanding fastest for fiber test equipment demand?
Middle East and Africa is advancing at an 7.88% CAGR thanks to large-scale telecom and smart-city projects.
Which equipment type is growing quickest?
Remote fiber test systems post the highest 7.98% CAGR as operators seek automated, AI-enabled monitoring.
Why are utilities investing in fiber optic test tools?
Smart-grid digitization requires distributed sensing and continuous fiber health checks, driving a 6.97% CAGR in utility spending.
How are vendors addressing technician shortages?
They embed guided workflows and AI analytics into hand-held devices, reducing the skill barrier for complex diagnostics.
What role does 800 G optics play in test-equipment innovation?
The migration to 800 G coherent links forces testers to deliver picometer wavelength resolution and integrate tunable lasers for accurate validation.
Page last updated on:


