
Market Overview
| Study Period | 2020 - 2031 |
|---|---|
| Forecast Data Period | 2026 - 2031 |
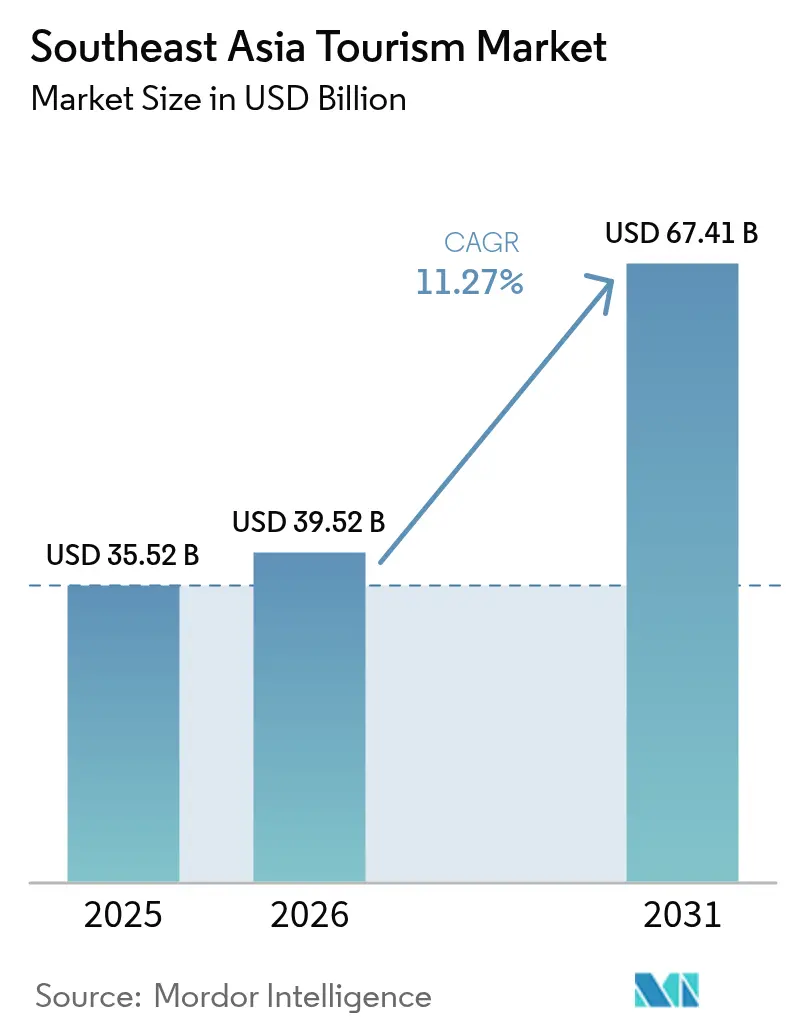
| Base Year Market Size (2025) | USD 35.52 Billion |
| Market Size (2026) | USD 39.52 Billion |
| Market Size (2031) | USD 67.41 Billion |
| Growth Rate (2026 - 2031) | 11.27 % |
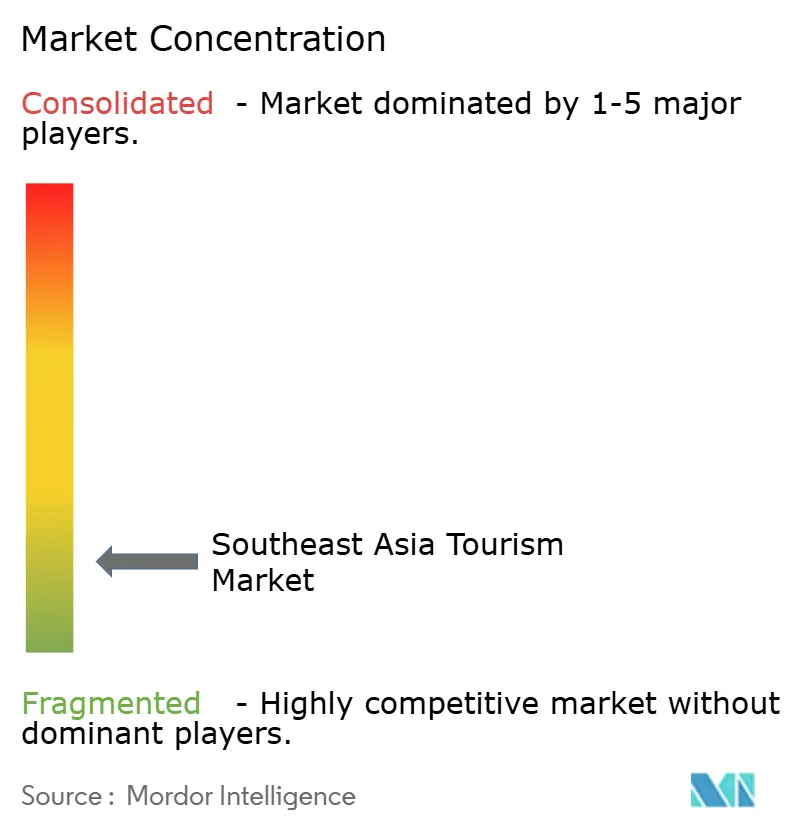
| Market Concentration | Low |
Major Players *Disclaimer: Major Players sorted in no particular order Image © Mordor Intelligence. Reuse requires attribution under CC BY 4.0. | |
Southeast Asia Tourism Market Analysis by Mordor Intelligence
The Southeast Asia tourism market size is expected to grow from USD 35.52 billion in 2025 to USD 39.52 billion in 2026 and is forecast to reach USD 67.41 billion by 2031 at 11.27% CAGR over 2026-2031. This pace firmly places the Southeast Asia tourism market among the world’s fastest-expanding visitor economies, outstripping the growth rates in most other regions. The momentum in Southeast Asia's tourism market is driven by three key factors: streamlined visa reforms that have minimized travel barriers, the strategic network expansion by low-cost carriers resulting in reduced airfares, and the consistent growth in disposable incomes across a substantial consumer base. These drivers collectively enhance both origin and destination options, diversify revenue channels, and reinforce confidence in the market's ability to withstand future disruptions. Accommodation services remain the primary revenue generator; however, digital travel services, particularly dynamic packaging and in-destination activities, are capturing an increasing share of consumer spending as mobile platforms dominate the search, booking, and review processes. The MICE (Meetings, Incentives, Conferences, and Exhibitions) segment is witnessing a resurgence, with corporate planners finalizing long-delayed events. Simultaneously, leisure tourism continues to serve as the foundation, supporting employment within the hospitality sector across the region.
Key Report Takeaways
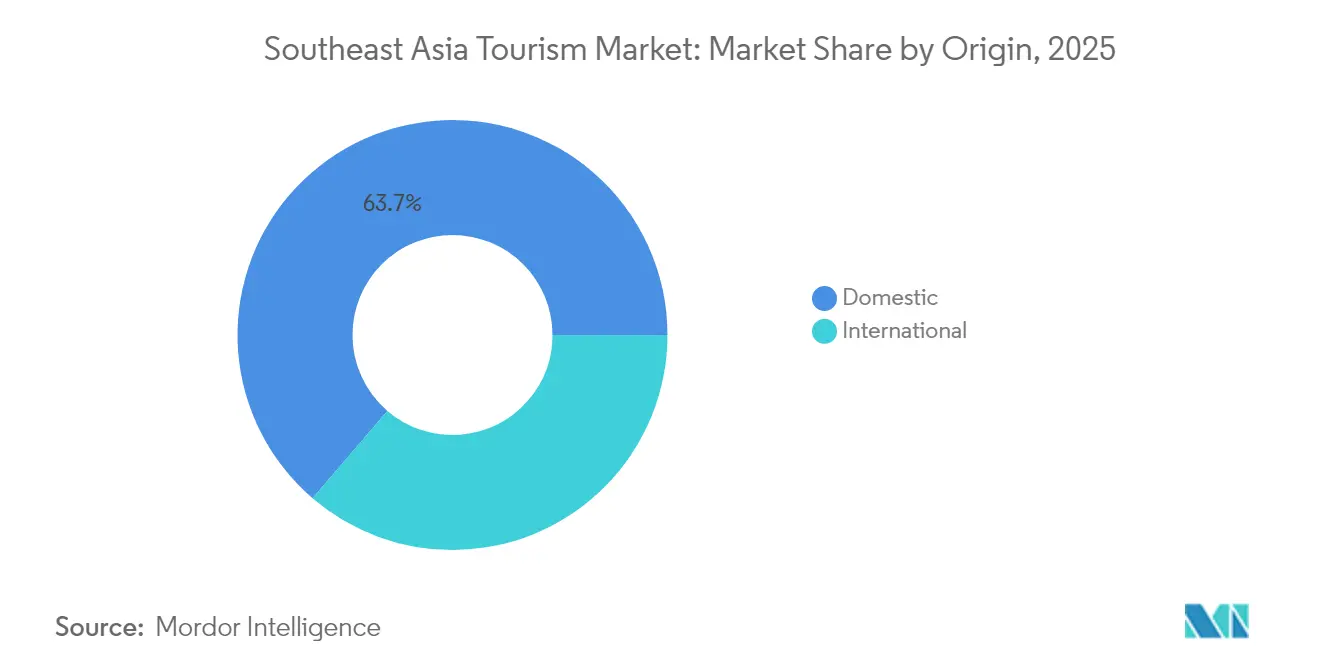
- By origin, domestic travel contributed 63.72% of the Southeast Asia tourism market share in 2025, whereas international arrivals are forecast to grow at an 11.05% CAGR through 2031.
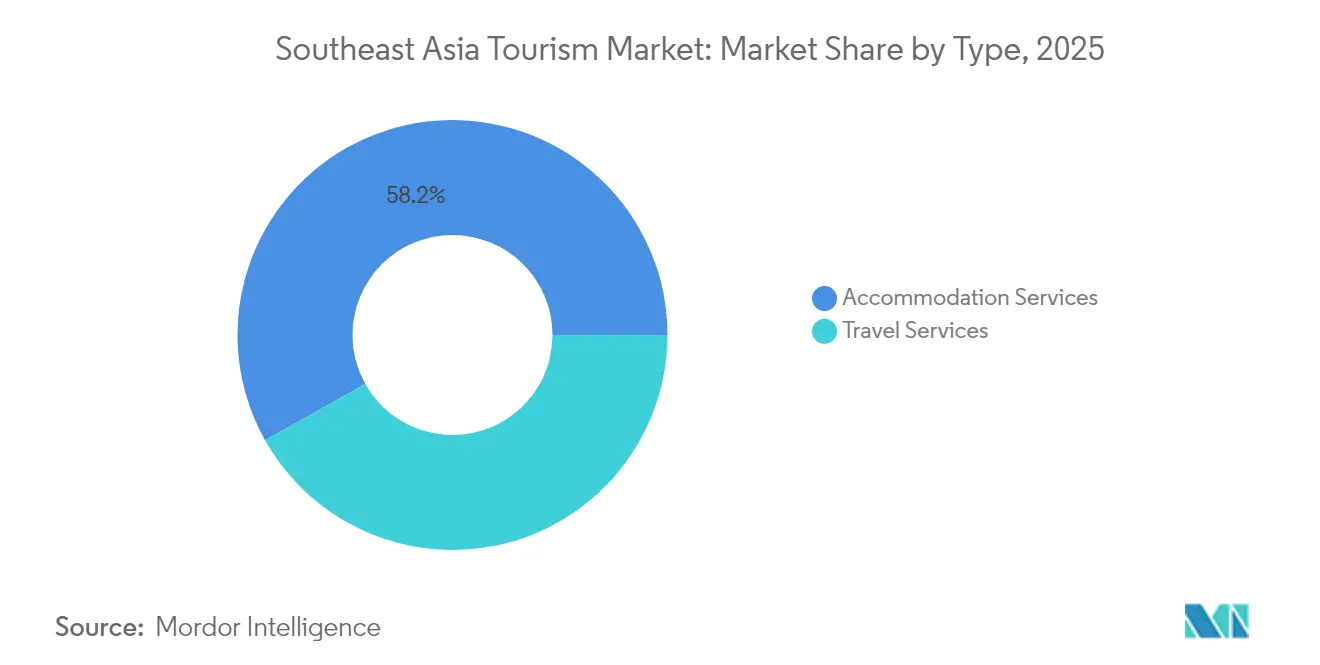
- By type, accommodation services held 58.15% of the Southeast Asia tourism market size in 2025; travel services are set to expand at a 12.01% CAGR during the same period.
- By purpose, leisure accounted for 46.89% of the Southeast Asia tourism market size in 2025, while the MICE segment is advancing at a 13.92% CAGR to 2031.
- By geography, Thailand commanded 19.06% of the Southeast Asia tourism market share in 2025, and Vietnam is projected to log the fastest 13.22% CAGR through 2031.
Note: Market size and forecast figures in this report are generated using Mordor Intelligence’s proprietary estimation framework, updated with the latest available data and insights as of 2026.
Market Trends and Insights
Drivers Impact Analysis of Southeast Asia Tourism Market*
| Driver | (~) % Impact on CAGR Forecast | Geographic Relevance | Impact Timeline |
|---|---|---|---|
| Visa liberalization & e-visa rollouts | +2.1% | Global, with early gains in Thailand, Vietnam, Malaysia | Medium term (2-4 years) |
| Expansion of low-cost carrier (LCC) networks | +1.8% | ASEAN core, spill-over to secondary cities | Short term (≤ 2 years) |
| Rising disposable income of the intra-regional middle class | +1.5% | ASEAN domestic markets, China-ASEAN corridor | Long term (≥ 4 years) |
| Digital-nomad visa schemes and long-stay demand | +1.2% | Thailand, Malaysia, Philippines, Vietnam | Medium term (2-4 years) |
| Heritage-conservation PPPs catalysing cultural tourism | +0.9% | Vietnam, Cambodia, and Indonesia heritage sites | Long term (≥ 4 years) |
| Early adoption of crypto-payments in select destinations | +0.4% | Thailand (Phuket), Singapore, Malaysia | Short term (≤ 2 years) |
| Source: Mordor Intelligence | |||
Visa Liberalization & E-Visa Roll-outs Drive Regional Integration
Southeast Asian policymakers now treat seamless entry as the linchpin of competitiveness, and the recent wave of exemptions illustrates collective intent. Thailand doubled visa-free stays to 60 days for 93 nationalities and introduced the Destination Thailand Visa that grants 180-day renewable residence to remote workers. Vietnam has enhanced its business environment by extending 45-day visa waivers for 12 European countries until 2028 and implementing digital systems to streamline approval processes for other markets[1]TAT Newsroom, “Thailand Targets High-Value Travellers to Fuel Long-haul Tourism Growth,” tatnews.org . Malaysia has strategically enhanced its tourism inflow by implementing long-term visa waivers for Chinese visitors, while the Philippines has introduced a digital-nomad permit aimed at attracting the global remote workforce. These policy measures have streamlined application processes and reduced compliance costs, resulting in extended visitor stays and increased expenditure. Collectively, these initiatives strengthen Southeast Asia's position as a leading and accessible multi-country tourism destination.
Expansion of Low-Cost Carrier Networks Transforms Regional Connectivity
Ten budget airlines secured Thai operating certificates in 2024, multiplying city-pair frequencies and linking previously isolated locales such as Mae Sot and Trang. AirAsia Group inaugurated cross-border routes that bypass capital hubs, Cebu Pacific partnered with Traveloka to penetrate mobile-first consumers, and Singapore Airlines deepened joint scheduling with Scoot to fill off-peak slots. Airlines in Southeast Asia are strategically responding to shifting traveler preferences, resulting in notable market changes. A substantial reduction in average round-trip fares, coupled with increased passenger traffic at secondary airports, highlights the region's expanding network density and enhanced geographic accessibility. The establishment of dedicated low-cost carrier (LCC) terminals in key cities such as Bangkok, Jakarta, and Ho Chi Minh City has optimized operational efficiency by reducing turnaround times. This operational improvement enables tighter scheduling, maintaining profitability despite lower fare yields. The availability of cost-effective and frequent flights provides the Southeast Asia tourism market with the flexibility to capitalize on demand driven by spontaneous travel decisions, particularly among millennials and first-time travelers.
Rising Disposable Income of the Intra-Regional Middle Class Fuels Domestic Demand
The middle-income population within ASEAN has experienced substantial growth since 2010, with forecasts indicating sustained expansion. Wage increases in key markets such as Indonesia, the Philippines, and Vietnam are driving demand for weekend city getaways, festival-related tourism, and culinary experiences. Additionally, Thailand's domestic tourism revenue now constitutes a significant share of total travel income, enhancing the Southeast Asia tourism market's ability to withstand external challenges. In 2024, Vietnam recorded 110 million domestic travellers, with a noticeable shift from hostel accommodations to boutique stays, which contributed to an increase in average daily expenditure. The increasing outbound travel activity among Chinese and Indian middle-class consumers is contributing to sustained year-round occupancy rates. This trend highlights the role of income-driven demand in supporting both travel volumes and revenue generation, even before accounting for long-haul travel arrivals.
Digital-Nomad Visa Schemes Capture Long-Stay Tourism Premium
Thailand leads with its 180-day Destination Thailand Visa that targets online professionals who often outspend leisure visitors two-to-one. The Philippines offers a renewable 12-month remote-work permit, and Vietnam drafts multi-entry visas of up to 36 months for retirees and knowledge workers[2]VietnamPlus, “Tourism Sector Thriving in 2024,” en.vietnamplus.vn . These strategies effectively transform short-term tourists into semi-residents, addressing low-season demand gaps while bolstering the sustainability of local businesses such as cafes, co-working spaces, and language schools. Furthermore, long-term visitors play a pivotal role in enhancing the destination's visibility by sharing their experiences online. This activity generates a network effect, attracting similar demographic groups and solidifying Southeast Asia's position as a preferred destination for individuals pursuing location-independent lifestyles.
Restraints Impact Analysis of Southeast Asia Tourism Market*
| Restraint | (~) % Impact on CAGR Forecast | Geographic Relevance | Impact Timeline |
|---|---|---|---|
| Political instability & travel advisories | -1.6% | Myanmar, regional spill-over effects | Short term (≤ 2 years) |
| Infrastructure bottlenecks in Tier-2/3 cities | -1.2% | Indonesia, Philippines, Vietnam secondary cities | Medium term (2-4 years) |
| Overtourism-driven visitor caps at heritage sites | -0.8% | Bali, Hoi An, Angkor heritage corridors | Long term (≥ 4 years) |
| Climate-risk insurance cost spikes for airlines & resorts | -0.7% | Coastal regions, typhoon-prone areas | Medium term (2-4 years) |
| Source: Mordor Intelligence | |||
Political Instability Creates Regional Tourism Disruption
Myanmar’s dramatic visitor collapse after the 2021 coup eliminated a once-promising destination and disrupted Mekong multi-country circuits. Cruise lines rerouted to avoid off-limit ports, and insurers raised premiums on regional itineraries that traverse contested waters. Sporadic protests in Malaysia and Indonesia occasionally trigger foreign travel advisories, leading to last-minute cancellations that squeeze small operators with thin cash reserves. Political risk, therefore, remains an unpredictable drag on the Southeast Asia tourism market, prompting businesses to invest in scenario planning and diversified source markets.
Infrastructure Bottlenecks Constrain Secondary-Destination Development
Operational delays at Long Thanh International Airport are intensifying capacity constraints in Ho Chi Minh City, highlighting the need for accelerated infrastructure upgrades. Similarly, the ongoing development of Indonesia's Nusantara is projected to alleviate congestion in Java, but its full impact is not expected to materialize until 2028. In the Philippines, inefficiencies in ferry scheduling and inadequate road networks are disrupting the seamless connectivity required for island-hopping tourism, thereby limiting the sector's growth potential. Furthermore, unreliable access to water and electricity in tier-3 cities is deterring hotel investments, as investors face challenges in securing stable utility services. These infrastructure bottlenecks are constraining the average length of stay and curbing tourist spending, thereby restricting the ability of Southeast Asia's tourism market to distribute economic benefits beyond primary gateway destinations.
*Our forecasts treat driver/restraint impacts as directional, not additive. The impact forecasts reflect baseline growth, mix effects, and variable interactions.
Southeast Asia Tourism Market Segment Analysis
By Origin:
Domestic Resilience Anchors Market StabilityThe domestic channel retains a 63.72%, proving a shock absorber when borders closed. Stimulus vouchers in Thailand and Indonesia funded hotel discounts and free attraction passes, sustaining labour in provincial economies. Vietnam reported 110 million domestic trips in 2024, with a significant shift observed in consumer behaviour. Mid-scale hotels experienced an increase in occupancy rates, indicating a trend where local travellers are opting for higher-quality accommodations. This development highlights a growing preference among domestic tourists to upgrade their lodging choices, reflecting an evolution in spending patterns and travel preferences within the market. A similar pattern emerged in Malaysia, where domestic trips to Penang and Kota Kinabalu doubled quarter-on-quarter, pushing room rates up despite moderate volumes. The Southeast Asia tourism market thus benefits from a vast internal customer base that backstops employment and public revenues.
International travel, though currently smaller, advances faster on an 11.05% trajectory. China's tourism sector has demonstrated a significant recovery, approaching pre-pandemic performance levels. Concurrently, extended visa waivers have encouraged European travelers to prolong their stays, contributing to increased tourism revenue. Long-haul travelers are generating higher daily expenditures compared to domestic tourists, thereby enhancing foreign-exchange inflows and strengthening the economic impact of international tourism. The introduction of digital-nomad visas is mitigating the effects of seasonality by transforming peak-period visitors into consistent, year-round contributors to the tourism economy. Furthermore, the adoption of simplified e-visa platforms is reducing customer acquisition costs for marketers, improving operational efficiency. By 2031, the Southeast Asia tourism market is expected to achieve greater financial stability through a balanced mix of domestic and international tourist flows, ensuring more predictable cash cycles and sustainable growth.



By Type:
Travel Services Innovation Drives Segment TransformationAccommodation retains the lion’s 58.15% share, underpinned by quarterly RevPAR gains at major chains. Asset-light franchises reduce capital exposure, allowing rapid flag planting in Bali, Da Nang, and Khanom. The adoption of sustainable retrofitting solutions, such as solar roofs and low-flow plumbing systems, is increasingly recognized for its ability to reduce operational energy costs while meeting the heightened environmental, social, and governance (ESG) standards demanded by corporate stakeholders. Concurrently, boutique brands operating within Southeast Asia's tourism market are strategically focusing on localized design approaches. By incorporating materials like reclaimed wood and indigenous textiles, these brands are effectively addressing the growing consumer demand for authentic and culturally resonant experiences.
Travel services enjoy a 12.01% CAGR as digital intermediaries scale. Traveloka’s API deal with Malaysia Airlines lets customers bundle flights, lounges, and travel insurance in two clicks. Tiket.com has partnered with Accor, integrating hotels into a unified loyalty wallet. This move aims to boost repeat bookings through targeted push notifications. Additionally, ancillary products like concert tickets, theme-park passes, and micro-insurance are enhancing the company's take rate, thereby reducing the profitability gap with accommodation providers. Furthermore, AI chatbots are streamlining service costs, while machine-learning recommender engines are improving conversion rates. These advancements underscore the pivotal role of data leverage in shaping the competitive landscape of Southeast Asia's tourism market.
By Purpose:
MICE Tourism Emerges as Premium Growth DriverLeisure still fills planes and seaside resorts, but yield growth relies on higher-value niches. MICE bookings now pace at 13.92% CAGR, supported by new convention halls in Bangkok, Kuala Lumpur, and Ho Chi Minh City. The Philippines has been granted the opportunity to host the ASEAN Tourism Forum in 2026, positioning the country as a key player in regional tourism initiatives. Concurrently, Cambodia forecasts significant growth in its MICE (Meetings, Incentives, Conferences, and Exhibitions) sector by 2025, reflecting the increasing importance of business tourism in the region. The Southeast Asia tourism market is further strengthened by the inclusion of weddings and religious gatherings, which contribute to demand during traditionally low seasons, thereby enhancing market resilience and purpose diversification.
The resurgence of corporate travel is driving an uptick in mid-week hotel occupancy rates, as businesses increasingly shift from virtual to hybrid meeting formats. This trend is further supported by the acceleration of regional trade, prompting suppliers to prioritize in-person plant visits. Medical tourism is also gaining traction in Thailand and Malaysia, underpinned by the presence of JCI-certified hospitals, which enhance the credibility and appeal of healthcare services in these countries. Additionally, educational exchanges are contributing to the utilization of dormitory facilities in key hubs such as Singapore and Kuala Lumpur. The growing popularity of esports tournaments, exemplified by the Mobile Legends event scheduled for the 2025 SEA Games, is attracting millennial audiences and diversifying the tourism market's demographic reach. This broadening of travel purposes mitigates demand volatility and establishes a more stable revenue foundation for the Southeast Asia tourism market, extending its growth potential beyond the traditional focus on beach holidays.
Geography Analysis
Thailand Tourism Market
Thailand has established itself as a leader in airport revenue generation within Southeast Asia, driven by consistent and strategic infrastructure investments over the years. These investments include the expansion of airport capacity through the addition of runways and satellite terminals at key locations such as Bangkok and Phuket. Furthermore, the introduction of the "Destination Thailand" visa has strategically positioned the country as an attractive destination for digital professionals. This initiative has facilitated the growth of co-working hubs in cities like Chiang Mai and Phuket, further enhancing Thailand's appeal as a hub for remote work and business activities. Partnerships with Alipay+ make cashless payments ubiquitous, and a pending gambling law could unlock integrated resorts that redirect outbound Thai bettors home. Despite saturation risk at core beaches, new product themes, wellness retreats in Nakhon Si Thammarat, soft-adventure circuits in Phatthalung, spreading visitors inland, and preserving carrying capacity.
Vietnam Tourism Market
Vietnam's tourism sector has demonstrated significant growth, achieving a robust 13.22% expansion, as the country intensifies efforts to attract foreign tourists by 2030. Infrastructure improvements, such as expressway upgrades, have reduced travel time between Hanoi and Ha Long to two hours, enhancing accessibility to key destinations. In Hoi An, a UNESCO World Heritage site, authorities are implementing advanced crowd-management technology to regulate visitor flow and optimize ticket revenue generation. The government's visa waiver policy for European travelers has positively impacted the market by increasing the average length of stay and expenditure per visitor. Furthermore, the ongoing review of multiple-entry visa policies is expected to attract high-value segments, including retirees and yacht owners. Hotel development pipelines are increasingly concentrated in emerging coastal provinces such as Quy Nhon and Phu Quoc, signaling a strategic shift to diversify accommodation supply beyond the established hub of Danang.
ASEAN Tourism Market
Indonesia chases a 16 million foreign-visitor goal, pairing visa waivers for Brazil and Turkey with five “Super Priority Destinations” such as Lake Toba and Labuan Bajo that receive ring-fenced infrastructure budgets. Malaysia secures Chinese market stickiness via visa exemptions until 2036 and promotes eco-tourism in Sabah’s Danum Valley. Singapore positions itself as the region’s high-yield gateway, integrating cruise terminals, Changi Airport, and world-class events, while leveraging technology to cap manpower costs. The Philippines blends domestic strength with inbound MICE prospects, using upgraded Cebu and Boracay facilities to host ASEAN Tourism Forum 2026. Cambodia and Laos participate in Greater Mekong Sub-region marketing to tap shared circuits, thus ensuring that every ASEAN member plays a role in the expanding Southeast Asia tourism market.
Regulatory Landscape
Tourism regulation in Southeast Asia is increasingly coordinated through ASEAN-led frameworks that shape national policies on seamless travel, workforce mobility, and sustainability. In January 2026, ASEAN tourism ministers adopted the ASEAN Tourism Sectoral Plan (ATSP) 2026-2030 and the ASEAN Tourism Marketing Strategy (ATMS) 2026-2030, creating a shared regional policy backbone that emphasizes resilient tourism, digital transformation, and product diversification. The same ministerial track also confirmed work to make the Mutual Recognition Arrangement on Tourism Professionals (MRA-TP) operational in 2026, supporting cross-border recognition of tourism skills and more consistent service standards across member markets.
Sustainability and destination-governance standards are tightening as countries adjust entry policies. ASEAN maintains a portfolio of implementable standards used for national adaptation (including ASEAN Green Hotel, ASEAN MICE Venue, and Clean Tourist City standards), and introduced an ASEAN Ecotourism Standard with 65 criteria across nine themes, including 35 mandatory criteria for first-year certification. Thailand, for its part, shifted its visa posture in 2026 through cabinet-approved revisions that reduced the breadth and duration of visa-free entry and linked screening more closely to digital arrival processes, including the Thailand Digital Arrival Card (TDAC), reflecting a regulatory preference for managed volume, compliance, and security controls alongside facilitation.
Value Chain Analysis
The Southeast Asia tourism value chain starts with destination inputs and experience enablers (air access, attractions, events, utilities, and local transport), then proceeds through accommodation, food and beverage, retail, and recreation suppliers. Distribution and packaging are handled by tour operators, travel agencies, and increasingly online travel agencies and airline-direct channels, while demand is shaped at the point of search and booking through digital platforms and payment rails. On-the-ground delivery then depends on last-mile mobility, attraction capacity management, and service labor availability. Cross-border itineraries add another layer, as route networks, visa processes, and multi-country product design determine how effectively interest converts into spend.
In 2026, policy and operational conditions point to where value leakage and bottlenecks emerge. The ASEAN Tourism Sectoral Plan (ATSP) 2026-2030, launched in January 2026 at the ASEAN Tourism Forum in Cebu, anchors reforms around seamless travel, workforce empowerment, digital tourism, and sustainable product diversification. These elements influence how suppliers onboard to platforms, how operators bundle experiences, and how workforce skills are recognized across borders. Upstream airline capacity and cost dynamics also act as constraints, with 2026 industry reporting highlighting jet-fuel and energy-cost pressure and flight adjustments tied to wider airspace disruptions, which can affect tour operator allotments, hotel pickup patterns, and the pricing of dynamic packages, particularly for secondary-city circuits that rely on tight air connections.
Competitive Landscape
The tourism market in Southeast Asia demonstrates a fragmented structure, with the leading players collectively holding a relatively small market share. Companies such as Traveloka and Agoda are actively competing to enhance customer loyalty by integrating innovative features, including buy-now-pay-later (BNPL) financing options and multi-currency digital wallets, to differentiate their offerings. AirAsia Group is diversifying its revenue streams by incorporating fintech solutions, such as foreign-exchange cards and ride-sharing services, into its ecosystem, thereby reducing its reliance on seat sales. Similarly, Singapore Airlines is leveraging strategic joint ventures with Scoot and Vistara to strengthen its wide-body traffic network, enabling the airline to secure a competitive position in the profitable long-haul travel segment.
Sunway Hotels has strategically aligned with the Global Hotel Alliance to leverage its extensive loyalty program, enabling access to a broad customer base and enhancing cross-promotional opportunities. Within the Southeast Asia tourism market, boutique hotel chains are increasingly adopting culturally inspired designs to differentiate themselves from established international brands. This approach not only strengthens their market positioning but also contributes to a more diverse and competitive industry landscape.
Technological partnerships intensify. Accor ports inventory to tiket.com, accessing 20 million monthly active users. Traveloka allies with Malaysia Airlines and Singapore Tourism Board to co-fund digital campaigns and share customer analytics. ESG credentials now influence corporate RFPs: Singapore pursues ISO 20121 certification for events, and Thailand’s “Green SEA Games” initiative pre-qualifies suppliers that meet carbon baselines. Esports tourism emerges as a niche battleground, with Mobile Legends: Bang Bang integrated into SEA Games 2025 underpinned by new sponsorship revenue. Players agile enough to weave sustainability, technology, and experience curation will seize margin leadership as the Southeast Asia tourism market passes USD 60 billion by decade-end.
Southeast Asia Tourism Industry Leaders
Singapore Airlines
AirAsia Group
Agoda (Booking Holdings)
Traveloka
Garuda Indonesia
- *Disclaimer: Major Players sorted in no particular order
Southeast Asia Tourism Market Companies Covered in this Report
- Singapore Airlines
- AirAsia Group
- Agoda (Booking Holdings)
- Traveloka
- Garuda Indonesia
- Thai Airways International
- Vietnam Airlines
- Cebu Pacific
- Malaysia Airlines
- Jetstar Asia
- Trip.com Group
- Expedia Group
- Marriott International
- AccorHotels
- Hilton Worldwide
- Hyatt Hotels Corporation
- Banyan Tree Holdings
- Genting Group
- TUI Group
- Minor Hotels

Market Opportunities and Future Outlook
Regional roadmaps adopted in 2026 create clearer whitespace for operators that can align product design and compliance with ASEAN priorities. The ASEAN Tourism Sectoral Plan (ATSP) 2026-2030 and ASEAN Tourism Marketing Strategy (ATMS) 2026-2030 emphasize accessible and seamless travel, digital tourism, workforce empowerment, and sustainable product diversification. That direction supports standardized multi-country itineraries that are easier to market and deliver across borders. Cross-border eco-tourism circuits (including Mekong Basin themes referenced in the report scope) also gain a more usable operating template through ASEAN tourism standards, notably the ASEAN Ecotourism Standard, which DMCs, parks, and community-based providers can use to structure offerings and qualify for government-backed promotion.
Capacity and product actions in Vietnam during 2026 illustrate where investment is concentrating and where adjacent opportunities open up for distribution, experiences, and MICE-linked demand. Vinpearl (Vingroup) secured a USD 255 million strategic investment in June 2026 to expand its hospitality portfolio, and Sun Group initiated an expansion of 5,500 hotel rooms in Hon Thom (Phu Quoc) as part of a broader development program, pointing to rising supply in resort nodes that can support longer stays and higher-spend itineraries. In parallel, digital travel services and packaging are creating room to digitize inventory for activities, local transport, and niche experiences (wellness, culture, and event-driven travel) as travel services scale through API-led partnerships such as the Traveloka integrations with airline retailing noted in the market context. This can also help destinations manage carrying capacity through timed entry, pre-booking, and curated dispersal into tier-2 and tier-3 locations.
Recent Industry Developments in Southeast Asia Tourism Market
- July 2026: AirAsia completed its corporate rebranding with the legal name change to AirAsia Group Berhad (from AirAsia X Berhad), effective 2 July 2026. The move aligns the holding identity with a multi-airline structure and supports a unified commercial strategy across a broader low-cost network footprint.
- May 2025: Sunway Hotels and Resorts joined Global Hotel Alliance and the GHA DISCOVERY loyalty program, onboarding 11 properties across Malaysia, Vietnam, and Cambodia into a network serving a large international member base. This strengthened cross-border demand capture through loyalty-driven distribution and supports higher repeat bookings across multiple Southeast Asian destinations.
- November 2024: Accor entered a global strategic partnership with Indonesian OTA tiket.com, integrating hundreds of Asian Accor hotels across its brand portfolio into tiket.coms booking platform. The partnership expanded Accors reach in a mobile-first channel and increased the role of OTA-led merchandising for hotel inventory across Southeast Asia.


Southeast Asia Tourism Market Report Scope and Research Methodology
Market Definition and Coverage
For this study, the market is defined as the revenue generated from travel and tourism activity linked to trips within Southeast Asia, counted across domestic and international visitors and the services they purchase through the travel journey.
Scope exclusions: We exclude the wider economic contribution multipliers to GDP, along with indirect and induced impacts that sit outside tourism service revenue.
Segments Covered in This Report
- By Origin
- Domestic
- International
- By Type
- Accommodation Services
- Travel Services
- By Purpose
- Leisure
- Business
- Visiting Friends & Relatives (VFR)
- Religious
- Meetings-Incentives-Conferences-Exhibitions (MICE)
- Other Purposes
- By Geography
- Indonesia
- Thailand
- Malaysia
- Singapore
- Philippines
- Vietnam
- Rest of Southeast Asia
Data Sources, Market Sizing, and Validation
Desk Research
Desk work starts by setting the demand context and the country coverage, and then we align definitions so the same traveler spending is not double counted. Public sources used for this step include items such as UN Tourism country dashboards, IATA traffic statistics, World Bank macro series, IMF exchange rates, and national tourism ministry arrivals and receipts releases across Southeast Asia.
To convert activity signals into value, we also reviewed company filings and investor presentations from travel operators, airports, and major accommodation groups, along with reputed press and association websites. In a few places, paid subscriptions were used in an allowed way to sanity check company financials and to track news and event timelines that can shift travel demand. These desk research sources are not exhaustive, and many other public references were used for data collection, validation, and clarification.
Primary Interviews and Surveys
We use interviews and surveys with travel operators, accommodation providers, distribution specialists, and tourism officials across South East Asia. Respondents help clarify room rates, occupancy, domestic demand, service mix, and the timing of capacity changes where published data are incomplete. Their input is compared with visitor arrivals, tourism receipts, and other secondary indicators before the final market model is set.
Distribution of primary research fieldwork respondents
| Company type | Respondent position |
|---|---|
| Top tier: 28% | CXOs: 15% |
| Mid tier: 47% | Functional/Unit leaders: 30% |
| Smaller Players: 25% | Managers: 55% |
Market-Sizing & Forecasting
Sizing is built from a top-down demand pool that reconstructs tourism revenue using country level travel flows and spend signals, and then it is reconciled to a single regional total. Where the data trail is thin, we fill gaps using proxy indicators that can be checked, and then tighten assumptions during reviews.
Inputs used in the model include international tourist arrivals, domestic trip intensity, average length of stay, average daily spend split across typical trip baskets (stay, transport, experiences), and currency conversion timing for cross border spend. We also tracked air passenger traffic and seat capacity trends as a practical reality check, because movement data usually leads near term tourism receipts.
Forecasts are produced using scenario analysis, where the key drivers are moved in realistic bands based on what operators and buyers expect for price, capacity, and policy stability. Results are then corroborated with selective bottom-up approximations, such as sampled price points for rooms and air tickets, channel checks on package values, and supplier revenue roll-ups where public disclosures exist, so we do not rely on one single view.
Data Validation & Update Cycle
Outputs are validated by comparing the final totals against independent signals such as arrivals, air traffic, and tourism receipts directionality, and any sharp variance is investigated before sign-off. Outliers are traced back to the driver level, where we check for timing issues, definition mismatches, or currency effects, and then adjust the model assumptions.
A multi-step internal review is followed, and respondents may be re-contacted when a key variable moves faster than expected, such as a policy change, a demand shock, or an airline capacity shift. Reports are refreshed annually, and interim updates are made when material events occur. Before delivery, we do a fresh pass to confirm the latest public releases have been reflected.
Mordor Intelligence's South East Asia Travel and Tourism Opportunities Market Size Compared With Other Published Estimates
Published market values for Southeast Asia travel and tourism often do not match because the underlying definitions are not always the same, and the update timing can also be different. In our checks, the biggest differences usually come from whether revenue is counted as tourism service spend or expanded into wider economic contribution, and then how price and currency are treated for multi-country totals.
The main gap comes from mixing direct tourism revenue with GDP contribution style totals, where Mordor Intelligence counts only tourism sector revenue for 2026 and keeps currency conversion consistent to the same timing across the covered Southeast Asia countries.
Benchmark comparison
| Source | Market Size | Gaps in Research Methodology |
|---|---|---|
| Mordor Intelligence | USD 39.52 B (2026) | |
| Industry Publisher A | USD 258.83 B (2025) | The figure appears to use a much wider spend scope and may blend tourism revenue with broader economic contribution, while country coverage and domestic versus inbound treatment are not clearly stated, which can inflate totals. |
| Regional Publisher B | USD 59.00 B (2024) | The estimate is anchored to an earlier year and is described as being derived from GDP contribution signals, which can misalign with revenue-only tracking when receipts definitions and currency translation timing are not aligned across countries. |
Looking at the spread, the largest driver is definition, followed by year alignment and exchange rate timing. By keeping the model tied to observable travel flows and spend variables, and then rechecking with operator feedback, we end up with a number that is easier to trace and repeat when the market shifts.


Key Questions Answered in the Report
How large could visitor spending become in Southeast Asia by 2031?
The region’s receipts are forecast to reach USD 67.41 billion by 2031, powered by an 11.27% CAGR.
Which destination shows the strongest medium-term growth?
Vietnam leads with a projected 13.22% CAGR through 2031, driven by visa reforms and infrastructure upgrades.
What share of tourism receipts come from domestic travelers?
Domestic journeys account for 63.72% of total spending, giving the market a stable revenue floor.
Why is the MICE segment critical now?
MICE arrivals grow at 13.92% CAGR and spend more per day than leisure tourists, lifting average yields.
How will gambling legalization affect Thailand’s positioning?
Casino-integrated resorts could attract high-roller segments and diversify Thailand’s product mix beyond beach leisure.
Is the competitive field easy for new entrants?
Yes, with the top firms holding a small share, the market remains open to innovators and niche specialists.
Page last updated on:


 Your data is secure and never sold or shared.


