Operational Technology (OT) Security Market Size and Share
Market Overview
| Study Period | 2020 - 2031 |
|---|---|
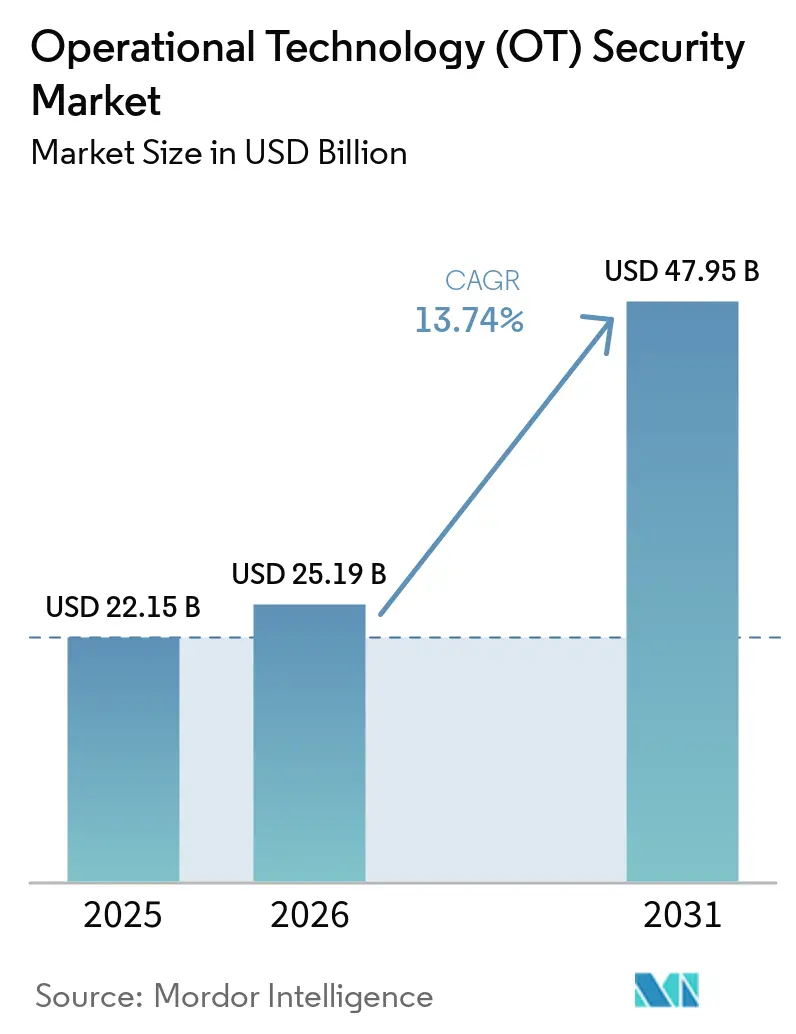
| Market Size (2026) | USD 25.19 Billion |
| Market Size (2031) | USD 47.95 Billion |
| Growth Rate (2026 - 2031) | 13.74% CAGR |
| Fastest Growing Market | Asia Pacific |
| Largest Market | North America |
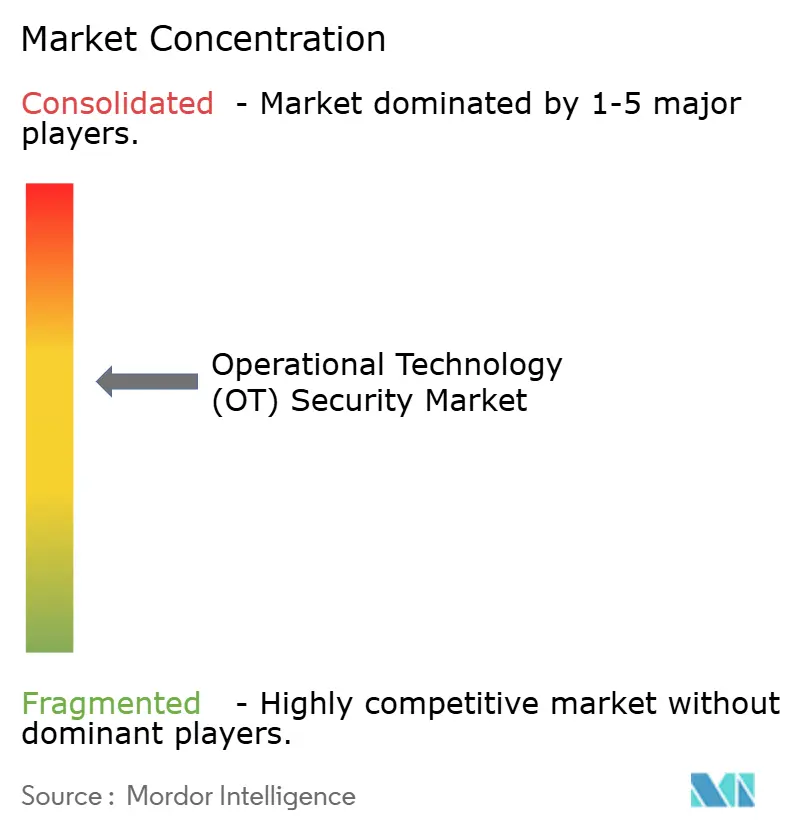
| Market Concentration | Medium |
Major Players *Disclaimer: Major Players sorted in no particular order Image © Mordor Intelligence. Reuse requires attribution under CC BY 4.0. | |
Operational Technology (OT) Security Market Analysis by Mordor Intelligence
The operational technology (OT) security market size is expected to grow from USD 22.15 billion in 2025 to USD 25.19 billion in 2026 and is forecast to reach USD 47.95 billion by 2031 at 13.74% CAGR over 2026-2031. Widespread digitalization of critical infrastructure exposed formerly isolated industrial control systems to internet-based threats, prompting urgent investment in layered cyber defense. Manufacturing accounted for 25.7% of reported industrial cyber incidents in 2023–2024, highlighting the sector’s vulnerability to ransomware, wiper malware, and state-sponsored sabotage. Geopolitical tension compounded risk: state-aligned groups increased attacks on energy, transport, and water assets by 49% during 2024. Regulatory pressure accelerated spending; North American pipeline operators must now report incidents within 12 hours to CISA, driving uptake of continuous-monitoring platforms. Platform consolidation gained momentum because the EU NIS2 Directive requires “state-of-the-art” controls across supply chains, encouraging buyers to shift from point tools to integrated offerings. Simultaneously, the shortage of OT-specific cyber talent pushed many operators toward managed detection and response services that combine AI analytics with 24/7 incident handling.[1]CISA, “Secure by Demand: Priority Considerations for Operational Technology Owners and Operators,” cisa.gov
Key Report Takeaways
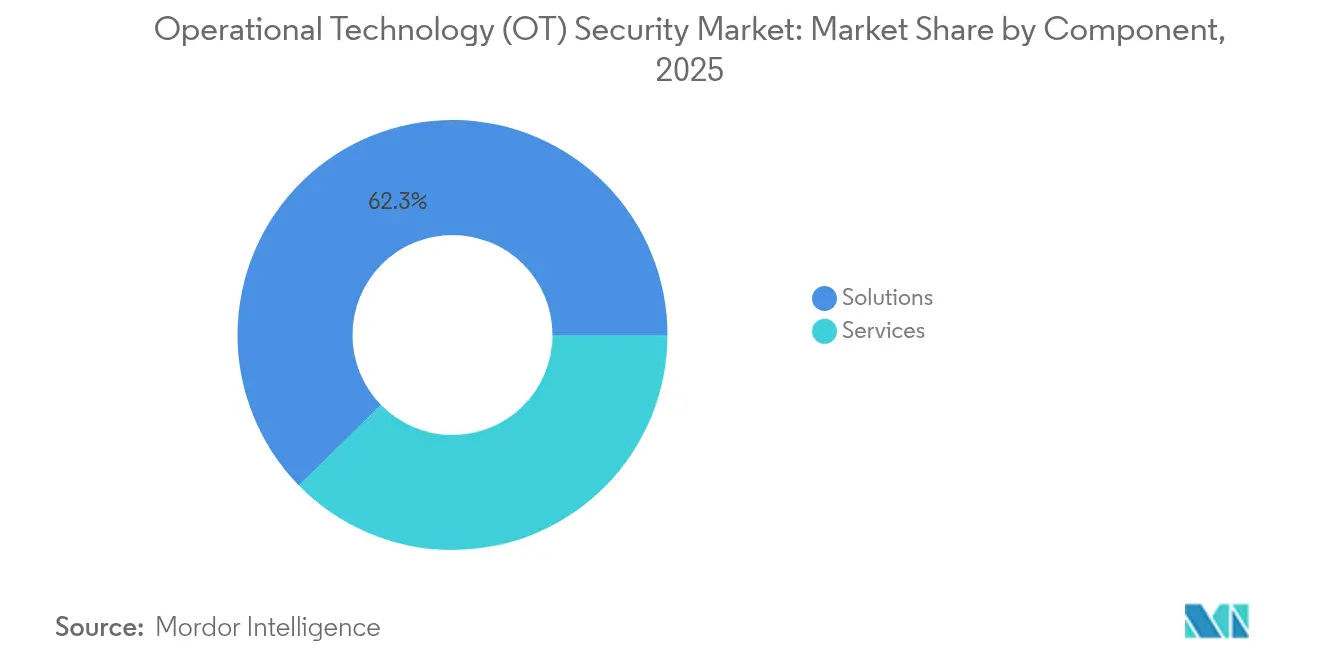
- By component, solutions held 62.34% of operational technology (OT) security market share in 2025, while services are projected to expand at an 17.92% CAGR to 2031.
- By deployment mode, on-premises retained 70.42% revenue share in 2025; cloud deployments record the fastest projected CAGR at 20.85% through 2031.
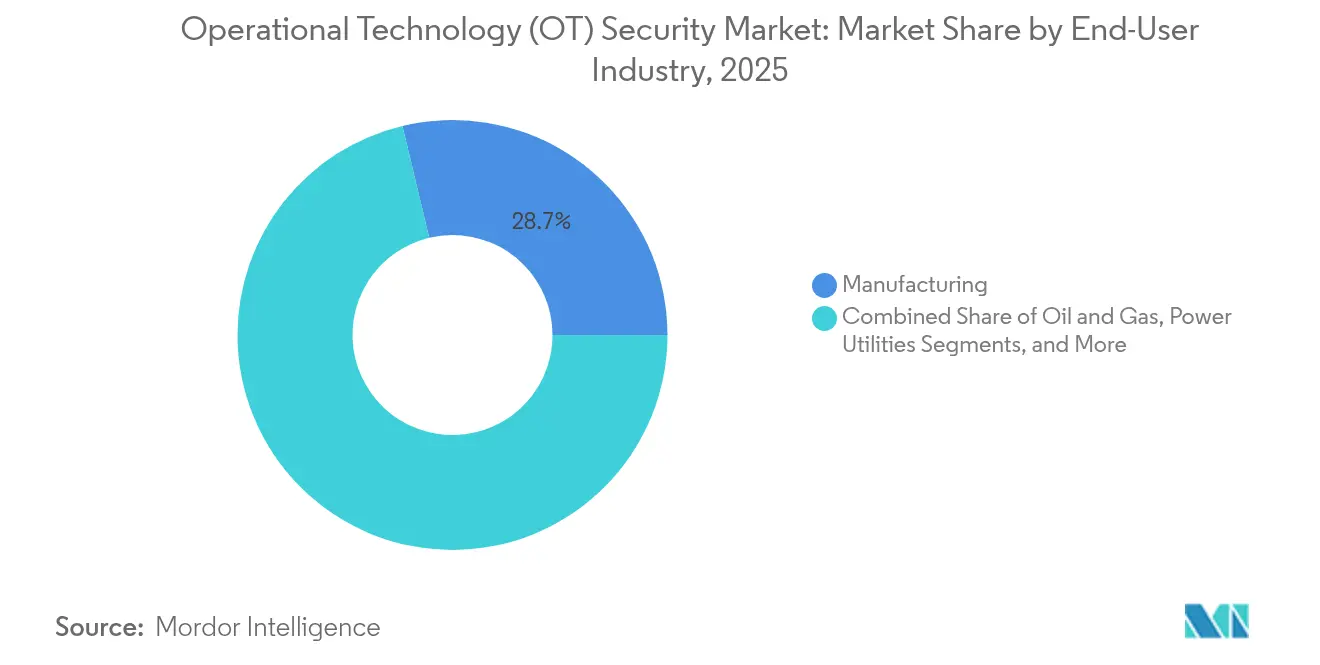
- By end-user industry, manufacturing led with 28.74% of the operational technology security market share in 2025; power utilities are advancing at a 19.35% CAGR through 2031.
- By security layer, network monitoring captured 46.05% share of the OT security market size in 2025, while identity and access management is growing at 21.3% CAGR.
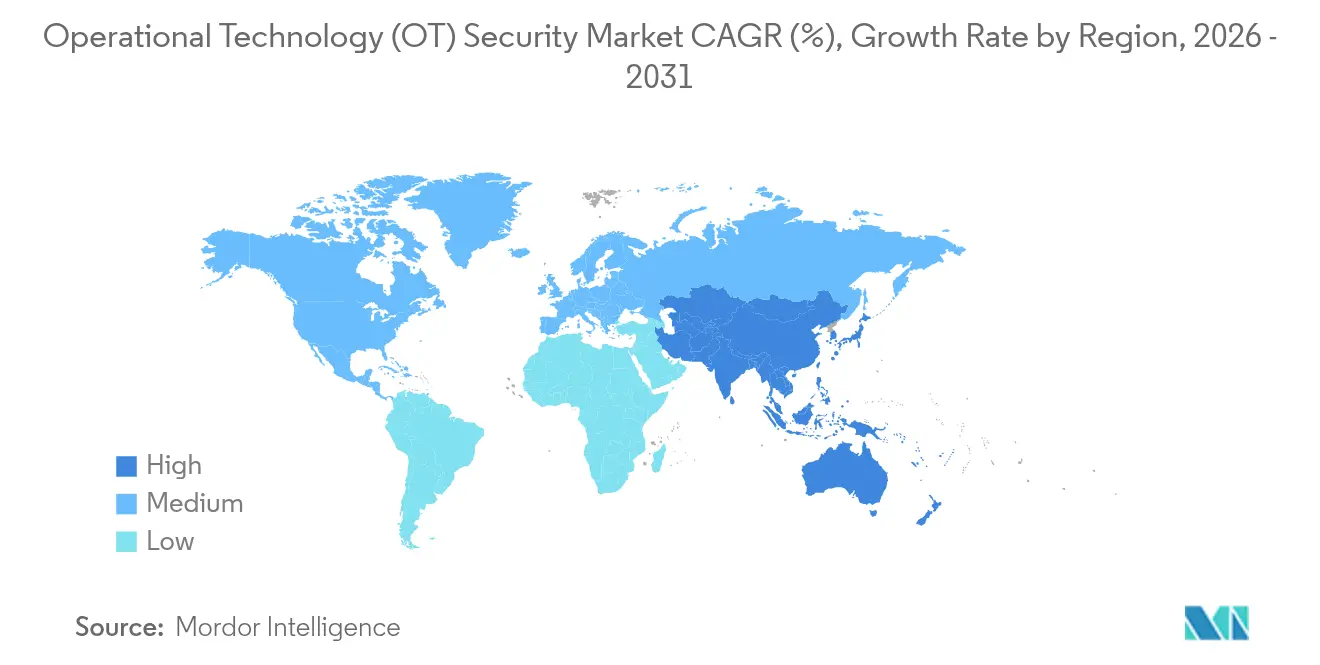
- By geography, North America commanded a 38.15% share in 2025; Asia-Pacific is forecast to grow at a 19.75% CAGR between 2026-2031.
Note: Market size and forecast figures in this report are generated using Mordor Intelligence’s proprietary estimation framework, updated with the latest available data and insights as of 2026.
Global Operational Technology (OT) Security Market Trends and Insights
Drivers Impact Analysis*
| Driver | (~) % Impact on CAGR Forecast | Geographic Relevance | Impact Timeline |
|---|---|---|---|
| Surge in cyberattacks on critical infrastructure | +3.2% | Global | Short term (≤ 2 years) |
| Convergence of IT and OT networks expanding attack surface | +2.8% | North America and the EU | Medium term (2-4 years) |
| Stricter global/regional regulations and standards | +2.1% | EU primary, North America secondary | Medium term (2-4 years) |
| Rapid Industry 4.0 / IIoT adoption in process industries | +1.9% | APAC core, spill-over to global | Long term (≥ 4 years) |
| Insurance underwriting requirements linking premiums to OT-security posture | +1.4% | North America and the EU | Medium term (2-4 years) |
| Emergence of plant-level zero-trust reference architectures | +1.1% | Global | Long term (≥ 4 years) |
| Source: Mordor Intelligence | |||
Surge in Cyber-Attacks on Critical Infrastructure
Water utilities disclosed 400 exposed web interfaces in mid-2025, illustrating the scale of unsecured industrial assets. Sophisticated malware such as IOCONTROL targeted programmable logic controllers to enable covert manipulation of process variables. AI-driven anomaly-detection tools gained traction because rule-based systems struggled to recognize previously unseen behaviours. Beyond operational downtime, attacks produced cascading supply-chain disruption that affected adjacent sectors such as chemicals and transport.
Convergence of IT and OT Networks Expanding Attack Surface
Eighty percent of manufacturers experienced more security incidents after integrating enterprise IT resources with plant networks in 2024. Cloud analytics and predictive-maintenance workloads improved productivity but simultaneously exposed legacy protocols lacking authentication. Hybrid security operations centres that fuse IT and OT expertise became a strategic imperative, supported by network segmentation and asset-discovery engines that maintain real-time inventories of controllers, sensors, and gateways.
Stricter Global/Regional Regulations and Standards
The EU NIS2 Directive, effective October 2024, imposed incident-reporting deadlines of 24 hours and penalties up to EUR 10 million (USD 11.5 billion) for non-compliance. In the United States, updated TSA pipeline directives require automated reporting feeds from SCADA environments to CISA. Because both frameworks demand “state-of-the-art” security, operators replaced isolated sensors and firewalls with integrated platforms featuring continuous monitoring, encrypted remote access, and supply-chain risk assessment.
Rapid Industry 4.0 / IIoT Adoption in Process Industries
Connected production lines leveraging 5G, edge computing, and time-sensitive networking boosted throughput and predictive-maintenance accuracy, yet introduced fresh vulnerabilities to clock-synchronization attacks. Pharmaceutical plants had to secure remote quality-control labs and comply with FDA data-integrity guidelines concurrently. Vendors that embedded zero-trust identity controls at the device layer gained a competitive advantage.
Restraints Impact Analysis*
| Restraint | (~) % Impact on CAGR Forecast | Geographic Relevance | Impact Timeline |
|---|---|---|---|
| High implementation and lifecycle cost of OT security platforms | -2.1% | Global, acute in emerging markets | Medium term (2-4 years) |
| Legacy system and protocol compatibility limitations | -1.8% | Global, concentrated in mature industrial regions | Long term (≥ 4 years) |
| Budget deprioritisation at small/mid-size industrial sites | -1.3% | Global, particularly acute in APAC and MEA | Short term (≤ 2 years) |
| Shortage of OT-specific cyber-talent and field engineers | -1.1% | Global, severe in North America and the EU | Long term (≥ 4 years) |
| Source: Mordor Intelligence | |||
High Implementation and Lifecycle Cost of OT Security Platforms
Comprehensive OT security programs require multi-million-dollar outlays spanning hardware sensors, license fees, and multi-year maintenance contracts. Smaller electric utilities relied on the USD 250 million Rural and Municipal Advanced Cybersecurity Grant to offset adoption costs. Custom integration and prolonged factory-acceptance testing inflated the total cost of ownership, encouraging phased rollouts that can leave critical assets unprotected during transition.
Legacy System and Protocol Compatibility Limitations
Controllers deployed 15–20 years ago often lack encryption or user authentication, forcing operators to install protocol gateways that introduce latency and new failure modes. Pharma facilities struggled to meet current good manufacturing practice rules while retrofitting security on validated machinery. Continuous-process industries avoided downtime, making security upgrades dependent on scheduled plant turnarounds, which elongate remediation cycles.
*Our forecasts treat driver/restraint impacts as directional, not additive. The impact forecasts reflect baseline growth, mix effects, and variable interactions.
Segment Analysis
By Component: Services Accelerate Platform Adoption
Solutions accounted for 62.34% revenue in 2025 because asset-discovery engines, intrusion-detection appliances, and segmentation gateways form the backbone of any operational technology security market program. However, services are rising at an 17.92% CAGR through 2031 as operators lean on managed detection, incident response, and compliance audits to offset the cyber-talent gap. Vendors now bundle outcome-based contracts that guarantee mean-time-to-detect thresholds and support around-the-clock SOC monitoring.
Industrial firms increasingly treat cyber resilience as an operational key-performance indicator rather than a capital project. Managed OT SOC offerings deliver scalable expertise without inflating headcount, while professional-services teams customize zero-trust architectures across heterogeneous controllers from Siemens, ABB, and Emerson. This shift underpins platform stickiness because continuous services embed vendor staff inside plants, discouraging technology swaps and stabilizing recurring revenue within the operational technology (OT) security market.


By Deployment Mode: Cloud Adoption Accelerates Despite Security Concerns
On-premises deployments dominated early rollouts due to latency sensitivities and data-sovereignty rules, capturing 70.42% share of the operational technology (OT) security market in 2025. Yet cloud-delivered analytics and configuration management are expanding at a 20.85% CAGR as hyperscalers achieve IEC 62443 and ISO 27001 certifications. Smaller manufacturers leverage consumption-based pricing to avoid capital expenditure while accessing advanced AI threat-correlation engines.
Hybrid architectures prevail, sensitive process variables remain inside the plant DMZ, whereas encrypted telemetry feeds behavioural indicators to cloud SOCs for long-term trending, threat-intelligence enrichment, and forensic search. As confidence grows, operators migrate historian backups, firmware repositories, and vulnerability-scanning workloads to the cloud, a trend expected to raise the operational technology security market size attributable to SaaS platforms.
By End-User Industry: Power Utilities Drive Fastest Growth
Manufacturing led spending with 28.74% of operational technology security market share in 2025, reflecting a high incidence of ransomware on automotive, electronics, and consumer-goods lines. Plants embraced inline intrusion-detection and segmentation gateways to safeguard just-in-time workflows and quality-control records.
The power sector is scaling fastest at a 19.35% CAGR as grid-modernization and renewables integration expose legacy substations to IP networking. NERC CIP audits incentivize utilities to deploy device identity vaults, secure remote maintenance and anomaly-detection analytics, lifting the operational technology security market size for electric-sector offerings. Water and wastewater utilities are following, driven by federal guidance on basic hygiene, such as multifactor authentication and patch-management metrics.
By Security Layer: Identity Management Gains Momentum
Network monitoring and anomaly-detection sensors captured 46.05% share of the operational technology (OT) security market spend in 2025 because visibility remains the foundational control. Deep-packet-inspection engines baseline Modbus, Profinet, and OPC UA traffic, allowing rapid flagging of malicious write commands or rogue firmware uploads.
Zero-trust initiatives elevated identity-and-access-management to the fastest-growing layer at 21.3% CAGR. Device certificates, privileged-access workstations, and role-based entitlements limit lateral movement if perimeter controls fail. As multi-factor authentication extends to engineering-workstation logins, operators allocate more budget to directory services, policy-enforcement engines, and just-in-time credential brokers, expanding the share of the operational technology security market devoted to identity controls.
Geography Analysis
North America retained leadership with 38.15% share of the operational technology (OT) security market's 2025 revenue after headline attacks on pipelines, food processors, and local water districts drove bipartisan investment in critical-infrastructure defense. TSA directives obligate energy-pipeline operators to continuously monitor SCADA traffic and report anomalies within 12 hours. Canada invested in cybersecurity frameworks for hydroelectric dams, while Mexican automotive corridors boosted SOC outsourcing agreements.
Asia-Pacific delivered the highest growth trajectory, with the operational technology security market size expanding at a 19.75% CAGR between 2026-2031. China modernized its petrochemical and rail systems with 5 G-connected sensors, India mandated CERT-In incident reporting for power plants and smart-city projects, and Japan reinforced its nuclear-plant control systems against geopolitical disruption. ASEAN countries leveraged foreign direct investment to incorporate IEC 62443 assessments from project inception, sidestepping legacy-retrofit challenges.
Europe maintained steady momentum as the NIS2 Directive widened compliance scope to thousands of medium-sized industrial firms. Germany established state subsidies for SME machine-builders adopting secure-by-design PLCs, the UK’s Critical National Infrastructure Centre published procurement checklists for secure remote-access gateways, and Italy accelerated renewables integration, demanding secure inverter telemetry. Eastern European utilities prioritized the segmentation of legacy substations, lifting regional demand within the operational technology security market.

Competitive Landscape
The operational technology security market remains moderately fragmented. Broad-spectrum network-monitoring vendors such as Claroty, Dragos, Nozomi Networks, and Armis strengthened their positions through partnerships with automation majors ABB, Siemens, Schneider. Hardware-centric suppliers like Fortinet and Cisco embedded deep-packet inspection into ruggedized firewalls, while Microsoft extended Defender for IoT to Azure Arc-enabled factories.
AI-centric challengers gained share by automating root-cause triage. Darktrace applied self-learning models to detect subtle analog signal deviations that traditional rules missed, triggering autonomous policy enforcement. Nozomi Networks secured USD 100 million Series E funding in 2024 to accelerate R&D on cloud-based asset intelligence and expand global MSSP alliances.[4]Nozomi Networks, “Nozomi Networks Secures $100 Million Investment,” nozominetworks.com
Managed-service providers (MSPs) capitalized on persistent talent shortages. Rockwell Automation, Honeywell, and Accenture launched co-managed OT SOC offerings bundling 24/7 monitoring, incident response, and regulatory reporting portals. Market leadership is beginning to consolidate around suppliers capable of unifying asset inventory, anomaly detection, device identity, and workflow orchestration within a single license, boosting platform stickiness and recurring revenue stability across the operational technology security market.
Operational Technology (OT) Security Industry Leaders
Fortinet Inc.
Nozomi Networks Inc.
Claroty Ltd.
Honeywell International Inc.
Siemens Aktiengesellschaft (Siemens AG)
- *Disclaimer: Major Players sorted in no particular order

Recent Industry Developments
- June 2025: Industrial Cyber reported 400 exposed U.S. water-facility interfaces, triggering coordinated mitigation across federal and state agencies.
- February 2025: Gartner released the first cyber-physical systems vendor ranking, placing Claroty, Nozomi, and Dragos in the leadership tier.
- January 2025: CISA published “Secure by Demand” procurement guidance for OT owners, emphasizing logging, secure-by-default configurations and vulnerability-management features.
- October 2024: EU NIS2 Directive entered force, introducing penalties up to EUR 10 million for essential-service operators failing to implement ten minimum cybersecurity measures.


Research Methodology Framework and Report Scope
Market Definitions and Key Coverage
Our study defines the operational technology security market as the annual revenue earned by vendors that provide hardware, software, and managed services designed to monitor, protect, and restore industrial control systems, SCADA, and other plant-floor assets that run critical infrastructure and manufacturing operations.
Clearly outside scope: General IT endpoint protection and stand-alone network firewalls not purpose-built for OT environments.
Segmentation Overview
- By Component
- Solutions
- Services
- By Deployment Mode
- On-Premises
- Cloud
- By End-User Industry
- Manufacturing
- Oil and Gas
- Power Utilities
- Transportation and Logistics
- Chemicals and Pharma
- Mining and Metals
- By Security Layer
- Network Monitoring and Anomaly Detection
- Endpoint / Device Security
- Identity and Access Management
- Secure Remote Access and Segmentation Gateways
- Governance, Risk and Compliance Platforms
- By Geography
- North America
- United States
- Canada
- Mexico
- South America
- Brazil
- Argentina
- Rest of South America
- Europe
- Germany
- United Kingdom
- France
- Italy
- Spain
- Nordics
- Benelux
- Russia
- Rest of Europe
- Asia-Pacific
- China
- Japan
- India
- South Korea
- ASEAN
- Rest of Asia-Pacific
- Middle East and Africa
- Middle East
- GCC
- Turkey
- Israel
- Rest of Middle East
- Africa
- South Africa
- Rest of Africa
- Middle East
- North America
Detailed Research Methodology and Data Validation
Primary Research
We next interview OT engineers at utilities, refinery cybersecurity leads, solution integrators, and regional regulators across North America, Europe, and emerging Asia. Their insights validate average per-site security budgets, license renewal cycles, and the pace at which cloud-hosted detection platforms replace on-prem tools, letting us fine-tune assumptions surfaced during desk work.
Desk Research
Analysts first compile foundational signals from open public sources such as US Cybersecurity & Infrastructure Security Agency advisories, ENISA threat reports, US Energy Information Administration infrastructure statistics, Japan's METI smart-factory guidelines, and IEC 62443 working drafts, which illuminate asset counts, attack frequency, and regulatory deadlines. Company 10-Ks, investor decks, and trade-association white papers then anchor vendor revenue splits and deployment patterns. Subscription datasets from D&B Hoovers and Dow Jones Factiva enrich financial trails and news flow for rapidly expanding suppliers. This documented evidence base lets us benchmark spend against installed OT device stock, regional CAPEX, and mandatory compliance outlays. The sources listed are illustrative; many additional databases and public filings support every data point we retain.
Market-Sizing & Forecasting
A top-down reconstruction begins with national counts of connected OT nodes and estimated security spend per node, followed by penetration-rate adjustments for maturity tiers. Supplier roll-ups of sampled ASP-times-volume, plus channel checks, act as a bottom-up sense check of totals before figures are locked. Key variables feeding our multivariate regression forecast include growth in IIoT device stock, incident disclosure frequency, regulatory penalty ceilings, Industry 4.0 capital spending, average remediation cost per breach, and regional electricity generation additions. Where vendor disclosures are missing, spend per node is imputed from peer clusters and reconciled against primary research quotes.
Data Validation & Update Cycle
Before release, a second analyst audits anomaly flags that compare our model to historical attack-volume curves and macro infrastructure outlays. Significant divergences trigger re-contact of at least one subject-matter expert. Reports refresh annually, and we push interim updates when material events, such as landmark regulations or major exploits, shift baseline demand.
Why Mordor's Operational Technology Security Baseline Commands Reliability
Published estimates often vary because publishers choose different scopes, currencies, and refresh cadences.
We acknowledge those inevitable gaps upfront, then show how disciplined variable selection keeps our baseline steady yet responsive.
Benchmark comparison
| Market Size | Anonymized source | Primary gap driver |
|---|---|---|
| USD 22.15 B (2025) | Mordor Intelligence | |
| USD 23.47 B (2025) | Global Consultancy A | Includes broader IT security revenue pools and counts non-industrial sectors, inflating base |
| USD 27.03 B (2025) | Regional Research Firm B | Derives totals from survey-based cybersecurity budgets without reconciling to vendor revenue audits |
In sum, our mix of verifiable regulatory data, vendor revenue trails, and on-ground interviews gives decision-makers a balanced, transparent baseline that traces every dollar to observable assets and repeatable steps, something broader or survey-only models struggle to match.


Key Questions Answered in the Report
What is forecast value of the operational technology (OT) security market by 2031?
The operational technology (OT) security market size is expected to grow from USD 25.19 billion in 2026 and is forecast to reach USD 47.95 billion by 2031
Which region is expanding fastest?
Asia-Pacific is forecast to grow at a 19.75% CAGR from 2026-2031 thanks to large-scale smart-manufacturing investments, 5G industrial deployments, and government mandates for critical-infrastructure protection.
Why are identity-and-access-management tools gaining momentum in OT environments?
Zero-trust architectures require continuous verification of users and devices, making certificate-based authentication and privileged-access controls the fastest-growing security layer at a 21.3% CAGR.
How are cost constraints being addressed for smaller utilities and manufacturers?
Federal grants such as the USD 250 million Rural and Municipal Advanced Cybersecurity Grant and cloud-delivered SOC services allow operators with limited budgets to access enterprise-grade protections without extensive capital expenditure.
What competitive factors differentiate leading vendors?
Winners combine deep-packet-inspection visibility, AI-driven anomaly detection, device identity governance, and global managed-services delivery, often within an ecosystem of industrial-automation partnerships that accelerate deployment.
How do new regulations change procurement priorities?
Frameworks like TSA pipeline directives and NIS2 require “state-of-the-art” controls and continuous monitoring, leading buyers to favor platforms with built-in compliance dashboards, automated reporting, and supply-chain risk-assessment modules.
Page last updated on:


