Online Fine Art Market Size and Share
Market Overview
| Study Period | 2020 - 2031 |
|---|---|
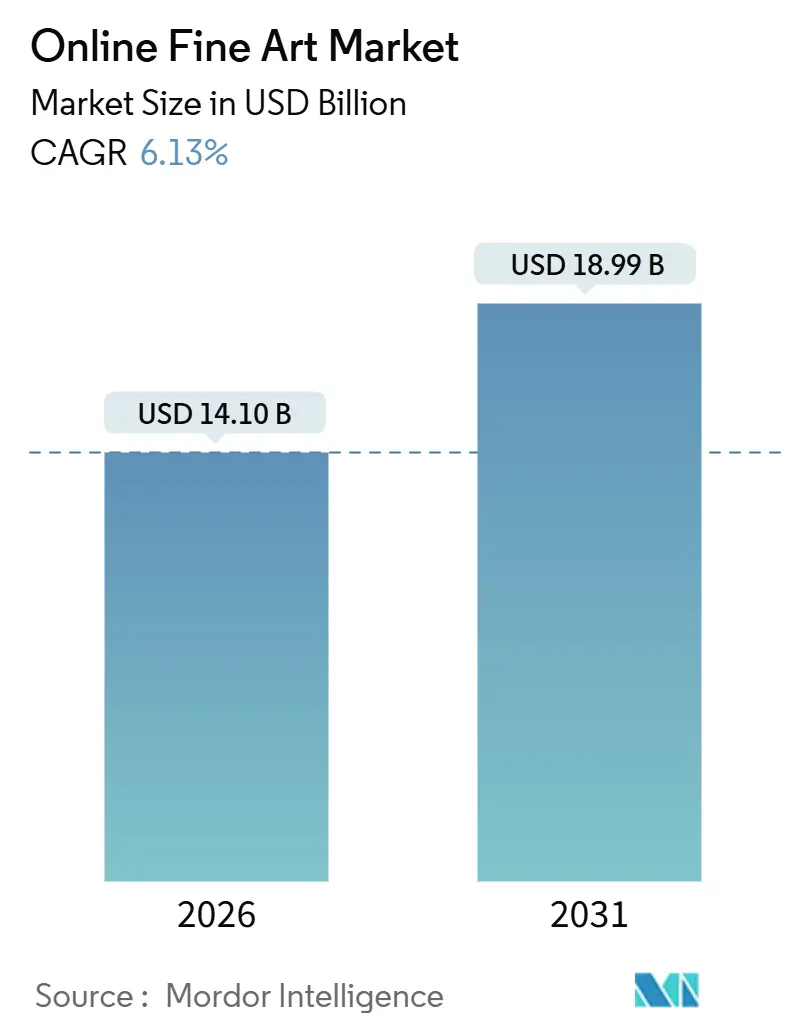
| Market Size (2026) | USD 14.10 Billion |
| Market Size (2031) | USD 18.99 Billion |
| Growth Rate (2026 - 2031) | 6.13% CAGR |
| Fastest Growing Market | Asia Pacific |
| Largest Market | Asia Pacific |
| Market Concentration | Medium |
Major Players*Disclaimer: Major Players sorted in no particular order Image © Mordor Intelligence. Reuse requires attribution under CC BY 4.0. | |
Online Fine Art Market Analysis by Mordor Intelligence
The online fine art market size stood at USD 14.1 billion in 2026 and is projected to reach USD 18.99 billion by 2031, advancing at a 6.13% CAGR. This upward trajectory reflects how blockchain-verified provenance, fractional ownership platforms, and AI recommendation engines are widening collector entry points while sustaining price discovery for high-value works. Robust digital bidding - 82% of Christie’s first-half 2024 bids came through the web - continues to anchor sales even as in-person events rebound. Asia Pacific leads regional momentum, sovereign wealth-backed initiatives in the Gulf diversify demand, and mid-tier collectors accelerate spending in the USD 250,000–1 million band. However, cyber-fraud incidents and stricter export regulations temper growth prospects by raising compliance and insurance costs. Competitive intensity remains high because legacy auction houses, dealer aggregators, fractional platforms, and social commerce channels all target overlapping price tiers.
Key Report Takeaways
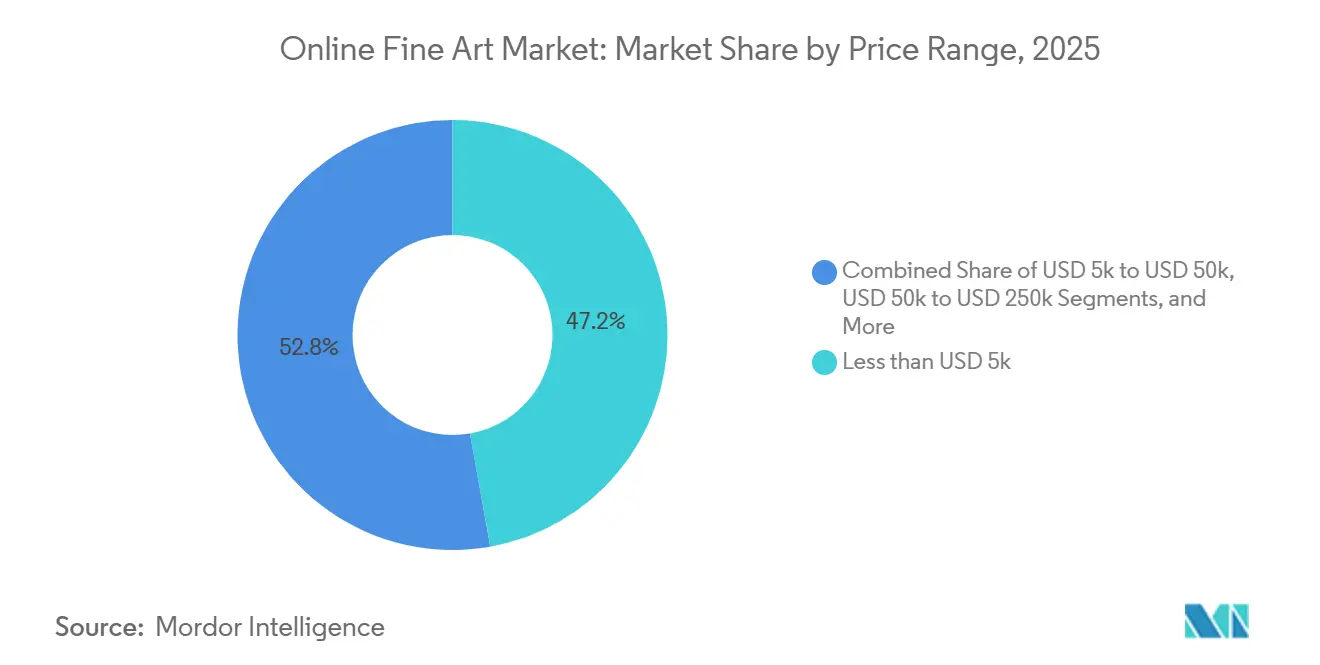
By price range, works under USD 5,000 captured 47.19% of 2025 revenue, while the USD 250,000–1 million tier is forecast to expand at a 7.21% CAGR through 2031.
By channel, online-only auctions held 52.22% of 2025 revenue, whereas third-party dealer platforms are expected to record a 6.54% CAGR to 2031.
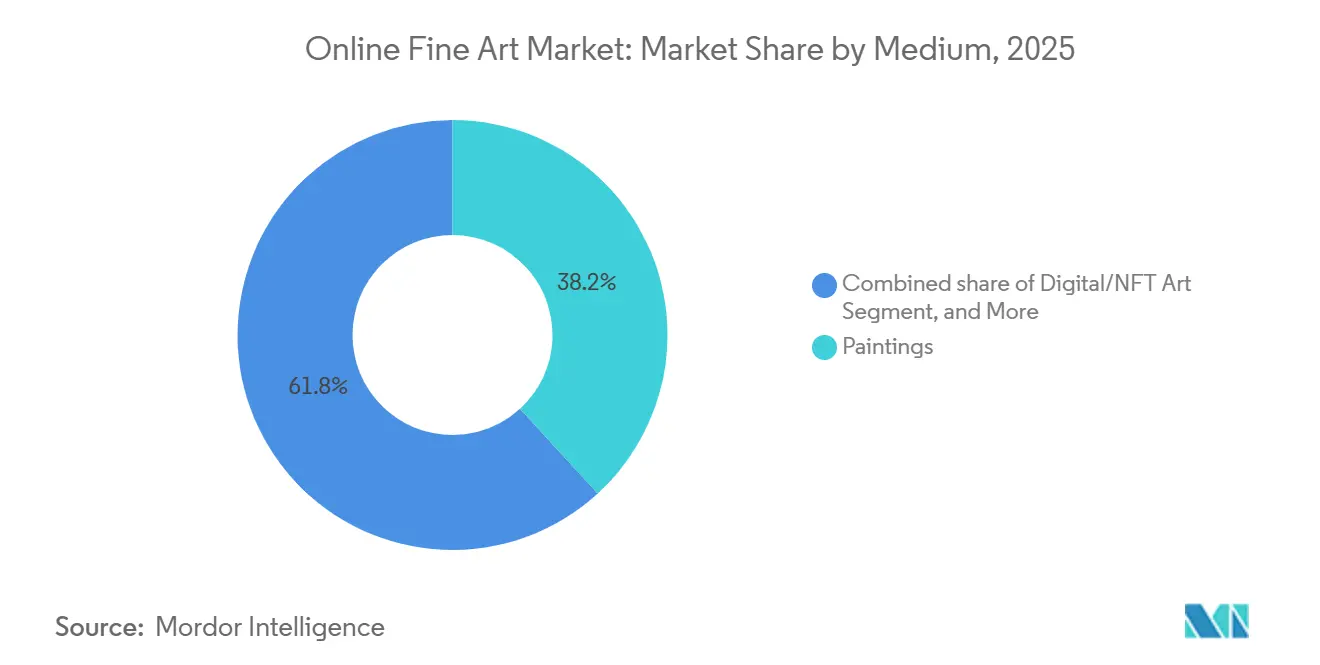
By medium, paintings retained 38.19% of 2025 revenue and digital and NFT art is projected to rise at a 6.89% CAGR over the forecast period.
By sector, Post-War and Contemporary works accounted for 46.26% of 2025 revenue and are poised for 7.01% CAGR growth through 2031.
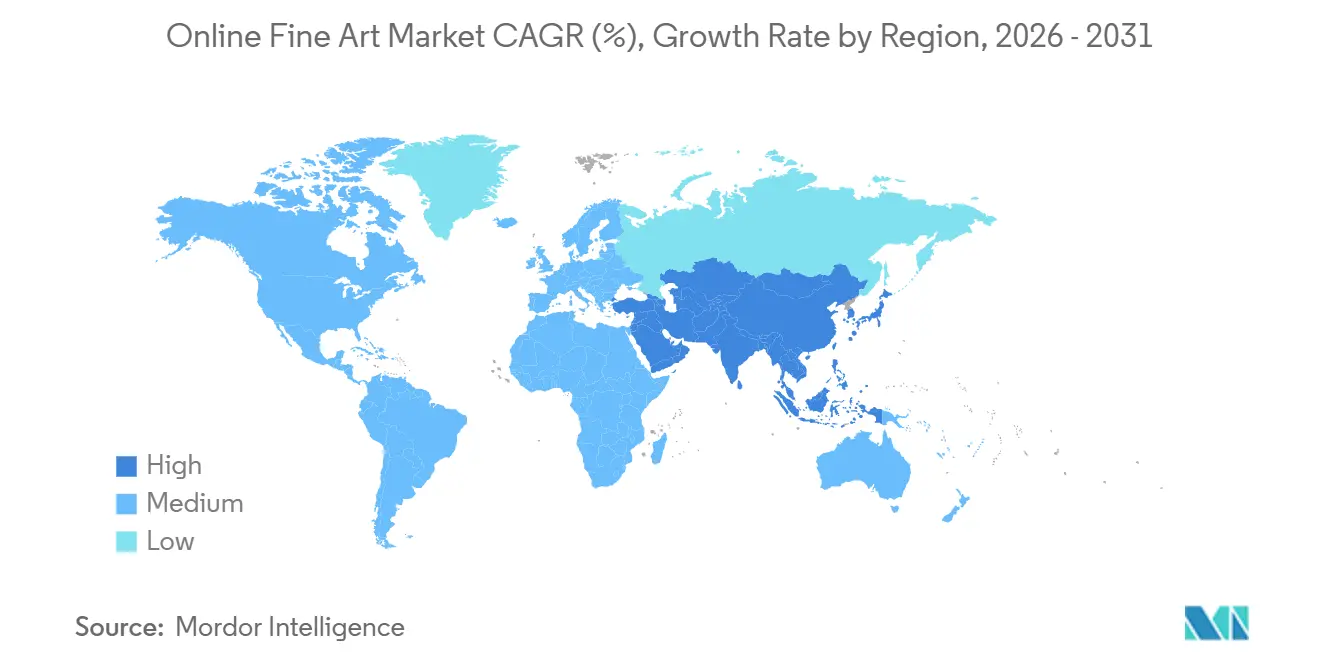
By geography, Asia Pacific commanded 39.57% of 2025 revenue and is projected to grow at a regional-leading 7.34% CAGR to 2031.
Note: Market size and forecast figures in this report are generated using Mordor Intelligence’s proprietary estimation framework, updated with the latest available data and insights as of January 2026.
Global Online Fine Art Market Trends and Insights
Drivers Impact Analysis*
| Driver | (~) % Impact on CAGR Forecast | Geographic Relevance | Impact Timeline |
|---|---|---|---|
| Rising Convenience and Cross-Border Accessibility | +1.20% | Global, with concentration in Asia Pacific and North America | Medium term (2-4 years) |
| Increasing Art-as-Investment Returns | +0.90% | North America, Europe, Asia Pacific UHNWI hubs | Long term (≥ 4 years) |
| NFT and Blockchain-Enabled Provenance | +0.80% | Global, early adoption in North America and Europe | Medium term (2-4 years) |
| Social-Media-Driven Discovery and Influencer Sales | +1.10% | Global, strongest in Asia Pacific and North America | Short term (≤ 2 years) |
| Fractional Ownership Platforms Widening Investor Base | +0.70% | North America and Europe core, expanding to Asia Pacific | Medium term (2-4 years) |
| AI-Powered Curation Boosting Conversion Rates | +0.60% | Global, platform-dependent adoption | Short term (≤ 2 years) |
| Source: Mordor Intelligence | |||
Rising Convenience and Cross-Border Accessibility
Online bidding platforms remove geographic and temporal barriers, letting collectors in Seoul, São Paulo, and Singapore vie for pieces housed in London or New York. Christie’s logged 82% of first-half 2024 bids online, proving that the digital channel deepens the buyer pool and drives more efficient price discovery.[1]Christie’s, “First Half 2024 Results,” christies.com Integrated multi-currency settlement tools, transparent import-duty calculations, and last-mile logistics have eased the friction that once deterred international art buyers. Hong Kong’s zero-tariff regime further positions it as an entrepôt for mainland Chinese and Southeast Asian collectors. Cross-border momentum also widens supply because sellers recognize they can reach global demand without consigning to a physical sale. As a result, participants in the online fine art market allocate larger budgets to digital marketing campaigns targeting regions with foreign-exchange gains.
NFT and Blockchain-Enabled Provenance
Immutable ledgers help close long-standing provenance gaps by recording each ownership transfer on-chain, which reduces forgery risk and supports fractional securitization. Ethereum’s 2022 move to proof-of-stake cut transaction energy usage by over 99%, softening ESG pushback and paving the way for institutional adoption.[2]Ethereum Foundation, “The Merge: Proof-of-Stake,” ethereum.org Adobe, Microsoft, and BBC backed the C2PA standard in 2024, embedding cryptographic metadata within image files to prove authenticity.[3]Coalition for Content Provenance and Authenticity, “C2PA Standard v2.0,” c2pa.org Artsy began issuing blockchain certificates for select galleries in 2025, enabling buyers to track exhibition history digitally. These advances shift blockchain from a speculative NFT toy toward a compliance tool that mainstream collectors can accept. They also accelerate liquidity because asset-backed tokens can be traded more rapidly than physical consignments.
Social-Media-Driven Discovery and Influencer Sales
Instagram and TikTok have flattened the discovery funnel. Hiscox reported that more than 40% of first-time online buyers found art through social channels in 2024. Direct-to-collector posts, time-limited drops, and influencer endorsements stimulate impulse purchases below USD 5,000, giving platforms steady volume and customer-lifetime conversion data. The Cleveland Museum of Art said its TikTok presence lifted website traffic by 30% in 2023, confirming that institutional content drives younger demographics toward paid memberships. Platforms now combine behavioural data with image-recognition AI to curate personalized feeds, increasing engagement but risking stylistic echo chambers. Balancing algorithmic relevance with serendipity remains an ongoing challenge.
Increasing Art-as-Investment Returns
Ultra-high-net-worth investors view art as a hedge against inflation and public-market volatility. The Art Basel and UBS Global Art Market Report 2025 noted 804,000 transactions under USD 5,000 in 2024, indicating appetite at the entry level, while institutional buyers concentrated in the USD 250,000–1 million band pursue capital appreciation. Fractional platforms such as Masterworks, which reported 900,000 users in 2025, democratize allocation by allowing retail investors to purchase equity slices in blue-chip works, further enhancing liquidity. Broader participation improves depth on both buy and sell sides, stabilizing prices and reinforcing art’s correlation profile relative to equities.
Restraints Impact Analysis*
| Restraint | (~) % Impact on CAGR Forecast | Geographic Relevance | Impact Timeline |
|---|---|---|---|
| Cyber-Fraud and Data-Breach Concerns | -0.60% | Global, with higher exposure in North America and Europe | Short term (≤ 2 years) |
| Re-Opening of Physical Galleries and Auctions | -0.50% | Europe and North America core, moderate in Asia Pacific | Medium term (2-4 years) |
| Cross-Border Cultural-Property Export Restrictions | -0.40% | Global, concentrated in Europe, Middle East, and Asia | Long term (≥ 4 years) |
| Blockchain Energy Footprint and ESG Backlash | -0.30% | Global, strongest scrutiny in Europe | Medium term (2-4 years) |
| Source: Mordor Intelligence | |||
Cyber-Fraud and Data-Breach Concerns
The USD 114 million Incase phishing theft in 2024 exposed email spoofing vulnerabilities targeting high-value transfers. Sotheby’s faced a counterfeit wine suit the same year, illustrating reputational hazards when authentication fails. Wire transactions favoured for high-ticket art lack standardized tokenization, and the Payment Card Industry mandate does not cover them completely. Insurance premiums have risen, and platforms now push multi-factor authentication and blockchain escrow. The Art Loss Register opened an API in 2025 for real-time stolen-work checks, but adoption is voluntary, leaving coverage gaps.
Re-Opening of Physical Galleries and Auctions
Art Basel Miami Beach drew 80,000 visitors in 2024, up 15% from 2023, and Frieze London reported similar gains, showing renewed appetite for tactile viewing experiences. Collectors spending above USD 50,000 value colour accuracy and condition validation that web images cannot fully provide. Hybrid sales, livestreamed auctions accepting online and in-room bids, offer a bridge but require dual investment in broadcast technology and hospitality. As foot traffic climbs, online platforms must innovate to preserve share of wallet, especially for higher price brackets where trust and personalized advisory weigh heavily.
*Our forecasts treat driver/restraint impacts as directional, not additive. The impact forecasts reflect baseline growth, mix effects, and variable interactions.
Segment Analysis
By Price Range: Volume at Entry Level, Velocity in Mid-Tier
The online fine art market size for works under USD 5,000 commanded 47.19% of 2025 revenue, fuelled by impulse purchases and social-media discovery. Platforms drive margins through high-frequency processing, even if take-rates are modest. The USD 5,000–50,000 tier captures collectors upgrading their portfolios, while the USD 50,000–250,000 bracket attracts advisors who demand documented provenance and condition reports. The USD 250,000–1 million tier is forecast to log a 7.21% CAGR, signifying capital migration from equities and real estate toward portable cultural assets. Above USD 1 million, private-sale desks and premier auction houses still dominate because sellers prefer discretionary marketing and guaranteed minimums over public listings.
Collectors demonstrate willingness to bypass starter segments entirely by allocating directly into mid-six-figure works, reflecting wealth creation among technology entrepreneurs and finance professionals. Online fine art market share concentration increases as price bands rise because fewer platforms possess the trust to mediate million-dollar transfers. AI-driven valuation tools, condition-report video walkthroughs, and escrow protocols will decide which digital vendors succeed in the high-end arena.


By Channel: Auctions Retain Primacy, Aggregators Accelerate
Online-only auctions generated 52.22% of 2025 revenue and underpin the online fine art market size through competitive bidding and transparent price discovery. Christie’s harvested USD 2.1 billion in first-half 2024 sales even amid macro headwinds, underscoring sustained adoption. Third-party dealer platforms, including Artsy and Artnet, are projected to advance by 6.54% CAGR, outpacing auction houses by folding thousands of galleries into a single search interface. These aggregators harness network effects, while first-party gallery sites face rising customer-acquisition costs.
Hybrid auctions blend in-room excitement with real-time online bids, yet they require costly audiovisual setups and multilingual staff. Dealer platforms employ machine-learning curation that surfaces works tailored to browsing history, raising conversion rates but potentially limiting exposure to new styles. As the online fine art industry moves toward embedded finance, integrations with payment providers and logistics firms will further compress purchase friction.
By Medium: Paintings Anchor Trust, Digital Art Rebounds
Paintings accounted for a 38.19% share in 2025, confirming collectors’ enduring preference for physical, historically validated works. Liquidity in secondary markets and established appraisal methodologies make canvases the benchmark against which other media trade. Sculpture attracts corporate buyers seeking statement pieces for lobbies, while photography commands a smaller but stable demand.
Digital and NFT art are anticipated to climb at a 6.89% CAGR as blockchain verification, reduced energy footprints, and museum endorsements repair trust. Ethereum’s proof-of-stake transition and the C2PA watermark framework have mitigated environmental and authenticity concerns. Online fine art market share for digital media remains modest but growing, buoyed by token-gated utility such as VIP event access and real-time royalties for artists. The Metropolitan Museum of Art’s image-recognition AI, launched in 2024, delivers cross-medium authentication, further encouraging institutional buyers to experiment with digital acquisitions.
By Sector: Post-War and Contemporary Outpaces All Others
Post-War and Contemporary art captured 46.26% of 2025 revenue, propelled by living artists who cultivate Instagram followings that translate into direct sales. The online fine art market size for this sector is expected to expand at a 7.01% CAGR through 2031. Modern and Impressionist segments retain blue-chip appeal but face supply constraints as museum acquisitions throttle availability. Old Masters remain niche due to limited inventory and complex export rules, yet they attract specialist scholars and connoisseur collectors.
Social-media amplification and fractional investment products concentrate demand on Post-War Contemporary because shared ownership models resonate with younger patrons familiar with stock-market fractional shares. Liquidity is also higher because shorter holding periods are acceptable when artists actively market their own works.
Geography Analysis
Asia Pacific, commanding 39.57% of the 2025 revenue, is set to lead the online fine art market with a projected CAGR of 7.34% through 2031. The region's growth is driven by increasing digital adoption, rising disposable incomes, and a growing interest in fine art among younger demographics. Hong Kong, benefiting from a zero-tariff regime, solidifies its status as a free-port hub, attracting significant art trade and auction activities.
Meanwhile, Singapore and Seoul are emerging as notable secondary nodes, leveraging their strategic locations, robust infrastructure, and supportive government policies to foster growth in the art market. Gulf sovereign funds, spurred by initiatives like Saudi Arabia’s Vision 2030 and the UAE’s diversification agenda, are channeling investments into flagship museum projects and new auction facilities. These efforts aim to position the region as a global cultural hub. A testament to the region's institutional confidence, Sotheby’s wrapped up a USD 1 billion build-out in Abu Dhabi in December 2025, further cementing the Middle East's growing prominence in the global art market.
North America stands as a seasoned stalwart; U.S. collectors represented 42% of global art expenditures in 2024. The region benefits from a well-established art ecosystem, including a high concentration of galleries, auction houses, and collectors. While Europe grapples with macroeconomic challenges evident as London's auction market dipped 26% in 2024, it still boasts a rich expertise and stringent provenance laws, which continue to attract high-value transactions. The region's historical significance and cultural heritage also contribute to its resilience in the art market. Though South America and Africa are emerging markets stymied by limited payment systems and currency fluctuations, Brazil's digital-centric galleries and South Africa's contemporary art scene hint at a promising future. In Brazil, the rise of online platforms has enabled greater accessibility to fine art, while South Africa's vibrant contemporary art scene is gaining international recognition, supported by a growing number of art fairs and exhibitions.

Competitive Landscape
Legacy giants, venture-backed aggregators, and niche specialists coexist in a market where technology, trust, and transaction speed determine competitive advantage. Christie’s and Sotheby’s leverage brand pedigree to dominate trophy sales above USD 1 million, yet both now rely on livestream auctions and mobile-optimized bidding interfaces. Phillips achieved USD 927 million in 2025 sales, up 10%, by extending private-sale advisory and guaranteeing minimum proceeds to consignors.
Artsy converts browsing sessions by training its recommendation engine on 1.3 million artworks from 4,000 galleries, while Artnet couples price-database access with marketplace listings. 1stDibs’ revenue slide in 2024 highlights the challenge of sustaining margin amid fee pressure and copycat platforms. Fractional platforms such as Masterworks and Rally securitize single artworks into SEC-registered shares, widening the investor base but inviting regulatory scrutiny.
Technology deployment is now table stakes: blockchain certificates, AI image authentication, and multi-currency settlement APIs are standard features among top platforms. The Art Loss Register API strengthens fraud detection, yet participation varies. Competitive intensity is most acute below USD 50,000, where switching costs are low, while the high-ticket segment remains relationship-oriented.
Online Fine Art Industry Leaders
Auction Technology Group Plc (thesaleroom.com)
Artfinder (ART DISCOVERY LIMITED)
Artellite Limited
Saatchi Online, Inc.
Invaluable, LLC
- *Disclaimer: Major Players sorted in no particular order

Recent Industry Developments
- March 2025: Art Basel and UBS report a 12% decline in 2024 global art sales to USD 57.5 billion, while the online channel held an 18% share, 76% above its 2019 level .
- February 2025: Masterworks Vault 4 files with the SEC to expand fractional art offerings amid rising regulatory scrutiny of alternative securities.
- January 2025: MIT announced that NALA surpassed 8,500 registered artists, operating on an 11.5% buyer-fee model to enhance artist earnings.
- August 2024: Artsy Gallery Report shows 7% online revenue growth for tech-forward dealers, outpacing the broader market contraction.


Research Methodology Framework and Report Scope
Market Definitions and Key Coverage
Our study defines the online fine art market as the gross value of unique or limited-edition paintings, sculptures, photographs, prints, and comparable works that are discovered, purchased, and paid for entirely through digital channels, dealer websites, online auctions, and curated marketplaces. We track revenue regardless of device or payment rail.
Scope exclusion: Decorative crafts, mass-produced prints, support services such as framing, insurance, logistics, and purely speculative NFT collectibles are outside this scope.
Segmentation Overview
- By Price Range
- Less Than USD 5k
- USD 5k - 50k
- USD 50k - 250k
- USD 250k - 1m
- Above USD 1m
- By Channel
- Dealers (1P and 3P Platforms)
- Auctions (Online-Only and Hybrid)
- By Medium
- Paintings
- Sculptures
- Photography
- Digital/NFT Art
- Others, Medium
- By Sector
- Post-War and Contemporary
- Modern
- Impressionist and Post-Impressionist
- Old Masters
- Other Sectors
- By Geography
- North America
- United States
- Canada
- Mexico
- South America
- Brazil
- Rest of South America
- Europe
- Germany
- United Kingdom
- France
- Italy
- Rest of Europe
- Asia Pacific
- China
- Japan
- South Korea
- Singapore
- Hong Kong
- Rest of Asia Pacific
- Middle East
- United Arab Emirates
- Saudi Arabia
- Rest of Middle East
- Africa
- South Africa
- Rest of Africa
- North America
Detailed Research Methodology and Data Validation
Primary Research
We held structured interviews with gallery owners, online-only auction managers, payment processors, and high-net-worth collectors across North America, Europe, and Asia Pacific. Their perspectives confirmed channel-mix shifts, average transaction values, and regional adoption patterns that raw datasets could not fully explain.
Desk Research
We began by triangulating public sources such as the Art Basel & UBS Art Market report, Artprice auction statistics, UN Comtrade export code 9701 data, OECD broadband indicators, and cultural-ministry dashboards. These references framed the global fine-art pool and its online share.
Additional insight flowed from company filings, investor decks, Statista time-series, and news streams curated through Dow Jones Factiva, while D&B Hoovers offered private-platform revenue clues. The sources cited are illustrative only; many other open and paid references were reviewed for cross-checks and clarity.
Market-Sizing & Forecasting
A top-down rebuild of global art turnover applies verified online-penetration ratios by price bracket, which are then tested with sampled platform gross-merchandise values and average price-times-volume snapshots. Key variables that feed the model include household broadband penetration, cross-border tariff rules, mobile checkout conversion, median ticket size, and platform commission rates. Multivariate regression, anchored by expert consensus on discretionary-income growth and gallery re-opening timelines, generates the 2025-2030 outlook. Any disclosure gaps are bridged with plausibility bands derived from survey medians and payment-processor indicators.
Data Validation & Update Cycle
Mordor analysts run variance checks against independent statistics, flag anomalies for peer review, and re-contact sources where needed. Our dataset refreshes each year, with interim updates triggered by material events so clients always receive the most current view.
Why Mordor's Online Fine Art Baseline Inspires Confidence
Published estimates often diverge because firms select different art categories, channel definitions, and currency baselines.
Discrepancies widen when models still rely on pre-pandemic averages or fold in ancillary service revenue that Mordor purposely excludes.
Benchmark comparison
| Market Size | Anonymized source | Primary gap driver |
|---|---|---|
| USD 13.29 B (2025) | Mordor Intelligence | |
| USD 11.79 B (2025) | Global Consultancy A | Omits high-value cross-border deals and digital prints, uses narrow platform panel |
| USD 12.11 B (2024) | Industry Journal B | Blends decorative art and logistics fees; last full refresh occurred in 2023 |
The comparison shows that Mordor's disciplined scope selection, timely refresh cadence, and dual-path validation deliver a balanced baseline that decision-makers can trace to clear variables and repeatable steps.


Key Questions Answered in the Report
How large is the online fine art market in 2026?
The online fine art market size reached USD 14.1 billion in 2026 and is projected to rise to USD 18.99 billion by 2031.
Which price segment is expanding the fastest?
Works priced between USD 250,000 and 1 million are forecast to grow at a 7.21% CAGR, the quickest among all bands.
Which region leads growth through 2031?
Asia Pacific is set to expand at a 7.34% CAGR, outperforming all other regions.
Why are fractional ownership platforms important?
They lower entry barriers by letting investors buy equity slices in blue-chip works, broadening the collector base and adding liquidity.
What technologies are shaping buyer behavior?
Blockchain provenance, AI recommendation engines, and multi-currency settlement tools are driving convenience, trust, and conversion rates.
Page last updated on:


