
Conductive Ink Market Size and Share
Market Overview
| Study Period | 2020 - 2031 |
|---|---|
| Market Size (2026) | USD 3.39 Billion |
| Market Size (2031) | USD 4.11 Billion |
| Growth Rate (2026 - 2031) | 3.92 % |
| Fastest Growing Market | Asia Pacific |
| Largest Market | Asia Pacific |
| Market Concentration | Medium |
Major Players *Disclaimer: Major Players sorted in no particular order Image © Mordor Intelligence. Reuse requires attribution under CC BY 4.0. | |
Conductive Ink Market Analysis by Mordor Intelligence
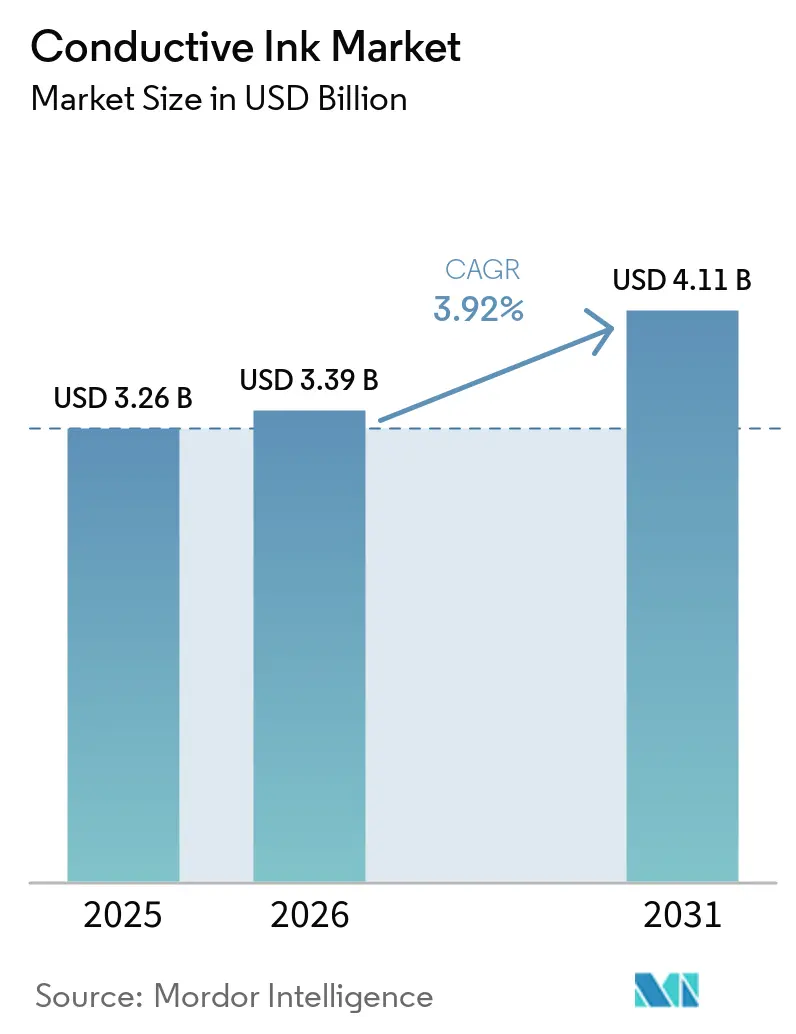
The Conductive Ink Market size in 2026 is estimated at USD 3.39 billion, growing from 2025 value of USD 3.26 billion with 2031 projections showing USD 4.11 billion, growing at 3.92% CAGR over 2026-2031. Steady photovoltaic demand, expanding semiconductor volumes, and the rise of flexible electronics sustain this moderate growth path. Graphene-based formulations open new opportunities by lowering silver use while adding flexibility advantages. Asia-Pacific’s integrated supply chains and renewable-energy policies keep the region at the center of global demand. Meanwhile, cost volatility for silver and copper nudges producers toward hybrid or alternative materials that still meet reliability targets.
Key Report Takeaways
- By type, silver-based inks led with 77.10% of the conductive inks market share in 2025; graphene-based inks record the fastest 4.88% CAGR through 2031.
- By application, photovoltaics generated 40.70% revenue in 2025, while sensors exhibit the strongest 4.63% CAGR to 2031.
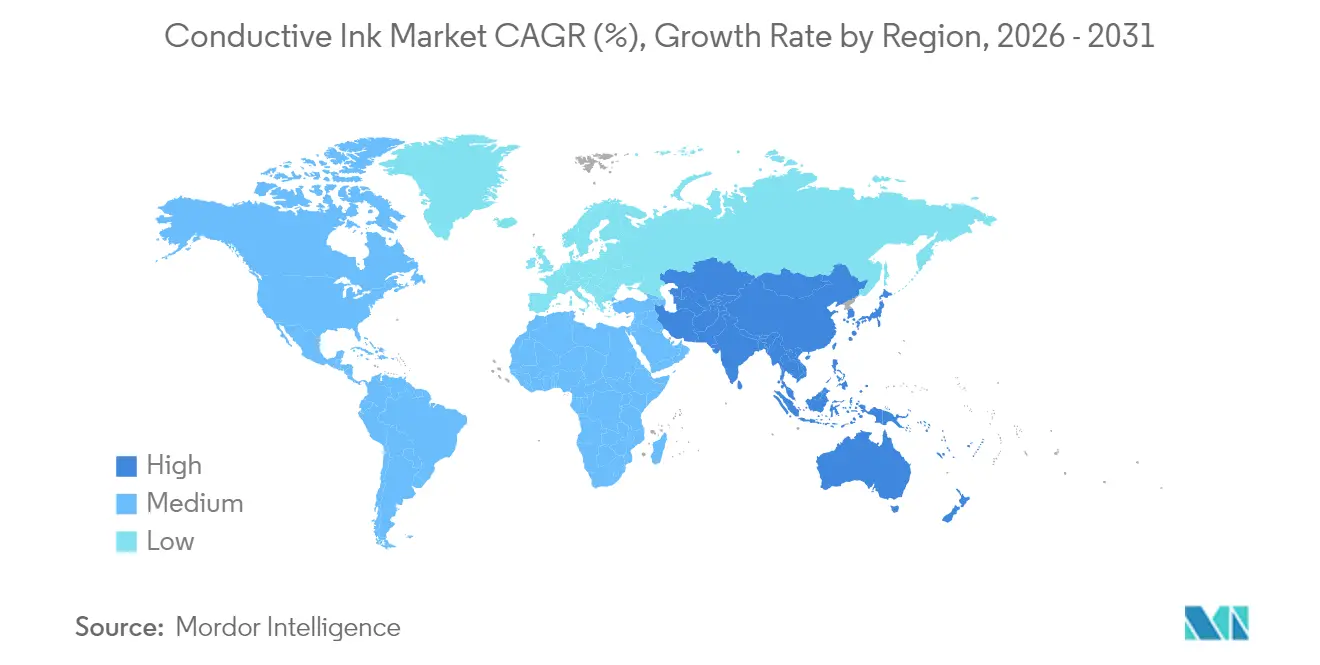
- By geography, Asia-Pacific held 45.20% of the conductive inks market size in 2025 and remains the fastest-growing region at 4.58% CAGR to 2031.
Note: Market size and forecast figures in this report are generated using Mordor Intelligence’s proprietary estimation framework, updated with the latest available data and insights as of 2026.
Market Trends and Insights
Drivers Impact Analysis of Conductive Ink Market*
| Driver | (~) % Impact on CAGR Forecast | Geographic Relevance | Impact Timeline |
|---|---|---|---|
| Growing installation of solar panels | +1.20% | China, India, Middle East | Medium term (2-4 years) |
| Rising demand for printed circuit boards | +0.90% | Asia-Pacific, North America, Europe | Short term (≤2 years) |
| Expansion of flexible & wearable electronics | +0.80% | North America, Asia-Pacific | Long term (≥4 years) |
| Automaker shift to silver-nanowire transparent heaters | +0.60% | North America, Europe, China | Medium term (2-4 years) |
| Commercialisation of graphene/silver hybrid low-Ag inks | +0.40% | Europe, North America | Long term (≥4 years) |
| Source: Mordor Intelligence | |||
Growing Installation of Solar Panels
Global solar build-outs keep silver paste consumption rising, with 700 million oz used in 2024, a 7% year-on-year jump. Higher-efficiency N-type cells rely on thicker silver fingers, lifting per-panel ink usage. Chinese and Indian policies that mandate large-scale solar arrays extend the demand pipeline through 2030. The International Energy Agency states that solar will add over 60% of renewable capacity this decade[1]International Energy Agency, “Renewables 2024,” iea.org . Each incremental gigawatt, therefore, translates into heightened conductive inks market demand, reinforcing long-run growth.
Rising Demand for Printed Circuit Boards
High-density interconnect boards need fine-line printing that silver inks deliver, and North American PCB shipments were up 11.3% in February 2025 with a 1.33 book-to-bill ratio. Capacity re-shoring from China to Thailand and Vietnam broadens the Asia-Pacific manufacturing base. HDI expansion aligns with the conductive inks market goal of lowering resistive losses on smaller traces. Quick-turn production cycles also benefit from screen-printed circuits that cut etching steps. As demand keeps exceeding supply, ink suppliers secure multi-year contracts with board fabricators.
Expansion of Flexible & Wearable Electronics
Wearables require inks that stretch yet retain conductivity. Scientific studies report conductive polymers that keep electrical paths intact under repeated flexing[2]MDPI, “Conductive Polymers for Flexible Electronics,” mdpi.com . Printing methods such as inkjet and screen printing reduce fabrication cost for smart textiles and flexible supercapacitors. AI-enabled health trackers connect through these circuits, adding volume to the conductive inks market. The trend moves beyond consumer electronics into soft robotics and biomedical patches, each spawning bespoke ink chemistries.
Automaker Shift to Silver-Nanowire Transparent Heaters
Automotive original equipment makers replace opaque grids with transparent heaters that meet EV efficiency and styling goals. DuPont’s Activegrid ink achieves 93% transmittance while staying under 20 Ω/sq after durability testing. Qualification timelines of three to five years mean programs already initiated will reach mass production before 2030. Transparent heaters also appear in advanced driver-assistance sensors, multiplying unit demand. The automotive vessel thus grows from a niche to a sizable slice of the conductive inks market.
Restraints Impact Analysis of Conductive Ink Market*
| Restraint | (~) % Impact on CAGR Forecast | Geographic Relevance | Impact Timeline |
|---|---|---|---|
| Volatility in silver and copper prices | -0.80% | Global | Short term (≤2 years) |
| Oxidation & reliability issues in copper-based inks | -0.50% | Global | Medium term (2-4 years) |
| Throughput limits of roll-to-roll graphene ink processes | -0.30% | Global | Long term (≥4 years) |
| Source: Mordor Intelligence | |||
Oxidation & Reliability Issues in Copper-Based Inks
Copper nanoparticles oxidize quickly, adding resistive layers that undercut circuit performance. Polymer capping reduces oxidation but increases viscosity and print complexity. Advanced binders can hit 158 µΩ·cm resistivity yet require inert reflow ovens that raise capital cost. These processing burdens limit copper’s penetration in high-reliability products such as medical sensors or aerospace circuits, keeping silver ahead despite its premium.
Throughput Limits of Roll-to-Roll Graphene Ink Processes
Current CVD lines top out near 1 m/min before graphene quality degrades[3]Materials Research Society, “Roll-to-Roll CVD Graphene,” mrs.org . Faster runs create smaller crystal domains, cutting sheet mobility. The GRAFOL program invested EUR 10.5 million to close this gap, but commercial high-throughput remains years away. The bottleneck restricts graphene uptake to high-value niches where price tolerates slower output. Until production scales, most of the conductive inks market will stay anchored to metal-based systems.
*Our forecasts treat driver/restraint impacts as directional, not additive. The impact forecasts reflect baseline growth, mix effects, and variable interactions.
Conductive Ink Market Segment Analysis
By Type:
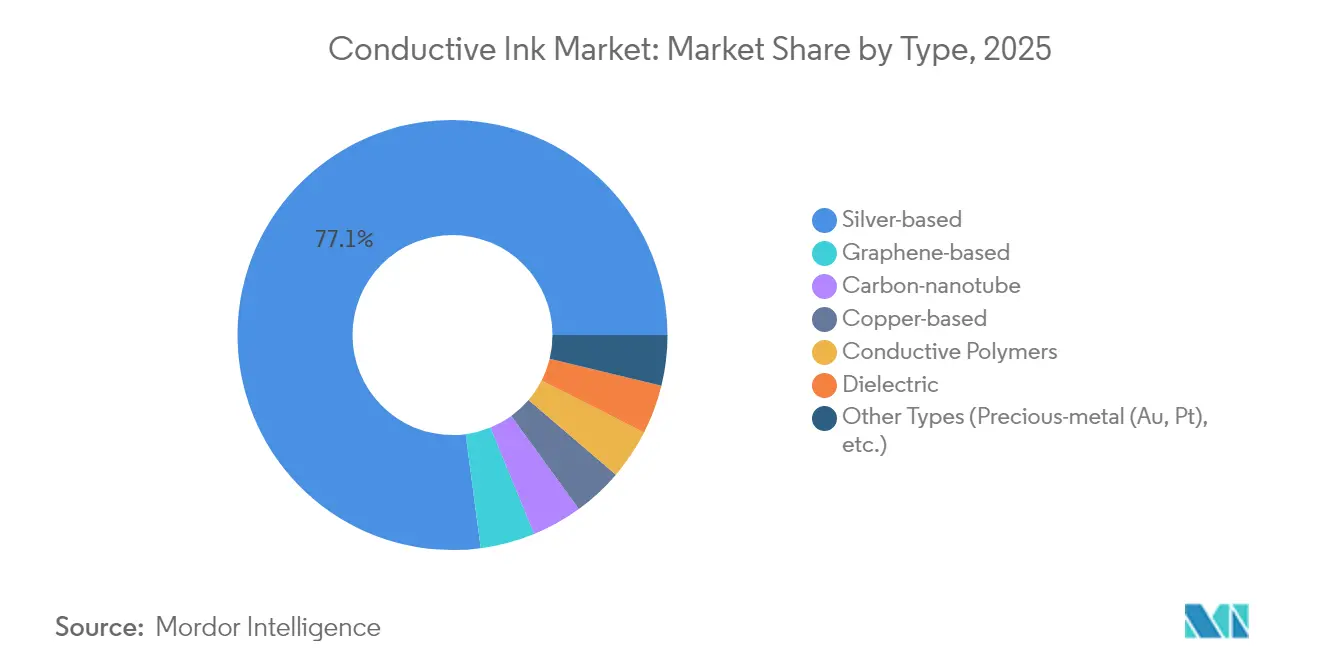
Silver Dominance Faces Graphene InnovationSilver compositions supplied 77.10% of the conductive inks market in 2025, underscoring their unmatched conductivity for photovoltaics and circuit boards. Graphene-based inks, although smaller today, grow at a 4.88% CAGR by offering cost relief and flexibility benefits. Hybrid graphene-silver blends bridge the performance gap, easing the transition away from full-silver pastes. Copper tracks remain limited to low-cost electronics because oxidation needs protective chemistries that raise process steps. Carbon nanotubes and conductive polymer classes serve stretchable, chemical-resistant niches such as e-textiles and bio-patches.
The commercialization push elevates dielectric inks too, which enable multilayer architectures by insulating adjacent traces, alongside non conductive ink applications. Water-based graphene formulations nearing 1.5 × 10⁴ S/m conductivity threaten silver in sensors that can tolerate modest resistance. Precious-metal formulations using gold and platinum stay reserved for aerospace or implantable devices where cost recedes behind mission-critical reliability. Overall, performance, not price alone, dictates selections, securing silver’s lead even as alternatives enlarge the broader conductive inks market.



By Application:
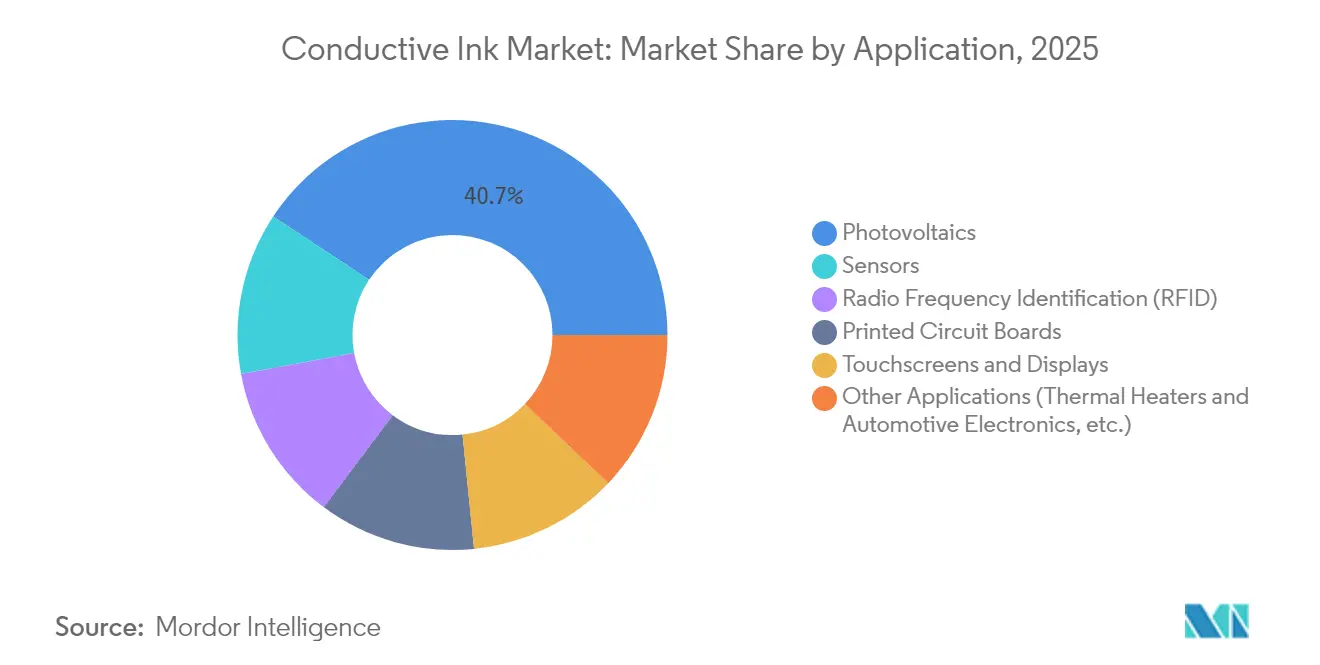
Photovoltaics Leadership Drives Sensor InnovationPhotovoltaics accounted for 40.70% of the conductive inks market size in 2025 because each N-type wafer now carries thicker silver fingers to obtain higher cell efficiencies. IoT rollout makes sensors the quickest-rising use case, advancing at 4.63% CAGR through 2031 as health patches and industrial monitors shrink and flex. RFID tags sustain incremental demand from logistics digitization, while touchscreens plateau with smartphone saturation.
AI inference at the edge compels robust thermal pathways, nudging designers toward inks with improved heat dissipation. Biocompatible graphene systems open fresh lanes in wearable medical electronics where metal allergies restrict silver usage. Automakers explore in-mold electronics for cockpit controls, another channel that favors printable circuits. As each emerging use arrives, it enlarges the conductive inks market, creating a rolling wave of opportunities rather than a single dominant growth spike.
Geography Analysis
APAC Conductive Ink Market
Asia-Pacific commanded 45.20% of 2025 revenue and posts a 4.58% CAGR through 2031. China’s renewable mandates, India’s giga-factory buildout, and South Korea’s chip packaging boom form a self-reinforcing ecosystem. Japan supplies specialty pastes and printer heads that tune performance. Thailand and Vietnam absorb capacity as brands mitigate geopolitical risk, yet remain within the regional value network. Such clustering compresses logistics costs and accelerates product iteration, advantages difficult for other regions to replicate.
The Americas and EMEA Conductive Ink Market
North America follows, supported by policy incentives that favor domestic EV supply chains and defense electronics. The CHIPS Act allocates capital for new fabs, bringing printed interposer demand in-house. Automotive suppliers adopt transparent heaters and battery management circuits that rely on silver and graphene inks. Regulations emphasize critical material security, pushing ink firms to source regionally or recycle metals as Henkel now demonstrates. Europe prioritizes sustainability, valuing water-based chemistries that comply with REACH and RoHS. OEMs develop circular design guidelines that specify recyclable pastes. Electric vehicles lead adoption of advanced battery current collectors that need low-resistance printable materials. Meanwhile, South America and the Middle East & Africa see rising solar farm investments, but limited local converting means many inks still arrive from Asia-Pacific or Europe. These emerging markets extend the geographic footprint of the conductive inks market yet do not displace existing regional leaders.

Value Chain Analysis
Upstream inputs include silver, copper, and carbon-based conductors, along with binders, solvents, dispersants, and rheology modifiers that tailor printability for screen, inkjet, or aerosol-jet deposition. In 2026, Henkel partnered with Brilliant Matters to co-develop screen-printable silver inks aligned to high-throughput roll-to-roll organic photovoltaic panel manufacturing, linking materials development to scalable production.
Downstream activities hinge on formulation fine-tuning, pilot qualification, and market access through distributors and OEM networks. Electroninks expanded market reach in 2026 by making gold and silver nanoparticle inks available through Sigma-Aldrich in May 2026, and collaborations with SAKATA INX and SIIX in Japan in June 2026 link formulation know-how to localized electronics manufacturing ecosystems.
Competitive Landscape
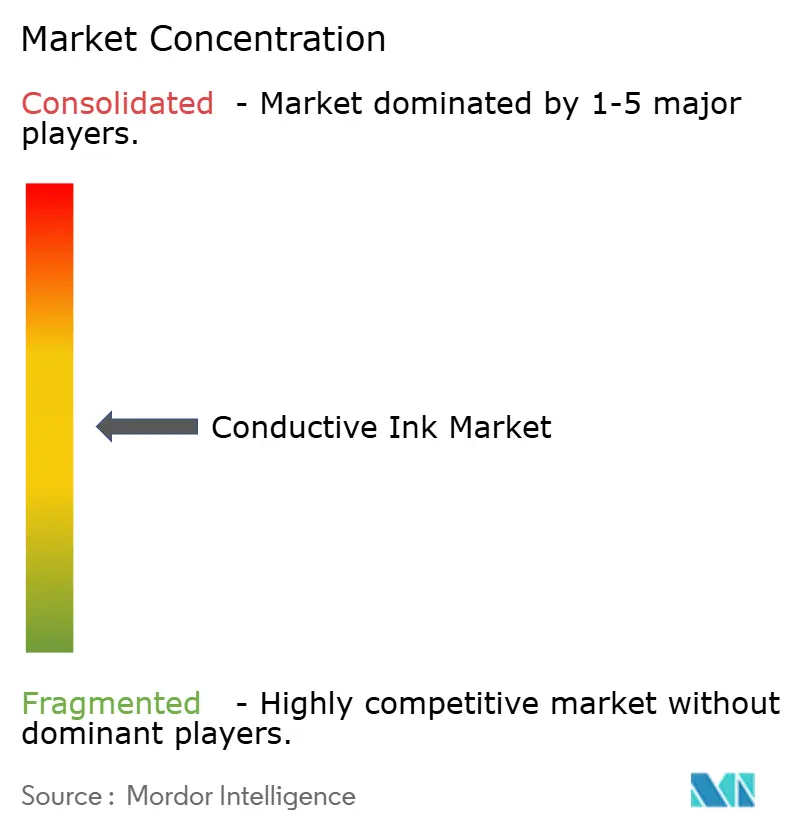
The conductive inks market remains moderately fragmented. Barriers include deep materials science know-how, pilot-line validation capacity, and global service networks. DuPont, Henkel, Sun Chemical, and Heraeus leverage vertical integration from powder metallurgy to application engineering, giving them an edge in turnkey support. Patent estates fortify positions by limiting rivals’ formulation windows.
Innovation now centers on cost reduction and environmental compliance. Henkel’s 2025 launch of recycled-silver inks shows how incumbents pivot to greener inputs while protecting performance. DuPont prepares to spin off its electronics unit as Qnity, sharpening its focus on advanced materials for displays and automotive glazing. Start-ups such as Haydale push plasma-functionalized graphene that drops silver loadings without performance loss. Partnerships between printhead makers and ink formulators quicken adoption because co-development slashes line-qualification times.
Supply-chain resilience has become strategic. Large players multisource silver and invest in regional paste manufacturing to cushion logistics disruptions. Smaller firms differentiate by quick customization for niche IoT or biomedical projects, slipping under the radar of larger competitors. M&A activity is poised to rise as established vendors acquire technology boutiques to fill capability gaps. The shift toward hybrid chemistries suggests the next competitive frontier is tuning metal-carbon synergies rather than an outright switch away from precious metals.
Conductive Ink Industry Leaders
DuPont
Henkel AG & Co. KGaA
Heraeus Holding
NovaCentrix
Sun Chemical
- *Disclaimer: Major Players sorted in no particular order
Conductive Ink Market Companies Covered in this Report
- AdNano Technologies Pvt Ltd,
- Celanese Corporation
- Creative Materials
- Daicel Corporation
- DuPont
- Henkel AG & Co. KGaA
- Heraeus Holding
- IDTechEx Ltd
- InkTec Co. Ltd.
- Johnson Matthey
- Nano Dimension
- NovaCentrix
- Parker Hannifin Corp
- Sun Chemical
- TEKRA, LLC.
- Vorbeck Materials Corp

Market Opportunities and Future Outlook
Opportunity remains strongest around reducing precious-metal exposure while preserving fine-line conductivity and long-term reliability in high-volume applications such as photovoltaics, semiconductor packaging, and printed circuit boards. Silver-based inks retain a 77.10% share in 2025, and photovoltaics accounted for 40.70% of 2025 revenue, putting pressure on suppliers to cut silver loading or substitute it in selected layers. Material innovation is therefore converging on silver-plated copper approaches and hybrid systems that balance conductivity, adhesion, and durability.
Henkel also pointed to cost-focused conductive ink concepts at LOPEC 2026, including silver-plated copper technology aimed at mitigating raw-material price volatility. Another opportunity area is process simplification for temperature-sensitive substrates and high-throughput manufacturing, where low-temperature curing, UV-curable, or sintering-free inks reduce equipment complexity and broaden adoption in flexible electronics and smart surfaces. In June 2026, Electroninks launched a UV-curable silver conductive ink (EI-1169) for inkjet deposition targeting EMI shielding and semiconductor packaging. Separately, the Horizon Europe REFORM project reported a proof-of-concept for a fully organic, sintering-free conductive ink that cures at 20 C in July 2026, reflecting continued efforts to extend printable electronics onto plastics, paper, and other low-thermal-budget materials while easing line integration constraints.
Recent Industry Developments in Conductive Ink Market
- June 2026: Henkel and Brilliant Matters announced a strategic partnership to co-develop screen-printable silver inks for efficient, high-throughput organic photovoltaic (OPV) panel manufacturing. The collaboration aligns ink formulation with roll-to-roll production needs, helping shorten qualification cycles for printed PV lines and reinforces OPV as a commercialization pathway for advanced conductive pastes.
- May 2026: Electroninks began distributing gold and silver nanoparticle inks through Sigma-Aldrich, expanding access to researchers and small-scale manufacturers. This distribution supports prototyped and early-stage printed electronics applications.
- February 2024: Heraeus Electronics acquired the PriElex electronics inks business line from Kayaku. The acquisition broadens Heraeus' electronics inks portfolio and improves its ability to serve printed electronics customers with a wider set of qualified materials.


Conductive Ink Market Report Scope and Research Methodology
Market Definition and Coverage
This market covers formulated conductive inks that are printed or deposited to form an electrically conductive path on a substrate for electronics and energy-related uses. Revenue values are captured for inks used in applications such as photovoltaics (PV), RFID, sensors, touchscreens, displays, and printed circuit patterns.
Scope exclusions: We exclude conductive coatings and plating chemistries sold mainly as paints, sprays, or baths when they are not supplied and used as printable conductive inks.
Segments Covered in This Report
- By Type
- Silver-based
- Copper-based
- Graphene-based
- Carbon-nanotube
- Conductive Polymers
- Dielectric
- Other Types (Precious-metal (Au, Pt), etc.)
- By Application
- Photovoltaics
- Radio Frequency Identification (RFID)
- Sensors
- Touchscreens and Displays
- Printed Circuit Boards
- Other Applications (Thermal Heaters and Automotive Electronics, etc.)
- By Geography
- Asia-Pacific
- China
- Japan
- India
- South Korea
- Rest of Asia-Pacific
- North America
- United States
- Canada
- Mexico
- Europe
- Germany
- United Kingdom
- France
- Italy
- Rest of Europe
- South America
- Brazil
- Argentina
- Rest of South America
- Middle East and Africa
- Saudi Arabia
- South Africa
- Rest of Middle East and Africa
- Asia-Pacific
Data Sources, Market Sizing, and Validation
Desk Research
Desk work starts by mapping demand signals that typically pull conductive ink volumes, then linking them back to ink consumption patterns by application. We leaned on public sources such as the US Census Bureau, US International Trade Commission (import and export statistics), Eurostat, UN Comtrade, and government energy and solar statistics that help anchor electronics and PV output trends.
To avoid using one single dataset too heavily, the evidence base is spread across company annual reports and investor presentations, technical journals on printed electronics, and patent databases for material and formulation direction, plus trade-association publications. In a few places, we also used paid subscriptions for company financials and intelligence, patent lookups, and shipment-level import and export checks, mainly to confirm ranges rather than force the model. These desk research sources are illustrative only, and other public references were used for cross-checks and clarification during the study.
Primary Interviews and Surveys
Primary discussions were used to confirm how inks are priced and sold across major use cases, and to understand where adoption is rising or slowing (for example, in RFID, PV, and printed sensors). We spoke with material suppliers, formulators, downstream converters, and application-side experts across APAC, EMEA, and the Americas, so regional manufacturing shifts and qualification cycles were reflected in the assumptions.
Distribution of primary research fieldwork respondents
| Company type | Respondent position | Region |
|---|---|---|
| Top tier: 39% | CXOs: 14% | APAC: 44% |
| Mid tier: 42% | Functional/Unit leaders: 29% | EMEA: 35% |
| Smaller Players: 19% | Managers: 57% | Americas: 21% |
Market-Sizing & Forecasting
The core build uses a top-down approach where application demand is reconstructed from end-market activity, then translated into ink value using typical loading, yield, and price ranges. For conductive ink, inputs that matter include printed electronics output trends, PV installation additions, RFID tag volume direction, flexible display and touch module production, and the share of circuits shifting from etched to printed patterns.
Those totals were corroborated with selective bottom-up approximations, such as a sampled ASP multiplied by a volume check for common ink chemistries, plus a supplier revenue sanity check for exposed lines where disclosure exists. When a bottom-up view is incomplete due to private-company revenue not being visible, the gap is handled by applying conservative capture rates tied to observed manufacturing footprint and channel feedback.
Forecasts were produced using scenario analysis supported by expert consensus on the pace of substitution, material price movement (notably silver and copper), and qualification timelines in electronics. The output is kept reproducible, with each major assumption traced back to a demand indicator or an interview input and then stress-tested for sensitivity.
Data Validation & Update Cycle
Model outputs are checked against independent signals, including regional electronics production direction, PV deployment pace, and trade-flow changes for relevant raw materials and intermediates. If any region or application shows an unexpected jump, assumptions are reviewed, and follow-up calls are triggered to confirm whether it is a real shift or a modeling artifact.
Before sign-off, the numbers go through a multi-step analyst review, where unit economics, growth rates, and implied penetration levels are compared with what respondents described as realistic. The report is refreshed annually, with interim updates when material events occur, such as sharp input price swings or large capacity changes. Right before delivery, a final refresh pass is completed so clients receive the most current view available.
Mordor Intelligence's Conductive Ink Market Size Compared With Other Published Estimates
Published market values for conductive ink do not always match because the scope is drawn differently, and because pricing and adoption assumptions are refreshed on different schedules. Differences also show up when one estimate uses more long-range forecasting, and another stays closer to near-term capacity and qualification realities.
Some publications appear to fold in adjacent categories like conductive coatings or broader printed electronics materials, which can lift totals even if ink volumes are unchanged. In Mordor Intelligence sizing, revenue is counted only for inks sold as printable conductive formulations for defined applications, and figures are aligned to application demand indicators and interview-confirmed ASP bands rather than relying on a single CAGR-driven expansion.
Benchmark comparison
| Source | Market Size | Gaps in Research Methodology |
|---|---|---|
| Mordor Intelligence | USD 3.39 B (2026) | |
| Industry Research Publisher A | USD 3.24 B (2024) | Uses a 2024 base year and a broader product framing by product type and application, which can shift totals depending on whether related printed-electronics material revenues are included. The long forecast window also amplifies growth assumptions and can move the implied 2026 value away from near-term demand checks. |
| Global Publisher B | USD 4.26 B (2026) | Likely applies a wider segmentation stack (technology, substrate, and end-use) that can pull in additional spend lines beyond ink-only revenue. Higher 2026 value can also come from more aggressive ASP progression assumptions, especially if precious-metal input costs are passed through faster than typical contract cycles. |
Taken together, the spread is mainly explained by what gets counted as ink revenue versus adjacent materials, plus how quickly pricing and adoption are assumed to step up across RFID, PV, and printed sensors. Our approach stays transparent because each application total can be traced back to a demand signal, a conversion assumption, and a pricing range that can be rechecked and updated.


Key Questions Answered in the Report
What is the current size of the conductive inks market?
The conductive inks market is valued at USD 3.39 billion in 2026 and is projected to reach USD 4.11 billion by 2031.
Which segment holds the largest conductive inks market share?
Silver-based inks lead with a 77.10% share in 2025, largely due to their use in photovoltaic cells.
Which application is growing fastest within the conductive inks market?
Sensor applications grow at a 4.63% CAGR through 2031 as IoT and wearable devices proliferate.
Why is Asia-Pacific dominant in the conductive inks market?
The region hosts integrated electronics supply chains, strong renewable-energy targets, and supportive government policies, resulting in 45.20% revenue share in 2025.
How are raw material price swings affecting the conductive inks industry?
Volatile silver and copper prices pressure margins, pushing suppliers to adopt hybrid or recycled materials and dynamic pricing models.
Page last updated on:


 Your data is secure and never sold or shared.


