Market Overview
| Study Period | 2020 - 2031 |
|---|---|
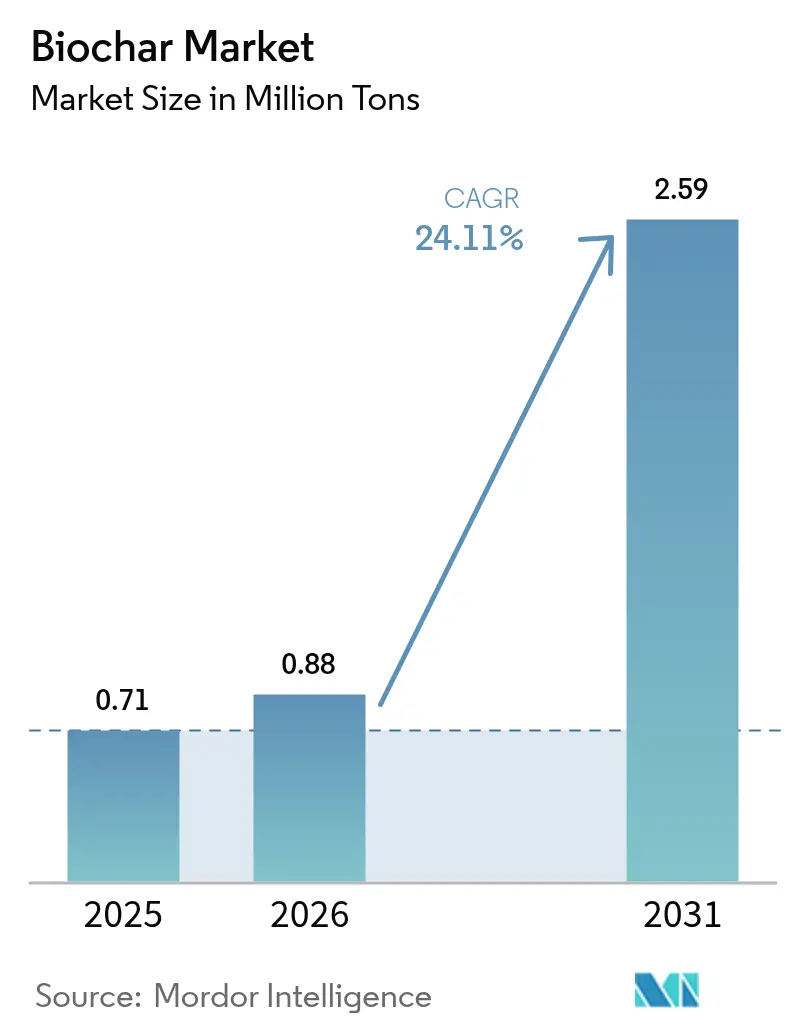
| Market Volume (2026) | 0.88 Million tons |
| Market Volume (2031) | 2.59 Million tons |
| Growth Rate (2026 - 2031) | 24.11% CAGR |
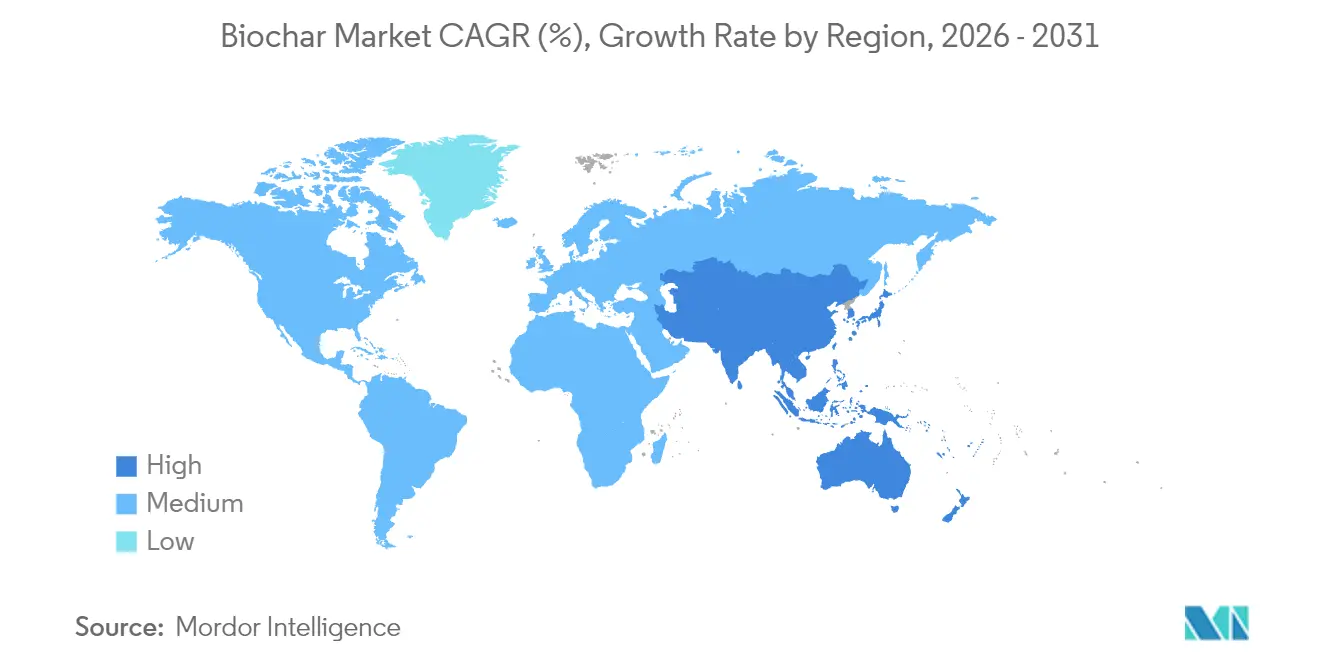
| Fastest Growing Market | Asia Pacific |
| Largest Market | Asia Pacific |
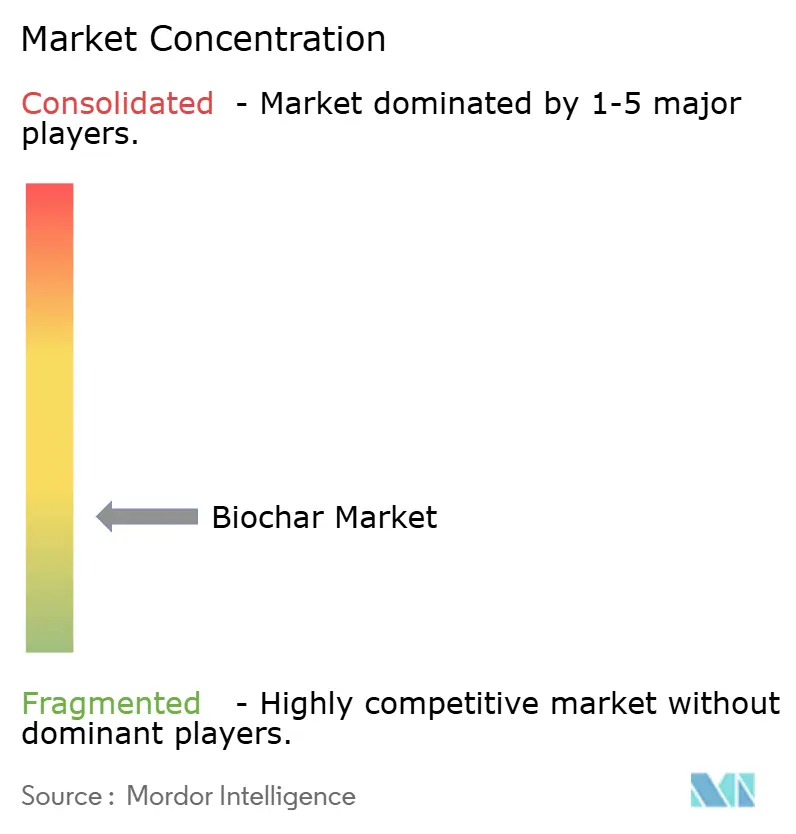
| Market Concentration | Low |
Major Players *Disclaimer: Major Players sorted in no particular order Image © Mordor Intelligence. Reuse requires attribution under CC BY 4.0. | |
Biochar Market Analysis by Mordor Intelligence
Biochar market size in 2026 is estimated at 0.88 Million tons, growing from 2025 value of 0.71 Million tons with 2031 projections showing 2.59 Million tons, growing at 24.11% CAGR over 2026-2031. Rapid scale-up is tied to supportive climate policies, the need for negative-emission technologies, and mounting pressure on agriculture to restore soil health. Premium carbon-credit pricing, a widening set of industrial use-cases, and technology advances that cut unit costs are expanding revenue streams and improving project bankability, especially in regions with clear carbon-removal protocols. Asia-Pacific leads today’s biochar market with an estimated 40.26% volume share, while robust government incentives in North America and the European Union encourage new capacity additions. Feedstock diversification away from high-cost woody biomass toward agricultural residues is easing long-standing supply constraints. At the same time, distributed pyrolysis units are shrinking logistics distances and lowering scope-3 emissions, reinforcing biochar’s climate credentials.
Key Report Takeaways
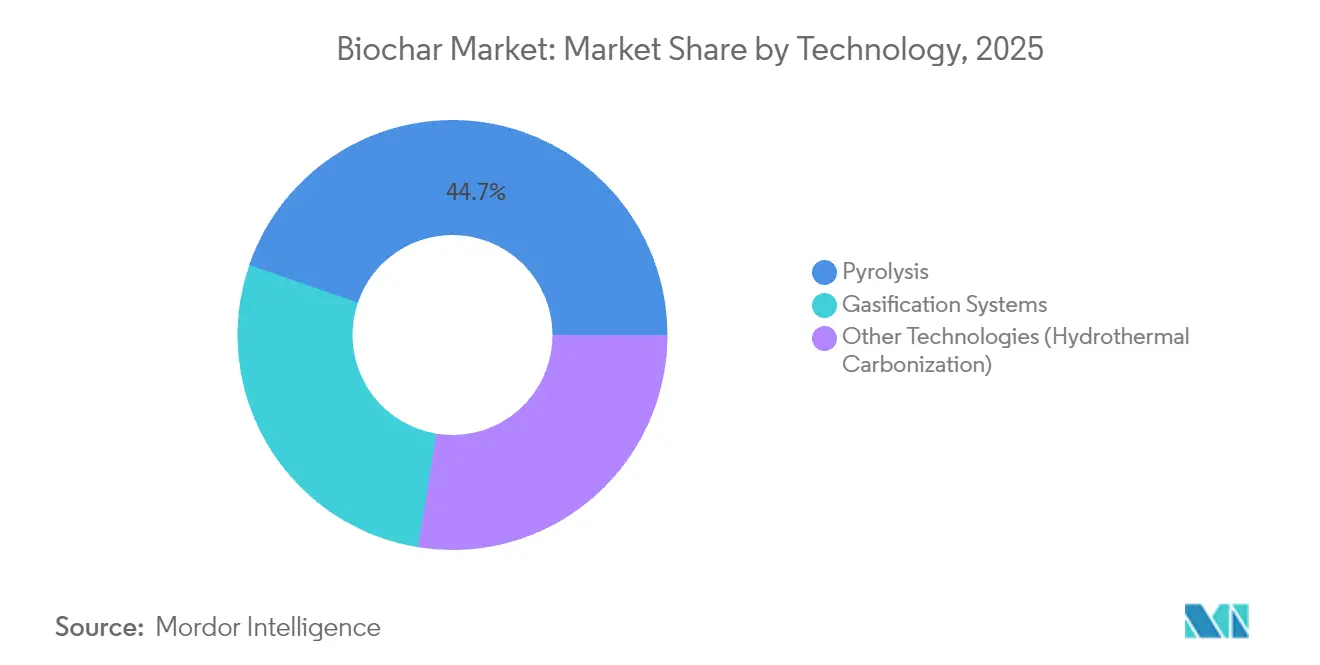
- By technology, pyrolysis accounted for 44.72% of biochar market share in 2025, whereas other technologies are forecast to expand at a 24.63% CAGR to 2031.
- By feedstock, woody biomass led with 61.15% share of the biochar market size in 2025, while agricultural residues are projected to grow at 25.05% CAGR through 2031.
- By form, powder products dominated with 43.25% share of the biochar market in 2025; liquid suspensions are set to register a 24.21% CAGR to 2031.
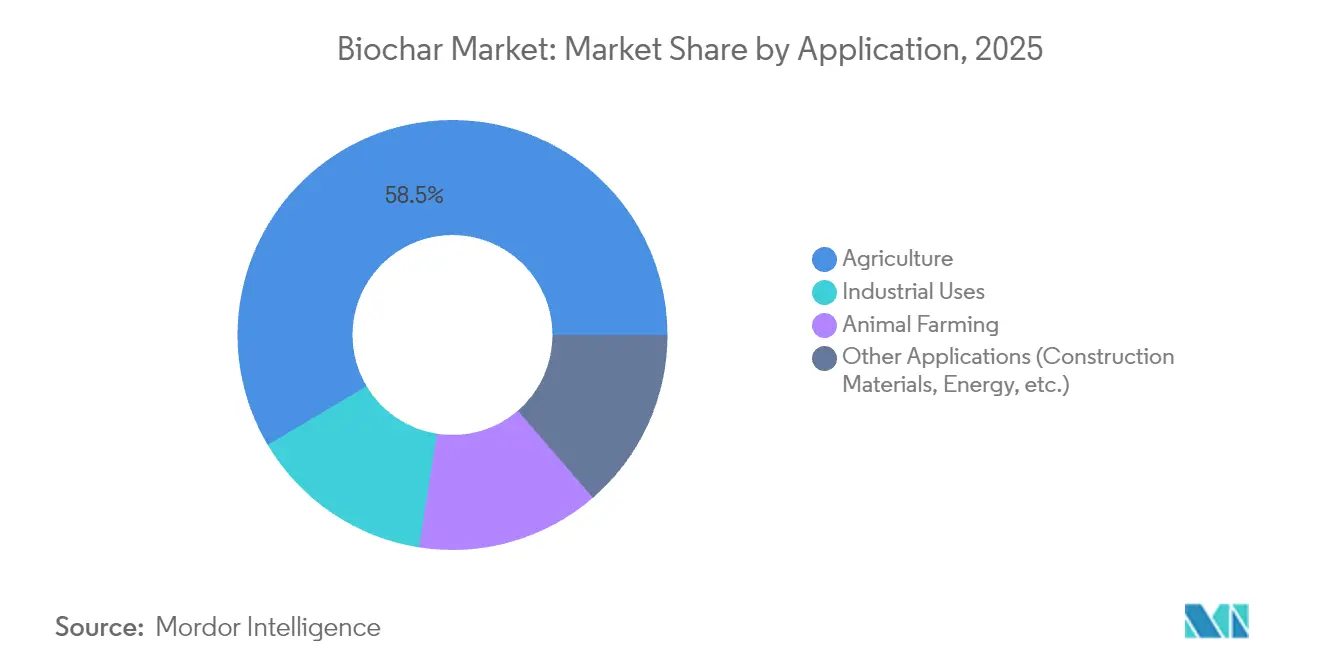
- By application, agriculture held 58.54% share of the biochar market in 2025, yet industrial uses are on track for the fastest 25.1% CAGR over the same period.
- By geography, Asia-Pacific captured 39.88% of global volume in 2025 and is also expected to log the quickest 24.32% CAGR through 2031.
Note: Market size and forecast figures in this report are generated using Mordor Intelligence’s proprietary estimation framework, updated with the latest available data and insights as of 2026.
Global Biochar Market Trends and Insights
Drivers Impact Analysis*
| Driver | (~) % Impact on CAGR Forecast | Geographic Relevance | Impact Timeline |
|---|---|---|---|
| Rising Demand from Organic and Regenerative Farming | +6.2% | Global, with concentration in North America and EU | Medium term (2-4 years) |
| Government Incentives for Negative-Carbon Materials and Waste Valorization | +7.8% | North America, EU, China | Short term (≤ 2 years) |
| Carbon-Credit Monetisation for Soil Sequestration Projects | +5.4% | Global, led by North America and EU | Medium term (2-4 years) |
| Expanding Horticulture and Greenhouse Adoption | +3.1% | North America, EU, Japan | Long term (≥ 4 years) |
| Biochar-Enhanced Asphalt and Concrete for Green Construction | +2.1% | Global, early adoption in EU and North America | Long term (≥ 4 years) |
| Source: Mordor Intelligence | |||
Rising Demand from Organic and Regenerative Farming
Organic farmers are replacing synthetic inputs with biochar as they chase higher soil-organic-carbon scores required for premium certification. Twenty US states have already activated the NRCS Soil Carbon Amendment 808 standard, which reimburses growers for verified biochar applications[1]Natural Resources Conservation Service, “Soil Carbon Amendment 808 Practice Standard,” usda.gov . Yield trials show first-year productivity gains near 9% and cumulative boosts that exceed 20% after six seasons, especially in nutrient-poor soils. Biochar qualifies for use in USDA-certified organic systems when sourced from untreated biomass, a rule that removes a major market barrier and supports premium pricing. The cascading-use concept—deploying biochar first in filtration or livestock bedding and later reincorporating it into fields—multiplies income streams and aligns with circular-economy mandates. As input prices remain volatile, growers view biochar as a hedge that locks in stable nutrient supply and long-term carbon credits.
Government Incentives for Negative-Carbon Materials and Waste Valorization
Policy levers are accelerating demand. The Inflation Reduction Act broadened Section 45Q and 45V tax credits to include carbon-utilisation pathways, letting qualified biochar facilities claim monetisable certificates once lifecycle analyses are filed with the IRS. In parallel, the European Commission’s Carbon Removal Certification Framework is drafting biochar-specific quantification rules that should standardise permanence proofs and attract institutional capital. Several US states, notably Washington, have legalised flame-cap kilns under updated clean-air codes, clearing the way for distributed production models that shorten feedstock haulage. These incentives lower compliance risk and improve debt-service coverage ratios, nudging private investors toward large-scale projects.
Carbon-Credit Monetisation for Soil Sequestration Projects
Durable-removal buyers prefer biochar credits because independent studies peg carbon-storage horizons at well over 100 years, outlasting most forestry offsets. In 2024, biochar accounted for 94% of verified durable-removal tonnes delivered into the voluntary market. Corporate purchasers such as Microsoft and JPMorgan continue to sign multi-year forward contracts priced above USD 100 per tonne CO₂e, providing revenue certainty that supports construction-phase financing. New registry protocols in the United States and Canada cut transaction costs by streamlining monitoring, reporting, and verification procedures. As price transparency improves, originators can bundle credits with physical product sales, raising margins without sacrificing liquidity.
Expanding Horticulture and Greenhouse Adoption
Peat-free mandates in the European Union and proposed restrictions in several US states push commercial growers toward sustainable substrates. Scientific trials confirm that biochar can displace up to 80% of peat in nursery mixes while maintaining—or even enhancing—root development across multiple ornamental species. Because peatland drainage releases substantial CO₂ and threatens biodiversity, regulators view biochar as an immediate substitute that carries a negative-emission profile. Greenhouse operators also benefit from local sourcing that cuts freight bills on bulky growing media. Industry surveys show that substrate cost savings can reach 15-20% when biochar replaces imported peat, a differential that scales with greenhouse acreage.
Restraints Impact Analysis*
| Restraint | (~) % Impact on CAGR Forecast | Geographic Relevance | Impact Timeline |
|---|---|---|---|
| High Production and Logistics Costs | -4.7% | Global, particularly acute in remote areas | Short term (≤ 2 years) |
| Availability of Low-Cost Substitutes | -2.8% | Global, varying by application | Medium term (2-4 years) |
| Regulatory Ambiguity on Fertiliser Registration | -1.9% | North America, EU, emerging markets | Short term (≤ 2 years) |
| Source: Mordor Intelligence | |||
High Production and Logistics Costs
Unit economics remain challenging because feedstock, preprocessing, and thermal conversion each add sizeable cost blocks. Academic cost curves place fully-loaded production between USD 106 and USD 170 per ton depending on moisture content, plant scale, and regional energy tariffs[2]College of Food, Agricultural, and Environmental Sciences, “Techno-Economic Assessment of Biochar Production,” osu.edu . Low bulk density means a 40-foot container carries far fewer tonnes of biochar than of synthetic fertiliser, inflating per-tonne freight costs on long-haul routes. Producers either adopt mobile pyrolysis units that follow feedstock sources or build rail-linked hubs to capture logistics efficiencies, yet both strategies demand capital outlays that small operators struggle to finance. Until automated, high-throughput plants gain traction, scale economies will arrive slowly.
Availability of Low-Cost Substitutes
Compost, manure, and peat remain entrenched in agronomy and horticulture because they deliver familiar performance at lower purchase prices. Activated carbon dominates water-treatment tenders owing to precise specification standards and global supply chains that guarantee availability. In concrete, fly ash and ground-granulated blast-furnace slag already serve as supplementary cementitious materials, offering well-documented performance data that engineers trust. Each substitute erodes potential demand where biochar’s co-benefits lack explicit monetary value, forcing producers to compete on delivered-price parity or to bundle carbon-credit upside into sales contracts.
*Our forecasts treat driver/restraint impacts as directional, not additive. The impact forecasts reflect baseline growth, mix effects, and variable interactions.
Segment Analysis
By Technology: Pyrolysis Retains an Economic Edge but Faces Rapid Diversification
Slow and intermediate pyrolysis systems held 44.72% of biochar market share in 2025 thanks to reliable throughput, flexible feedstock windows, and a coproduct slate that includes bio-oil and syngas. These attributes let operators layer electricity or heat revenue onto core biochar sales, raising overall project internal-rate-of-return figures. Capital-intensive rotary-kiln designs dominate high-volume installations, while smaller retort units serve on-farm programmes that target regenerative agriculture. The wider diffusion of continuous-feed reactors has triggered process-control improvements, enabling better yield consistency and tighter emissions control, an aspect that simplifies permitting in air-quality-sensitive regions.
Alternative routes are gaining mindshare because they process high-moisture substrates without costly pre-drying. Hydrothermal carbonisation runs at 180–260 °C and converts sewage sludge into carbon-rich hydrochar suitable for soil amendment or energy applications. Gasification systems, though producing lower char yields, integrate readily with combined-heat-and-power modules, allowing municipal waste managers to transform refuse into baseload electricity and char by-products. R&D consortia in Japan and Germany are piloting microwave-assisted pyrolysis that promises higher energy efficiency and reduced residence times, innovations that could narrow cost gaps against incumbent thermochemical options. Over the forecast window, these emerging systems are anticipated to grow at a 24.63% CAGR, gradually diluting pyrolysis dominance yet collectively lifting the biochar market size as new feedstock classes come online.


By Feedstock: Agricultural Residues Claim Momentum amid Stable Woody Supply Chains
Woody biomass provided 61.15% of total volume in 2025 due to reliable forestry residues, uniform particle sizes, and chemical compositions that yield predictable char quality. Timber-rich geographies such as British Columbia and Scandinavia run dedicated thinning programmes to mitigate wildfire risk, generating a continuous stream of low-value residues that biochar plants can secure on multi-year contracts. High lignin content in conifer fractions also enhances fixed-carbon percentages, a metric prized by carbon-credit auditors for permanence calculations.
The competitive landscape is shifting as corn stover, rice husks, and sugarcane bagasse enter commercial supply agreements. Mobile torrefaction and pyrolysis rigs have demonstrated the logistical viability of converting loose residues where they are generated, bypassing costly bale transport. Agricultural residues are forecast to expand at 25.05% CAGR to 2031, helped by waste-burn bans and landfill taxes that tilt economics toward valorisation. Sewage sludge and animal manure offer nutrient-enriched end-products but must clear tighter contaminant hurdles under European fertiliser regulations. Large urban centres in Brazil and India are exploring public-private partnerships that marry wastewater treatment, renewable power, and biochar credit sales, pointing to an eventual broadening of feedstock portfolios across the biochar market.
By Form: Liquid Suspensions Rise as Precision-Application Demands Intensify
Powder biochar retained leadership with 43.25% share in 2025, a status owed to conventional spreading equipment compatibility and relative ease of bulk handling in grain-belt economies. Particle-size optimisation around the 1–5 mm range strikes a balance between surface area and wind-loss risk, which is critical for side-dress operations. Pelletised formats, though higher in manufacturing cost, suit horticulture blends where uniformity and low dust are paramount.
Liquid suspensions, forecast to clock a 24.21% CAGR, promise new efficiencies. Producers micronise char to sub-100-micron particles, emulsify them with organic binders, and supply growers who already rely on drip-line fertigation. Field trials show faster infiltration and better root-zone distribution compared with granular products, which translates into lower per-hectare dosage rates. The format mitigates occupational dust exposure and allows co-formulation with micronutrients or microbial inoculants, sharpening competitive differentiation. As irrigation-water availability tightens in arid zones, the ability to deliver soil amendments through existing drip infrastructure will likely cement liquid biochar as a mainstream option, gradually lifting its share of the broader biochar market.
By Application: Agriculture Anchors Demand, while Industrial Use-Cases Accelerate
Agriculture accounted for 58.54% of deployed volumes in 2025, reflecting decades of academic field trials that document yield boosts, moisture retention, and microbial-activity gains on marginal soils. Public cost-share programmes further buttress uptake by underwriting the initial treatment expense for growers who validate soil-organic-carbon increases. Precision-ag platforms now bundle variable-rate biochar prescriptions into digital agronomy services, thereby lowering application costs and offering data-rich verification packages for carbon-credit issuances.
Beyond the farmgate, industrial applications are set to grow at 25.1% CAGR, pushing the biochar market into new revenue verticals. Water-utility pilots report heavy-metal and PFAS removal efficiencies above 90%, a performance that competes favorably with virgin activated carbon at lower embodied-carbon scores. Construction companies have co-designed mix designs where 4-10% by weight of cement is replaced with biochar, achieving compressive-strength parity alongside embodied-carbon cuts approaching 25% per cubic metre of concrete. Steelmakers in South Korea and Austria are evaluating injection-grade biochar that partially offsets pulverised coal in blast-furnace operations, a pathway that supports scope-1 decarbonisation targets in a hard-to-abate sector. Collectively, these industrial proofs-of-concept expand total addressable volume and diversify revenue streams beyond cyclical agricultural demand.
Geography Analysis
Asia-Pacific captured 39.88% of global shipments in 2025, reflecting an abundant biomass resource base, emerging carbon-removal targets, and generous public R&D funding. China alone publishes over 200 peer-reviewed biochar papers each year, underpinning its leadership in reactor design, agronomic testing, and carbon-credit protocol development. Provincial subsidies lower the capital cost of rural pyrolysis units, enabling small municipalities to turn crop residues into products that meet national soil-restoration goals.
North America ranks second in volume but leads in commercial carbon-credit transactions. High-profile corporate offtake agreements, including Microsoft’s multi-year procurement of 95,000 tCO₂e from Pacific-Northwest facilities, provide predictable revenue tails that derisk debt financing. Federal incentives—ranging from production tax credits to USDA cost-share grants—further catalyse plant-level investment. Although the region’s mature regulatory framework accelerates deployment, growth rates will moderate compared with emerging Asia because early movers have already secured a large share of easily accessible feedstocks.
Europe clusters around quality standards and policy alignment. Draft EU rules governing carbon-removal verification encourage member states to harmonise methodologies, facilitating cross-border trade in removal credits. Scandinavian countries, confronted with stringent national net-zero deadlines, are testing district-heating link-ups where waste-wood pyrolysis supplies both thermal energy and high-carbon biochar. Meanwhile, Latin America and Sub-Saharan Africa present long-term upside tied to abundant agricultural residues yet lag on financing and infrastructure. Development-finance institutions are piloting blended-capital funds that could unlock these frontier markets, potentially adding significant incremental tonnage to the global biochar market after 2028.

Competitive Landscape
The global biochar market remains higly fragmented, with the top five producers accounting for well under 30% of installed capacity. Fragmentation stems from local feedstock realities; trucking low-density biomass more than 80 km erodes margins, so most facilities stay regional. Consequently, small and mid-sized firms using kiln capacities below 10,000 tons per year dominate rural supply. Large incumbents are beginning to integrate vertically—securing forestry rights, investing in mobile harvesters, and forming offtake pacts with concrete makers—to lock in both inputs and high-value outputs.
Process innovation is an active battleground. Firms in the United States and Germany commercialised continuous-flow, auger-fed reactors that improve yield predictability while trimming labour costs. Others concentrate on modular skids that can be dropped beside sawmills or municipal-waste sites, slashing feedstock transport expense. Quality differentiation is sharpening as well; manufacturers now market application-specific grades that vary in pH, ash content, and surface area to suit plantation crops, water-filtration beds, or construction mixes.
Strategic financing shapes market share trajectories. Venture-backed start-ups often rely on forward carbon-credit sales to large multinationals, converting future cashflows into upfront capital. In contrast, publicly listed biochar firms tap green bonds or sustainability-linked loans that reward production milestones tied to verified carbon removal. Cross-industry alliances—cement majors taking equity stakes in char producers, for instance—signal the emergence of captive supply models aimed at securing low-carbon feedstocks for hard-to-abate sectors.
Biochar Industry Leaders
Airex Energy
Pyreg GmbH
Carbon Gold Ltd
Phoenix Energy
Biochar Now LLC
- *Disclaimer: Major Players sorted in no particular order

Recent Industry Developments
- October 2024: Myno Carbon received USD 20.4 million from the US Department of Agriculture (USDA) Fertilizer Production Expansion Program to construct a biochar carbon removal facility (CRF 001) in Port Angeles, Washington. The facility will increase the production of biochar-enhanced fertilizers that improve crop yields, enhance water retention, reduce nutrient loss, and support sustainable agricultural practices.
- July 2024: Applied Carbon secured USD 21.5 million in funding to expand its biochar production technology, which converts agricultural waste into biochar in a single process. The company plans to deploy mobile pyrolysis units across multiple states.


Global Biochar Market Report Scope
Biochar is a type of charcoal produced from organic materials like agricultural waste, wood chips, or biomass through a process called pyrolysis. It is used primarily as a soil amendment to improve soil fertility, water retention, and carbon sequestration.
The biochar market is segmented by technology and application. On the basis of technology, the market is segmented into pyrolysis, gasification systems, and other technologies (hydrothermal carbonization). On the basis of application, the global market studied is segmented into agriculture, animal farming, industrial uses, and other applications (environmental remediation. The market forecast report also covers the market sizes, growth forecast, and market outlook for the biochar industry in 27 countries across the major region. For each segment, the market sizing, forecasts and industry growth were made on the basis of volume (tons).
By Technology
| Pyrolysis |
| Gasification Systems |
| Other Technologies (Hydrothermal Carbonization) |
By Feedstock
| Woody Biomass |
| Agricultural Residues |
| Animal Manure |
| Sewage Sludge and Organic Waste |
By Form
| Powder |
| Pellets/Granules |
| Liquid Suspension |
By Application
| Agriculture |
| Animal Farming |
| Industrial Uses |
| Other Applications (Construction Materials, Energy, etc.) |
By Geography
| Asia-Pacific | China |
| Japan | |
| India | |
| South Korea | |
| ASEAN Countries | |
| Rest of Asia-Pacific | |
| North America | United States |
| Canada | |
| Mexico | |
| Europe | Germany |
| United Kingdom | |
| France | |
| Italy | |
| Spain | |
| Russia | |
| NORDIC Countries | |
| Rest of Europe | |
| South America | Brazil |
| Argentina | |
| Rest of South America | |
| Middle East and Africa | Saudi Arabia |
| South Africa | |
| Rest of Middle East and Africa |
| By Technology | Pyrolysis | |
| Gasification Systems | ||
| Other Technologies (Hydrothermal Carbonization) | ||
| By Feedstock | Woody Biomass | |
| Agricultural Residues | ||
| Animal Manure | ||
| Sewage Sludge and Organic Waste | ||
| By Form | Powder | |
| Pellets/Granules | ||
| Liquid Suspension | ||
| By Application | Agriculture | |
| Animal Farming | ||
| Industrial Uses | ||
| Other Applications (Construction Materials, Energy, etc.) | ||
| By Geography | Asia-Pacific | China |
| Japan | ||
| India | ||
| South Korea | ||
| ASEAN Countries | ||
| Rest of Asia-Pacific | ||
| North America | United States | |
| Canada | ||
| Mexico | ||
| Europe | Germany | |
| United Kingdom | ||
| France | ||
| Italy | ||
| Spain | ||
| Russia | ||
| NORDIC Countries | ||
| Rest of Europe | ||
| South America | Brazil | |
| Argentina | ||
| Rest of South America | ||
| Middle East and Africa | Saudi Arabia | |
| South Africa | ||
| Rest of Middle East and Africa | ||


Key Questions Answered in the Report
What is the current size of the biochar market?
The biochar market size reached 0.88 million tons in 2026 and is projected to rise to 2.59 million tons by 2031 at a 24.11% CAGR.
Which region leads global demand?
Asia-Pacific held 39.88% of global volume in 2025 and is expected to maintain leadership thanks to abundant biomass and supportive policy measures.
What technology is most widely used to produce biochar?
Slow and intermediate pyrolysis dominate, capturing 44.72% of 2025 production because they balance high char yields with valuable syngas and bio-oil coproducts.
Why are carbon credits important for the biochar market?
Credits priced above USD 100 per tonne CO₂e add a second revenue stream, improving project economics and attracting institutional finance for new capacity.
Which application is growing fastest outside agriculture?
Industrial uses—including water treatment, concrete, and metals processing—are forecast to expand at 25.1% CAGR to 2031, outpacing agricultural growth rates.
Page last updated on:


