
Market Overview
| Study Period | 2021 - 2031 |
|---|---|
| Market Size (2026) | USD 59.1 Billion |
| Market Size (2031) | USD 84.79 Billion |
| Growth Rate (2026 - 2031) | 7.49 % |
| Fastest Growing Market | Asia Pacific |
| Largest Market | North America |
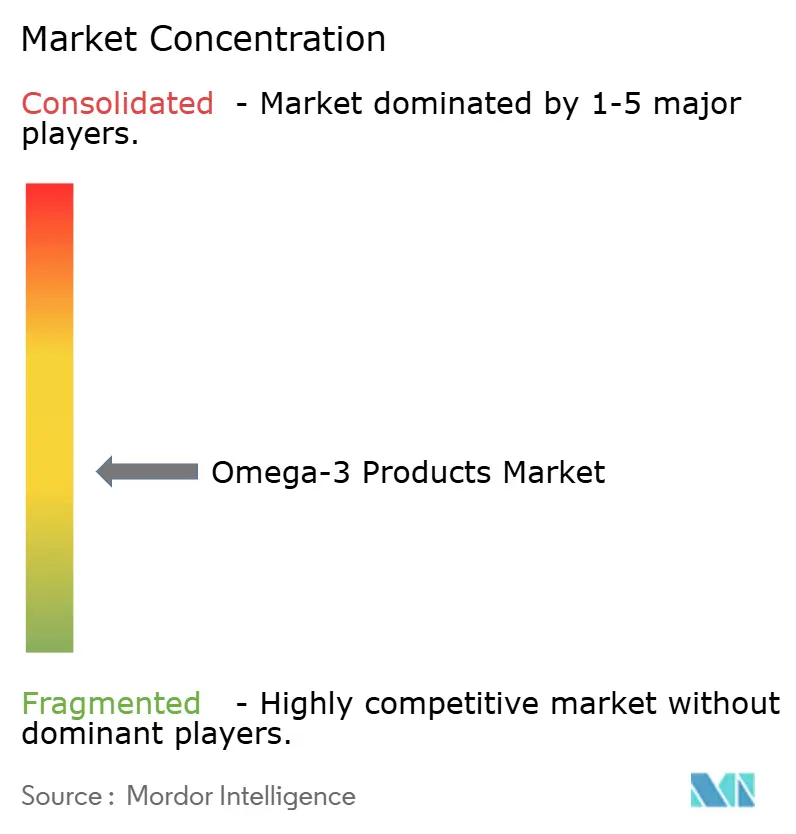
| Market Concentration | Medium |
Major Players
*Disclaimer: Major Players sorted in no particular order Image © Mordor Intelligence. Reuse requires attribution under CC BY 4.0. |
|
Omega-3 Products Market Analysis by Mordor Intelligence
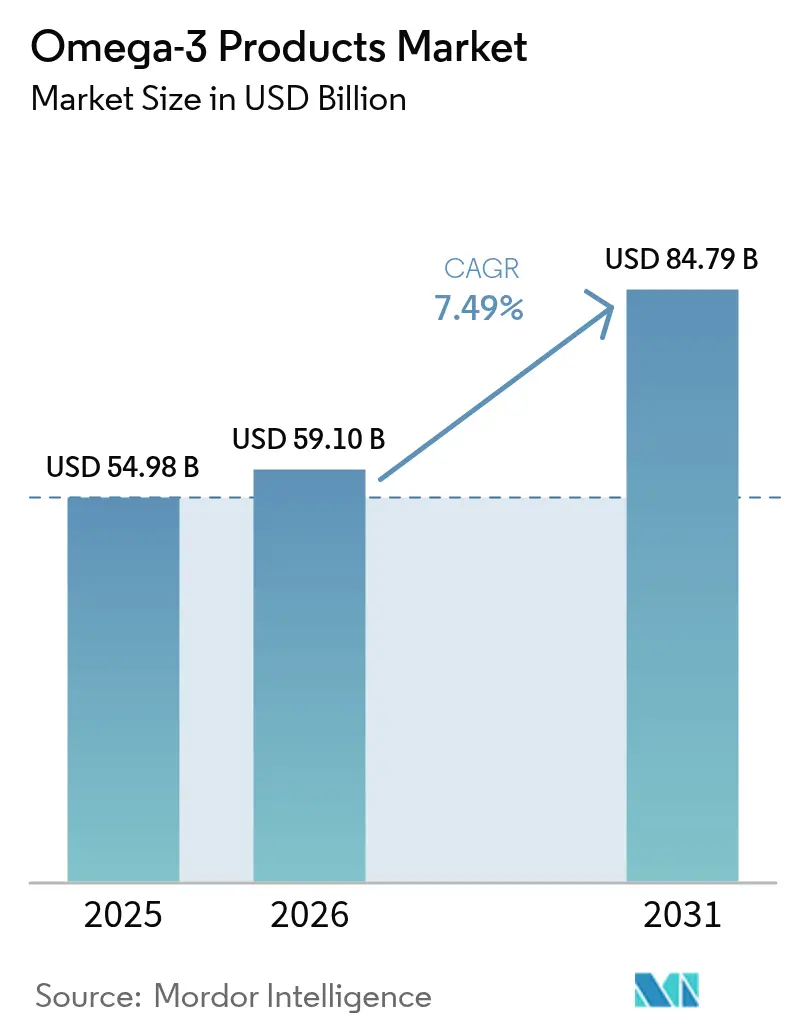
Omega-3 products market size in 2026 is estimated at USD 59.1 billion, growing from 2025 value of USD 54.98 billion with 2031 projections showing USD 84.79 billion, growing at 7.49% CAGR over 2026-2031. The market expansion is driven by increasing consumer awareness about healthy and natural products, particularly in developed regions where nutritional supplements are gaining popularity. The growing demand for plant-based products, supported by rising health consciousness, further contributes to market growth. Consumers are increasingly seeking omega-3 supplements derived from sources like algae and flaxseed, reflecting a broader shift toward sustainable and plant-based alternatives. The market also benefits from the growing incorporation of omega-3 ingredients in functional foods, beverages, and dietary supplements, catering to diverse consumer preferences and nutritional needs.
Key Report Takeaways
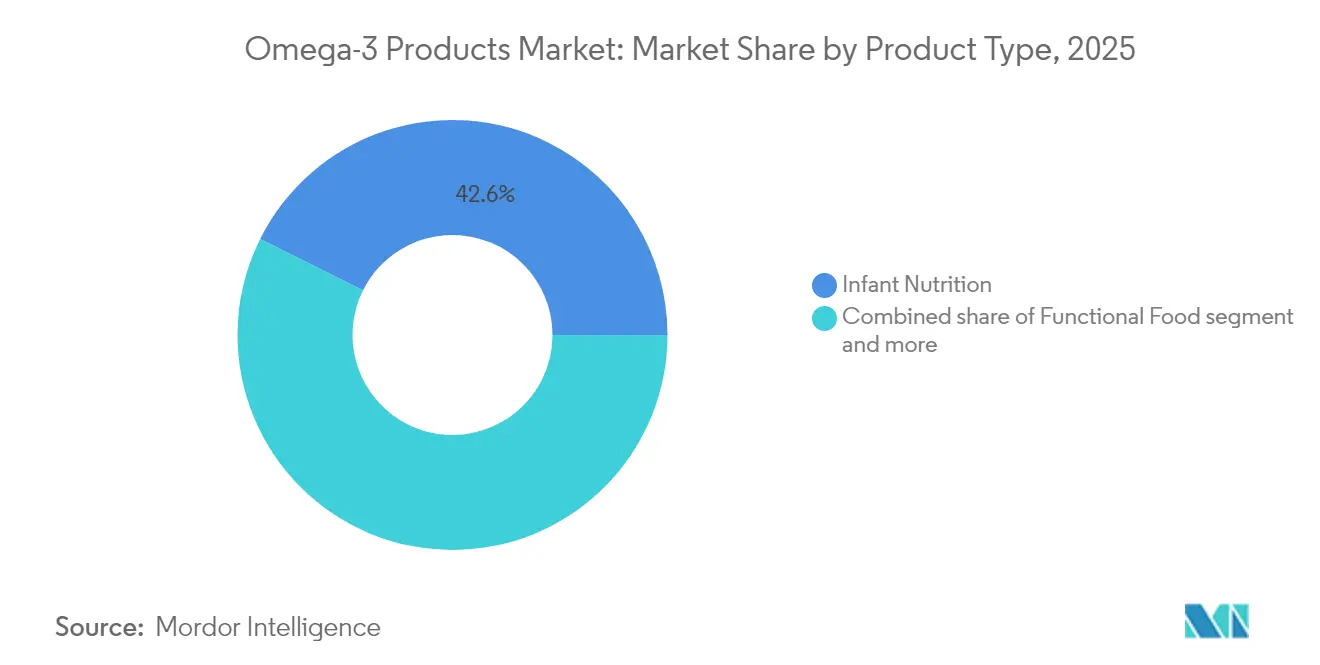
- By product type, infant nutrition dominates with 42.63% market share in 2025, while functional foods emerge as the fastest-growing segment at 8.62% CAGR (2026-2031).
- By source, animal-based sources maintain market leadership with 79.41% share in 2025, yet plant-based alternatives accelerate at 8.77% CAGR (2026-2031).
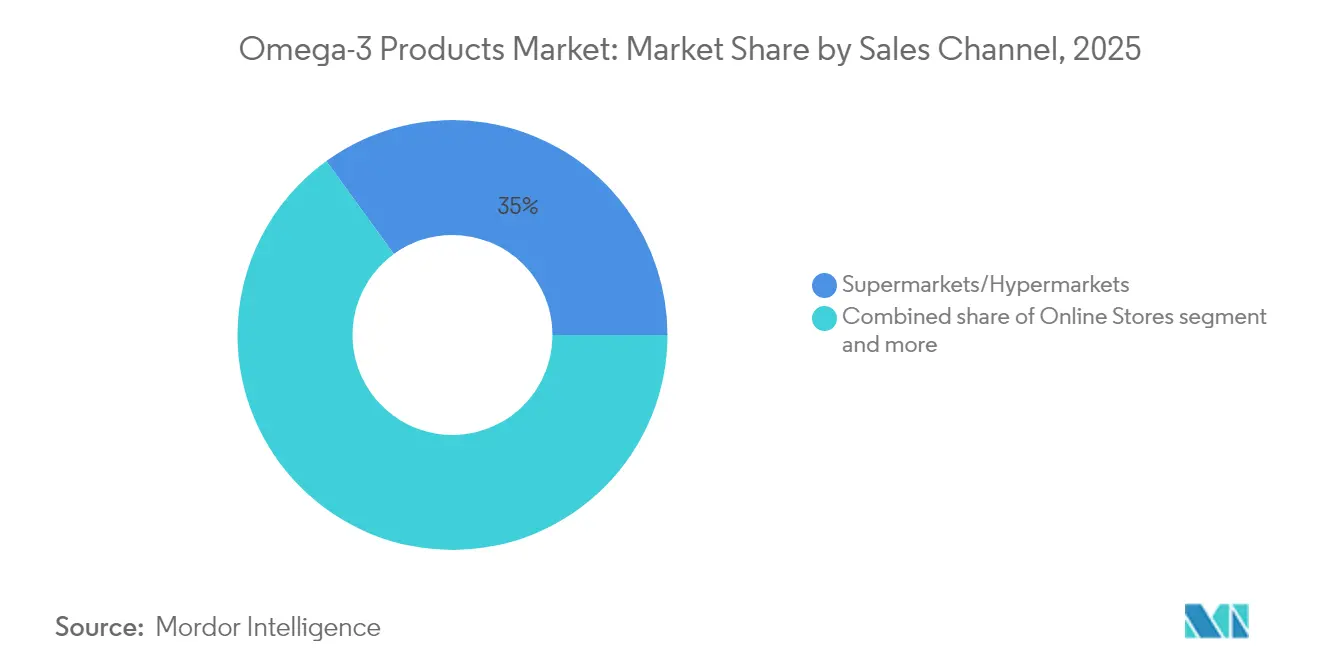
- By distribution channels, supermarkets/hypermarkets retain the largest share at 34.98% in 2025, while online stores surge at 9.31% CAGR (2026-2031).
- By geography, North America leads with 29.85% market share in 2025, while Asia-Pacific emerges as the fastest-growing region at 8.81% CAGR (2026-2031).
Note: Market size and forecast figures in this report are generated using Mordor Intelligence’s proprietary estimation framework, updated with the latest available data and insights as of 2026.
Global Omega-3 Products Market Trends and Insights
Drivers Impact Analysis*
| Driver | (~) % Impact on CAGR Forecast | Geographic Relevance | Impact Timeline |
|---|---|---|---|
| Growing demand for brain development and joint health supplements | +1.8% | Global, with concentration in North America and Europe | Medium term (2-4 years) |
| Increasing demand for DHA and EPA in prenatal and infant nutrition | +1.5% | Global, strongest in Asia-Pacific emerging markets | Long term (≥ 4 years) |
| Surging demand for omega-3 enriched pet nutrition products supporting coat health | +1.2% | North America and Europe, expanding to Asia-Pacific | Short term (≤ 2 years) |
| Augumented demand for omeaga-3 in functional food | +0.9% | Europe and North America, growing in Asia-Pacific | Medium term (2-4 years) |
| Expansion of personalized and gender-specific omega-3 products | +0.7% | North America and Europe, niche adoption globally | Long term (≥ 4 years) |
| Technological advancements in extraction, purification, and microencapsulation | +0.8% | Global, led by developed markets | Medium term (2-4 years) |
| Source: Mordor Intelligence | |||
Growing demand for brain development and joint health supplements
Various research studies demonstrate omega-3s' expanding effectiveness in cognitive health applications beyond traditional cardiovascular benefits. Clinical studies show that high-dose EPA formulations deliver superior efficacy in migraine prevention compared to conventional medications, with patients reporting significant reductions in frequency and intensity of episodes. The U.S. Department of Defense's comprehensive investigation of omega-3 supplements for mild traumatic brain injury treatment in March 2025 validates these neurological benefits through extensive clinical trials and documentation [1]Source: United States Department of Defense, "OMEGA-3 SUPPLEMENTS FOR MILD TRAUMATIC BRAIN INJURY," defense.gov. Moreover, clinical evidence and institutional adoption drive the development of cognitive health formulations at premium prices, especially for therapeutic uses. Studies show that postmenopausal women absorb EPA and DHA at higher rates compared to men, revealing metabolic differences that inform product development. These gender-based variations in bioavailability and efficacy create opportunities for personalized omega-3 products.
Increasing demand for DHA and EPA in prenatal and infant nutrition
The European Food Safety Authority's approval of Schizochytrium limacinum oil for infant and follow-on formula applications has strengthened regulations supporting DHA inclusion in infant formulas. This approval expands the available sources of DHA beyond traditional fish oil derivatives. The EFSA safety assessment confirmed that the oil, containing 40-43% DHA of total fatty acids, meets EU regulations for mandatory DHA content in infant formulae. This assessment aligns with European Food Safety Authority data from 2025 [2]Source: European Food Safety Authority, “Oil from Schizochytrium limacinum for Infant Formula,” efsa.europa.eu. Various clinical studies demonstrate that DHA and arachidonic acid supplementation in infant formulas leads to positive developmental outcomes, including improved cognition and visual acuity, with optimal ratios mimicking breast milk composition. The convergence of regulatory approval and clinical evidence creates sustained demand despite declining birth rates in developed markets. Low- and middle-income countries present growth opportunities as accessibility to animal-source foods increases and awareness of early childhood nutrition benefits expands
Surging demand for omega-3 enriched pet nutrition products supporting coat health
Pet nutrition emerges as a high-growth application driven by humanization trends and scientific evidence supporting omega-3 benefits for companion animals. DSM-Firmenich's Veramaris Pets demonstrates market innovation with 60% EPA and DHA content, more than double that of fish oil, addressing both potency and sustainability concerns in pet food formulations. The company's DHAgold™ product line provides DHA fortification proven to enhance brain health in dogs, expanding applications beyond traditional coat and skin benefits. Pet owners increasingly mirror their health consciousness in pet care decisions, creating demand for premium formulations with documented health benefits. The algal sourcing strategy addresses environmental concerns while delivering superior potency, positioning companies to capture both sustainability-conscious and performance-oriented segments. Market dynamics favor companies that can demonstrate clear health outcomes through clinical research, as pet owners seek evidence-based nutrition solutions comparable to human supplements.
Augmented demand for omeaga-3 in functional food
The advancement of microencapsulation technologies enables the stable incorporation of omega-3 into dairy products, beverages, and baked goods without affecting taste or shelf life. These technologies specifically target the protection of omega-3 fatty acids from oxidation and degradation during processing and storage. Improvements in complex coacervation and spray-drying techniques enhance oxidative stability and bioavailability, resolving previous challenges in food applications. The techniques also ensure uniform distribution of omega-3 compounds throughout the food matrix, maintaining product consistency. The European market provides a supportive regulatory framework for omega-3 innovation through established health claims and recommended intake levels, while the United States market has restrictions on EPA and DHA content claims. This regulatory environment influences product development strategies and marketing approaches across different regions. The combination of enhanced processing technologies and increasing consumer demand for functional foods allows manufacturers to implement omega-3 fortification strategies with premium pricing potential. This market opportunity extends across various food categories, from infant formula to sports nutrition products, reflecting the diverse applications of omega-3 fortification.
Restraints Impact Analysis*
| Restraint | (~) % Impact on CAGR Forecast | Geographic Relevance | Impact Timeline |
|---|---|---|---|
| High production cost | -0.8% | Global, most acute in emerging markets | Short term (≤ 2 years) |
| Limited consumer awareness regarding omega-3 products | -0.4% | Asia-Pacific and emerging markets primarily | Medium term (2-4 years) |
| Sustainability concern over sourcing of omega-3 ingredients | -0.2% | Europe and North America, spreading globally | Long term (≥ 4 years) |
| Short shelf life and oxidation challenges constrain market growth | -0.1% | Global, affecting all product categories | Medium term (2-4 years) |
| Source: Mordor Intelligence | |||
High production cost
Small and medium-sized brands experience significant pricing pressures due to their limited negotiating power for alternative sourcing arrangements and reduced ability to absorb margin reductions. These companies often struggle to maintain profitability when raw material costs increase, as they lack the economies of scale that larger competitors possess. Companies are exploring ingredient reformulation and alternative sourcing strategies to manage costs, including the use of algal omega-3 sources, despite their higher production expenses. The shift toward algal sources represents a growing trend in the industry, though the technology and production infrastructure remain costly. Environmental factors and increased aquaculture demand create fish oil supply constraints, as limited marine resources cannot meet the growing global demand. The strain on wild fish stocks, coupled with climate change impacts and fishing quotas, further complicates the supply situation. Companies that maintain vertically integrated supply chains or long-term sourcing contracts hold competitive advantages during periods of cost inflation, as they can better control their supply chain and maintain more stable pricing structures.
Limited consumer awareness regarding omega-3 products
A significant knowledge gap exists between consumer recognition of fish oil products and understanding of omega-3s as their beneficial component. While fish oil supplements are widely recognized in the market, many consumers lack comprehensive awareness of omega-3s and their specific health benefits, including cardiovascular health, brain function, and joint support. This understanding gap particularly limits market growth in emerging markets where health supplement usage is still developing. The rise of personalized nutrition presents opportunities to improve consumer awareness through targeted education programs, biomarker testing, and customized supplement recommendations. Consumers increasingly use health data tracking through mobile applications and wearable devices to guide their supplement choices and monitor health outcomes. Healthcare providers, nutritionists, and industry associations continue to address these awareness gaps through educational initiatives based on scientific evidence, clinical studies, and public health campaigns. The development of consumer education programs focuses on explaining the relationship between omega-3 intake and specific health benefits, proper dosage guidelines, and the importance of regular supplementation.
*Our forecasts treat driver/restraint impacts as directional, not additive. The impact forecasts reflect baseline growth, mix effects, and variable interactions.
Segment Analysis
By Product Type: Infant Nutrition Stability Contrasts Functional Food Innovation
Infant nutrition holds the largest market share at 42.63% in 2025, driven by regulatory requirements and clinical studies showing benefits for cognitive development. This dominance is further strengthened by increasing parental awareness of early childhood nutrition and growing disposable income in developing regions. The functional food segment is projected to grow at 8.62% CAGR (2026-2031), supported by advances in fortification technology and increasing consumer demand for convenient nutrition options. This growth is particularly evident in ready-to-drink beverages, fortified cereals, and dairy products enriched with omega-3 fatty acids.
The dietary supplements segment maintains strong market presence, driven by consumers seeking targeted nutritional benefits, particularly among aging populations and fitness enthusiasts. The animal feed segment demonstrates steady growth as aquaculture and pet food manufacturers integrate omega-3 enrichment to address demand for premium pet nutrition and sustainable fish farming. The market continues to expand in infant formula applications, as evidenced by Bobbie's April 2025 launch of the first USDA organic infant formula with soy-based milk and increased DHA levels.



By Source: Plant-Based Disruption Challenges Animal-Based Dominance
Animal-based sources hold a 79.41% market share in 2025 due to established supply chains, widespread consumer acceptance, and proven efficacy in delivering essential nutrients. Plant-based alternatives are growing at an 8.77% CAGR (2026-2031), driven by sustainability concerns, technological advancements in extraction methods, and increasing consumer preference for environmentally friendly options.
Market players are responding to increased plant-based demand with new product launches and innovations in formulation. In December 2024, Nature's Bounty introduced algae-omega-3 supplements targeting heart, skin, and joint health, demonstrating the industry's shift toward sustainable alternatives. The market accommodates both fish and plant-based sources, with algal products commanding premium prices from sustainability-focused consumers while fish oil maintains cost advantages in price-sensitive segments. This dual market structure enables manufacturers to serve diverse consumer preferences while maintaining profitable operations across different price points.
By Sales Channel: Digital Transformation Accelerates Direct-to-Consumer Growth
Supermarkets/hypermarkets hold a 34.98% market share in 2025 through their established distribution networks and consumer shopping patterns. Online stores are growing at a 9.31% CAGR (2026-2031), supported by personalized nutrition preferences and direct-to-consumer distribution. Traditional retail channels benefit from impulse purchases and immediate product availability, especially for common omega-3 supplements used in general health maintenance. Health and specialty stores remain important due to their expert consultation services and premium product offerings, attracting consumers who seek specialized formulations and professional guidance.
The growth in online retail aligns with increased e-commerce adoption, enabling personalized nutrition through biomarker testing and product recommendations. Digital platforms support subscription models and direct manufacturer-to-consumer relationships, which reduce distribution costs and provide data for product development. Health and specialty stores implement omnichannel strategies by combining in-person consultations with online ordering to maintain market position.
Geography Analysis
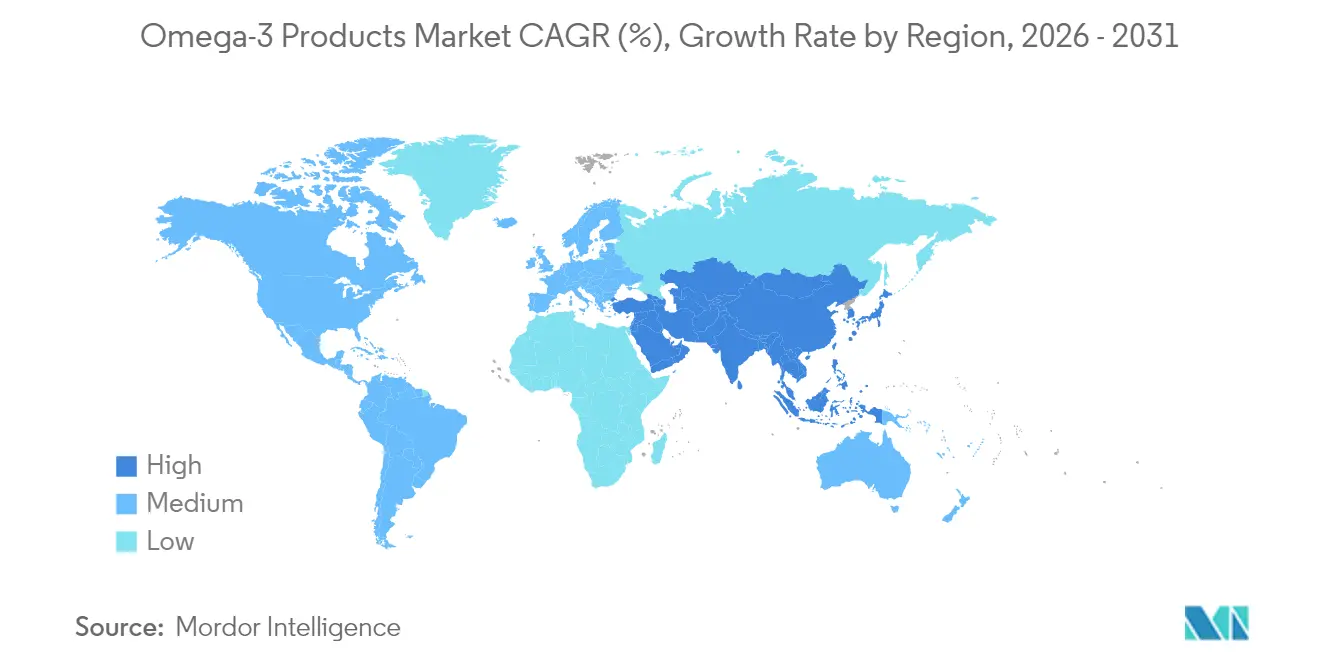
North America holds a 29.85% market share in 2025, driven by established supplement consumption patterns, clear regulatory frameworks for health claims, and widespread consumer understanding of omega-3 benefits. The region's robust distribution networks and healthcare provider endorsements contribute to market growth. According to the American Heart Association's 2024 data, the recommendation of two fatty fish servings weekly, along with supplement use for dietary gaps, supports market expansion . The regulatory environment allows companies to make qualified health claims for cardiovascular benefits, enhancing market development. The region's emphasis on personalized nutrition and premium products creates market opportunities for new formulations and delivery systems.
Asia-Pacific demonstrates the highest growth rate at 8.81% CAGR (2026-2031), supported by increasing disposable incomes, growing health awareness, and an expanding middle class seeking preventive health solutions. BASF's Chinese market expansion indicates the industry's recognition of regional opportunities, with Asia-Pacific designated as a primary market for nutrition and health products. The region's varying regulatory frameworks present market challenges and opportunities, as countries develop different approaches to functional foods and dietary supplements. The cultural familiarity with seafood consumption in Asian markets provides a foundation for omega-3 supplement adoption.
Europe maintains a strong market position through comprehensive regulatory frameworks and consumer acceptance of functional foods, supported by the European Union Health Claims Registry's clear marketing guidelines. The region's commitment to sustainability drives demand for algal and plant-based omega-3 sources, reflecting consumer preferences for ethical products. While regulatory requirements create market entry barriers, they ensure product quality and consumer safety, supporting premium pricing. Europe's aging population and focus on healthy aging maintain consistent demand for omega-3 products targeting cognitive and cardiovascular health.

Regulatory Landscape
Omega-3 products operate under food, supplement, and infant nutrition rules that vary by region, which affects allowable formats and on-pack claims. In the European Union, nutrition and health claims for foods must be authorized under Regulation (EC) No 1924/2006 and listed in the Union register, and the European Commission continues to gate keep claims tightly (e.g., Commission Regulation (EU) 2026/1118, published May 26, 2026, refusing a cognition-related health claim), maintaining a high evidence threshold that also shapes how omega-3 is marketed.
Labeling and composition requirements are also jurisdiction-specific. In Australia and New Zealand, FSANZ requires defined omega-3 declarations (such as ALA, DHA, and EPA) when omega-3 claims are made on foods through the Nutrition Information Panel requirements, while the United States focuses on FDA labeling guidance and evolving food program regulations under development (with Unified Agenda items updated through 2026). These differences increase the need for region-tailored label architectures and claim substantiation across supplements, functional foods, and infant nutrition applications.
Value Chain Analysis
The omega-3 value chain starts with upstream inputs sourced from marine fisheries (notably anchovy), krill, fish byproducts (trimmings and skins), and non-marine routes such as microalgae cultivation and fermentation-derived oils. Midstream processing concentrates on extraction, refining, purification, and stabilization, including microencapsulation to reduce oxidation and sensory issues, which then supplies ingredient forms such as oils, emulsions, and powders for downstream use in infant nutrition, dietary supplements, functional foods, and animal nutrition. Quality systems focus on contaminants and oxidative stability.
Control over feedstock and processing capacity is an increasingly visible differentiator. KD Pharma Group strengthened vertical access by acquiring dsm-firmenichs marine lipids business in July 2024 (including the MEG-3 brand and facilities in Piura, Peru, and Mulgrave, Canada), while Nuseed Nutritional US Inc. (Nufarm) partnered with KD Nutra in July 2024 to expand plant-based long-chain omega-3 offerings. Distribution spans branded consumer channels (supermarkets/hypermarkets, health and specialty retail, and online DTC) and B2B ingredient supply to food and formula manufacturers. Supply reliability is affected by climate-driven fishery variability and logistics disruptions, which encourages multi-source strategies and longer-term supply arrangements.
Competitive Landscape
The omega-3 products market shows moderate fragmentation, enabling established companies to maintain their positions while allowing new entrants to capture market segments through targeted product innovation and strategic positioning. The market's key players include Nestlé SA, Now Health Group, Amway Corporation, H&H Group, and KD Pharma Group.
Companies focus on technological differentiation through significant investments in microencapsulation to improve product stability and shelf life, extraction optimization to increase yield and purity, and bioavailability enhancement to ensure better nutrient absorption. These technological advancements enable manufacturers to improve product performance and maintain premium pricing in the market. Significant opportunities exist in personalized nutrition solutions based on genetic profiles and health conditions, gender-specific formulations that address unique nutritional needs, and innovative delivery formats such as emulsions, powders, and concentrated liquids that enhance consumer convenience while maintaining product effectiveness.
New market entrants implement precision fermentation techniques and advanced algal cultivation methods to overcome traditional marine supply chain limitations and address growing sustainability concerns. Companies are expanding their production capabilities through investments in automated facilities and scalable technologies. Ingredient suppliers and finished product manufacturers establish strategic partnerships to facilitate market entry, share development costs, and minimize risks. These collaborations are particularly crucial for companies developing alternative omega-3 sources from microalgae, single-cell organisms, and plant-based materials, as well as those creating novel delivery technologies such as nano-emulsions and targeted release systems.
Omega-3 Products Industry Leaders
-
Nestlé SA
-
Now Health Group
-
Amway Corporation
-
KD Pharma Group
-
H&H Group
- *Disclaimer: Major Players sorted in no particular order

Market Opportunities and Future Outlook
Product and sourcing diversification is a key opportunity as supply volatility and sustainability scrutiny push portfolios beyond conventional fish oil. Industry participants are already emphasizing resilience levers such as regional and species diversification and inventory strategies (e.g., Epax citing diversification measures and crude oil stockpiling in 2026). Fermentation-derived microalgae EPA and DHA also provides a pathway to reduce dependence on seasonal marine catch cycles, creating room for brands that can scale algae-based inputs while sustaining competitive cost and sensory performance across supplements, functional foods, and infant nutrition.
Regulatory and quality requirements also support opportunities for differentiation across the chain. Tighter contaminant scrutiny and monitoring programs in Europe (including a move toward explicit MOAH and MOSH attention in food supplements) increase the value of advanced refining, analytical testing, and traceability systems, favoring suppliers and finished-product brands that can show robust quality assurance. At the category level, omega-fatty-acid delivery formats and use cases are widening beyond traditional capsules into applications such as enriched beverages and gummies, which supports ongoing innovation in stabilization technologies and format engineering for mainstream retail and online channels.
Recent Industry Developments
- June 2026: Nestle entered a strategic innovation partnership with nutrition biotechnology company Helaina to advance research into bioactive proteins for early-life nutrition. While this is not an omega-3 ingredient deal by itself, it reinforces competitive focus on differentiated infant and early-life nutrition innovation where DHA and EPA inclusion and substantiation requirements shape formulation and claims strategies.
- May 2025: Nestle-owned Garden of Life launched OmeGo Full Spectrum Omegas in the United States via Amazon, moving beyond single-omega positioning into a multi-omega blend. The launch expands direct-to-consumer reach in a category where online stores are gaining share and broadens the addressable wellness audience beyond traditional fish-oil shoppers.
- August 2024: Now Health Group launched sugar-free Omega-3 Gummy Chews using ConCordix technology, providing 750 mg of fish oil per chew. The launch highlights the shift toward non-softgel delivery formats that improve convenience and compliance, supporting omega-3 expansion into broader functional and lifestyle supplement usage.


Research Methodology Framework and Report Scope
Market Definition and Coverage
For this study, the omega-3 product market covers finished goods sold with omega-3 as a primary nutrition claim or active ingredient, measured by revenues generated across consumer and institutional channels.
Scope exclusions: We exclude raw omega-3 ingredients sold business to business for further formulation, and we also exclude fresh fish and other whole foods that are not marketed as omega-3 products.
Segmentation Overview
-
By Product Type
- Functional Food
- Dietary Supplements
- Infant Nutrition
- Animal Feed
- Others
-
By Source
- Plant-Based
- Animal-Based
-
By Sales Channel
- Supermarkets/Hypermarkets
- Health and Spectality Store
- Online Stores
- Others
-
By Geography
-
North America
- United States
- Canada
- Mexico
- Rest of North America
-
Europe
- Germany
- United Kingdom
- Italy
- France
- Spain
- Netherlands
- Poland
- Belgium
- Sweden
- Rest of Europe
-
Asia-Pacific
- China
- India
- Japan
- Australia
- Indonesia
- South Korea
- Thailand
- Singapore
- Rest of Asia-Pacific
-
South America
- Brazil
- Argentina
- Colombia
- Chile
- Peru
- Rest of South America
-
Middle East and Africa
- South Africa
- Saudi Arabia
- United Arab Emirates
- Nigeria
- Egypt
- Morocco
- Turkey
- Rest of Middle East and Africa
-
North America
Data Sources, Market Sizing, and Validation
Desk Research
Desk research was used to set the market boundaries, build starting demand signals, and understand how omega-3 products flow through food, supplement, and health categories. We leaned on public, non-paywalled sources such as USDA and NIH fact sheets, FDA guidance and recall databases, EFSA opinions, FAO fisheries and aquaculture statistics, and customs or trade statistics for key oils and related preparations.
To convert those signals into a usable model, we also reviewed company annual reports, investor presentations, product labeling and claims language on brand sites, and reputable press coverage of launches and regulatory actions. For cross-checking company revenue exposure and tracking category mix changes, we used a paid subscription for company financials and news intelligence, and we also referred to a patent database to sense shifts in formulations and delivery formats. The desk sources listed above are illustrative only, and many other publications and data points were used to collect, validate, and clarify information.
Primary Interviews and Surveys
Primary work focused on confirming what is counted as a finished omega-3 product in each channel, and then validating the share split between supplements, fortified foods, infant nutrition, pet-related uses, and health-linked products. We spoke with stakeholders across manufacturing, distribution, retail, and category management, and coverage was balanced across APAC, EMEA, and the Americas so that pricing, claims language, and channel differences could be reflected in model assumptions.
Distribution of primary research fieldwork respondents
| Company type | Respondent position | Region |
|---|---|---|
| Top tier: 38% | CXOs: 13% | APAC: 38% |
| Mid tier: 48% | Functional/Unit leaders: 41% | EMEA: 35% |
| Smaller Players: 14% | Managers: 46% | Americas: 27% |
Market-Sizing & Forecasting
Sizing starts with a top-down build that reconstructs the demand pool by tying consumption of supplements and fortified nutrition to population, health awareness, and channel penetration, which is then adjusted for region-wise pricing and mix. Once the totals are formed, they are corroborated through selective bottom-up approximations, such as sampling average selling prices by format (softgels, liquids, gummies, and powders) and combining them with volume indicators and channel checks.
Key inputs used in the model include supplement participation rates, fortified food and beverage launch intensity, infant nutrition uptake, pet care spending direction, and the relative price premium for plant-based versus animal-based omega-3 sources. Because pricing moves differently across regions, currency timing and local inflation trends were treated as explicit variables rather than applying a single global uplift.
For forecasting, scenario analysis was used, and the scenarios were anchored in interview-based expectations on adoption speed, claims scrutiny, and supply-side constraints that can shift product mix. Where bottom-up checks had gaps, proxies like category revenue exposure from public filings and retail channel mix were used so the model could stay repeatable without relying on non-public sales ledgers.
Data Validation & Update Cycle
Outputs were validated through triangulation across independent signals, and then stress-tested using variance checks by region, channel, and product category so unusual jumps could be explained before sign-off. When outliers appeared, assumptions were re-checked against interview notes and desk indicators, and follow-up calls were triggered if the gap could not be resolved with available evidence.
Each report is refreshed annually, and interim updates are made when a material event shifts pricing, regulatory interpretation, or supply availability. Before delivery, a final review pass is completed so the latest public information is reflected in the market size and the forecast path.
Mordor Intelligence's Omega 3 Product Market Size Compared Against Other Published Estimates
Published market values for omega-3 products often look different because underlying scopes and counting rules are not the same, even when the titles sound similar. The main gaps come from whether the number covers finished omega-3 products or omega-3 ingredients, plus differences in how channels and forms are priced and aggregated.
The biggest gap driver is whether ingredient revenues and commodity-like omega-3 oils are mixed into the total. Mordor Intelligence counts only finished omega-3 products sold into end-use categories, keeping business-to-business ingredient trade outside the market value.
Benchmark comparison
| Source | Market Size | Gaps in Research Methodology |
|---|---|---|
| Mordor Intelligence | USD 54.98 B (2025) | |
| Industry Publisher A | USD 52.76 B (2025) | Uses a different split between product types and channels, and the pricing build appears to lean on a narrower set of retail and supplement price points, which can pull down the blended value. |
| Industry Publisher B | USD 9.32 B (2025) | This estimate aligns more with omega-3 as an ingredient category, so it sizes types and sources of omega-3 rather than the full set of finished products sold as supplements, fortified foods, and related applications. |
The comparison shows that most of the spread is explained by scope, especially finished products versus ingredients, and by how blended pricing is handled across formats and regions. By keeping counting rules tied to observable end-use demand signals and then checking them against price and mix feedback from interviews, the final number stays transparent and repeatable.


Key Questions Answered in the Report
How big is the Omega-3 Products Market?
The global omega-3 products market demonstrated remarkable resilience, reaching USD 59.1 billion in 2026 and projected to expand to USD 84.79 billion by 2031, representing a CAGR of 7.49%.
Which product segment commands the largest share?
Infant nutrition leads with 42.63% of 2025 revenue, anchored by mandatory DHA inclusion in baby formulas.
Which source segment is growing fastest?
Plant-based oils are projected to grow at an 8.77% CAGR between 2026-2031 as sustainability concerns rise.
How fast is the Asia-Pacific region expanding?
Asia-Pacific is expected to record an 8.81% CAGR through 2031, the highest among all regions.
Page last updated on:


 Your data is secure and never sold or shared.


