Oman Foodservice Market Size and Share
Market Overview
| Study Period | 2021 - 2031 |
|---|---|
| Forecast Data Period | 2026 - 2031 |
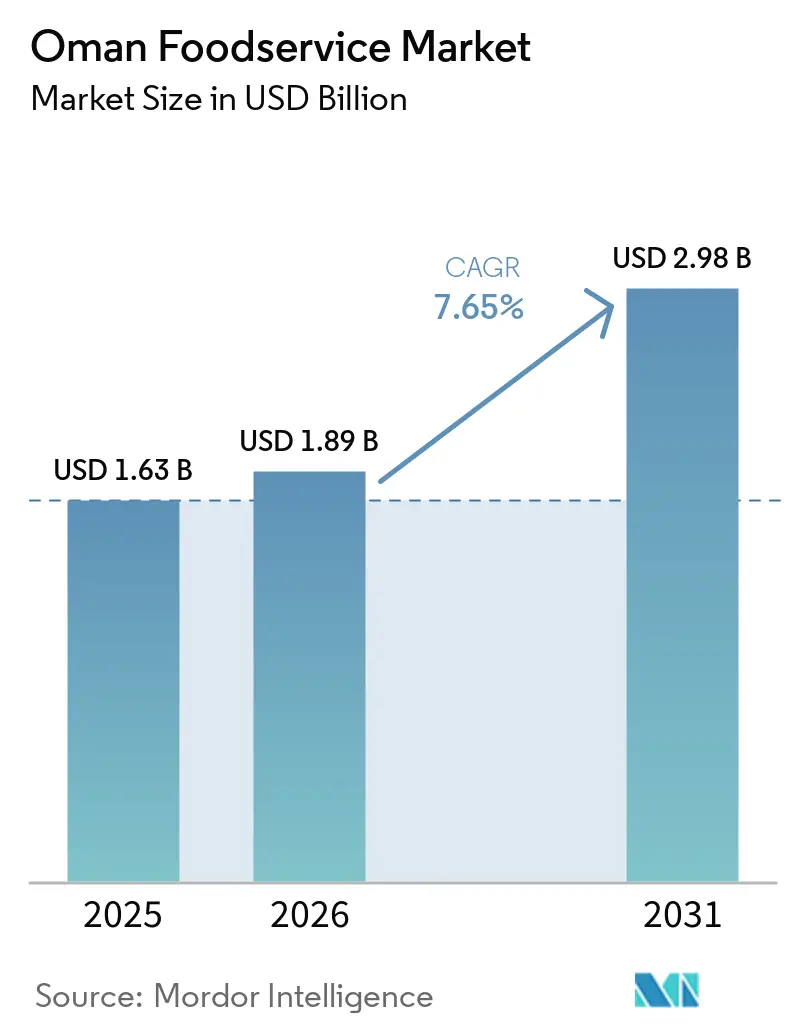
| Base Year Market Size (2025) | USD 1.63 Billion |
| Market Size (2026) | USD 1.89 Billion |
| Market Size (2031) | USD 2.98 Billion |
| Growth Rate (2026 - 2031) | 7.65% CAGR |
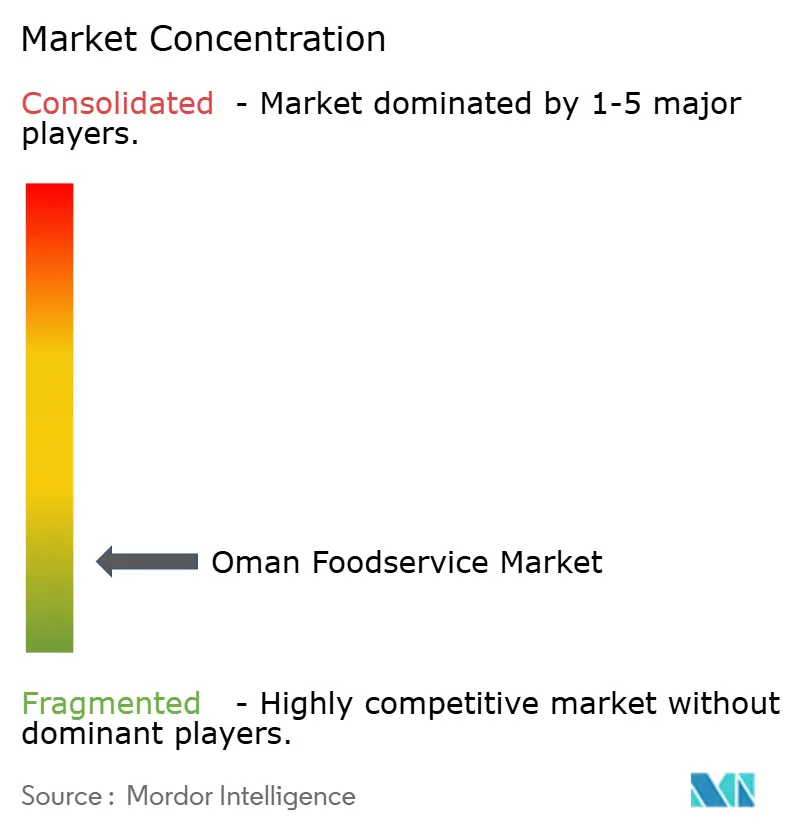
| Market Concentration | Low |
Major Players*Disclaimer: Major Players sorted in no particular order Image © Mordor Intelligence. Reuse requires attribution under CC BY 4.0. | |
Oman Foodservice Market Analysis by Mordor Intelligence
The Oman foodservice market size is expected to grow from USD 1.63 billion in 2025 to USD 1.89 billion in 2026 and is forecast to reach USD 2.98 billion by 2031 at 7.65% CAGR over 2026-2031. Steady economic diversification under Vision 2040, rapid tourism infrastructure development, and supportive fiscal incentives together underpin this upward trajectory. Growing disposable incomes, expanding urban middle-class households, and a vibrant youth demographic sustain transaction volumes across dine-in, takeaway, and delivery channels. Mandatory e-payment compliance has accelerated digital ordering, allowing operators to unlock new customer touchpoints and optimize working-capital cycles. Simultaneously, robust food security programs strengthen local supply chains, tempering price volatility and enabling health-driven menu reformulation. While rising labor, energy, and rental costs pose structural headwinds, operators equipped with technology, local sourcing strategies, and compliance agility remain well-positioned to capture incremental demand across the Oman foodservice market.
Key Report Takeaways
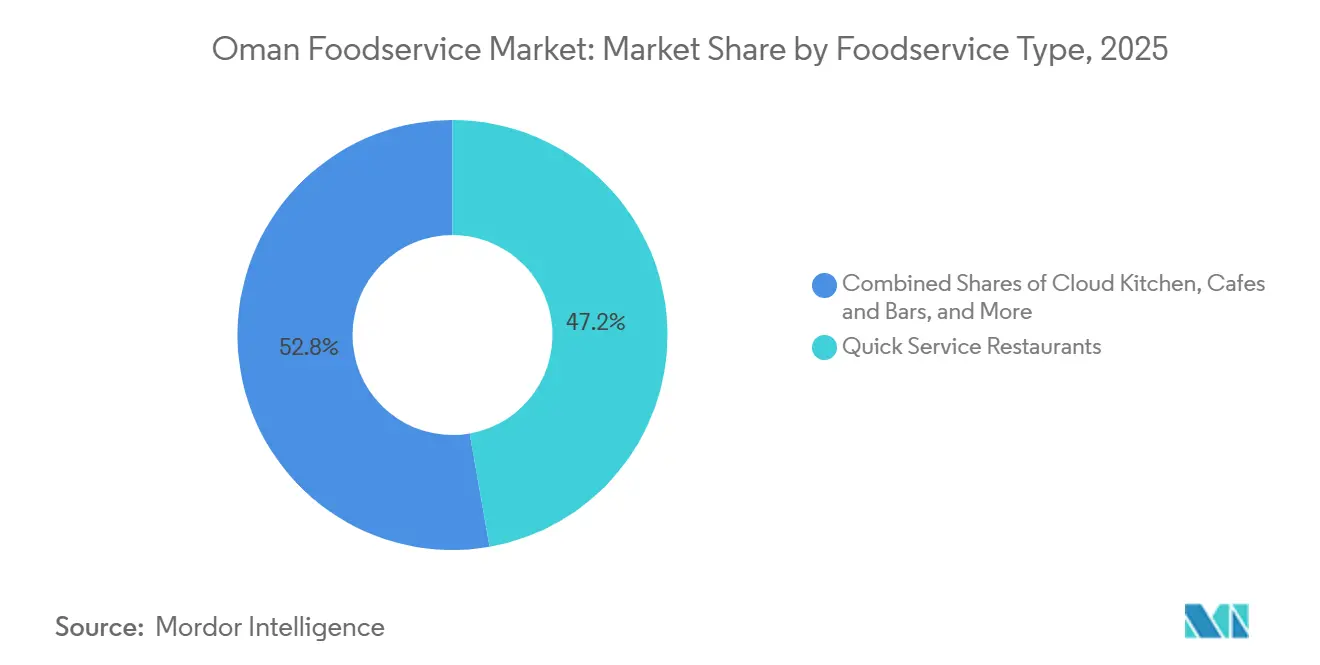
- By foodservice type, full-service restaurants led with 45.88% revenue share in 2025, whereas cloud kitchens are forecast to expand at a 16.1% CAGR through 2031.
- By outlet, independent operators held 56.62% of the Oman foodservice market share in 2025; chained outlets are advancing at an 8.28% CAGR to 2031.
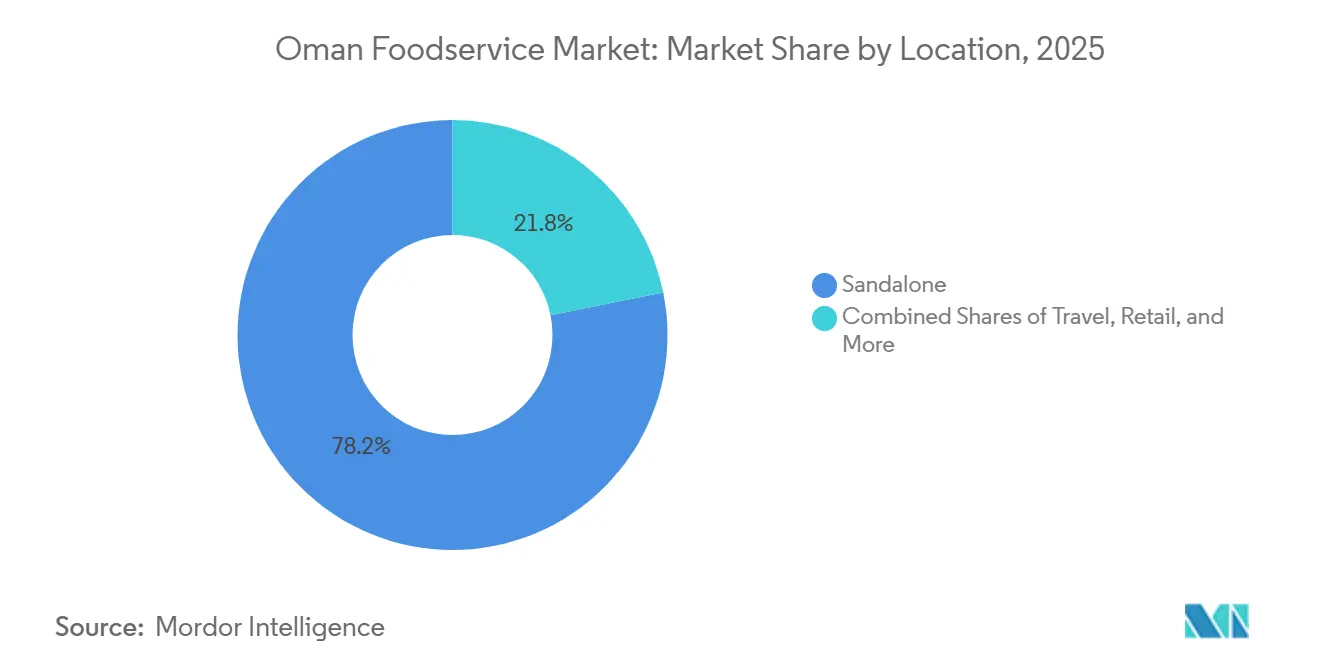
- By location, standalone venues accounted for 58.97% of the Oman foodservice market size in 2025, while travel-linked venues are growing at a 10.22% CAGR through 2031.
- By service type, dine-in commanded 67.35% of 2025 spend, yet delivery services are progressing at an 11.05% CAGR on the back of enforced e-payment adoption.
Note: Market size and forecast figures in this report are generated using Mordor Intelligence’s proprietary estimation framework, updated with the latest available data and insights as of 2026.
Oman Foodservice Market Trends and Insights
Drivers Impact Analysis*
| Drivers | (~)% Impact on CAGR Forecasts | Geographic Relevance | Impact Timeline |
|---|---|---|---|
| Expansion of Tourism Sector Through Government Hospitality Promotion | +1.8% | National, with early gains in Muscat, Salalah, and Nizwa | Medium term (2-4 years) |
| Growth in Disposable Incomes and Urban Development | +1.5% | National, concentrated in Muscat Capital Area and Sohar | Long term (≥ 4 years) |
| Heightened Health Awareness Driving Clean-Label Local Sourcing | +0.9% | National, led by Muscat and expatriate communities | Medium term (2-4 years) |
| Rise of Digital Platforms and Online Ordering Systems | +1.6% | National, with highest penetration in Muscat and Salalah | Short term (≤ 2 years) |
| Government Incentives, Tax Relief, and Food Security Initiatives | +1.2% | National, supporting SME operators and import-substitution projects | Long term (≥ 4 years) |
| Boom in Café Culture and QSR Appeal Among Youth | +1.4% | National, strongest in Muscat, Al Khuwair, and university districts | Short term (≤ 2 years) |
| Source: Mordor Intelligence | |||


Expansion of Tourism Sector Through Government Hospitality Promotion
As part of Vision 2040, the government is investing USD 31 billion in infrastructure, heritage sites, and hospitality training programs, emphasizing tourism's critical role in diversifying Oman's economy. This investment directly supports the foodservice sector. According to the World Travel & Tourism Council, Oman's tourism GDP contribution is expected to grow significantly, increasing from OMR 2.8 billion (USD 7.3 billion) in 2023 to OMR 5.4 billion (USD 14 billion) by 2034[1]Source: World Travel & Tourism Council, “Travel and Tourism GDP in Oman Set to Grow by Over USD 6 Billion in Next Decade,” wttc.org. This nearly twofold growth indicates a thriving tourism industry and ensures consistent demand for hotel F&B outlets, airport concessions, and leisure-district restaurants. Visitor arrivals, which reached 4 million in 2023, are projected to rise to 5.3 million in 2024. With a government target of 11 million visitors by 2040, this growth reflects a compound annual growth rate of approximately 6.3% over the next decade. Lodging-linked and travel-location outlets are experiencing disproportionate benefits, expanding at a faster 9.78% CAGR compared to the market average. To enhance per-guest spending, international hotel chains are upgrading F&B facilities and introducing branded concepts, such as celebrity-chef collaborations and rooftop lounges. This approach has proven effective, with occupancy rates exceeding 90% in Muscat's prime districts.
Growth in Disposable Incomes and Urban Development
Oman’s demographic profile, with a median age of 30.6 years and 73% of its population in the working-age group, positions the country as a prime market for discretionary dining. By 2024, urbanization reached 65%, concentrating purchasing power in key cities like Muscat, Sohar, and Salalah, according to the National Centre for Statistics and Information Oman[2]Source: National Centre for Statistics and Information, “Statistical Yearbook 2025,” ncsi.gov.om. The International Monetary Fund predicts real GDP growth of 2.6% in 2025, with a medium-term growth rate of 4%. Non-hydrocarbon sectors, such as retail and hospitality, are expected to grow annually at rates between 3.3% and 4.2%. Inflation in 2025 remained low at 0.8%, protecting real wage gains and enabling middle-income households to allocate more of their budgets to dining out. Urban development projects, including the Muscat Expressway, Duqm Special Economic Zone, and Sohar Port expansion, are attracting multinational corporations and expatriate professionals, who typically spend 15% to 20% more on food services than local residents. Lulu Group reported a 7.8% year-on-year revenue increase in Oman during Q1 2025, reflecting strong consumer confidence and the success of its strategy to incorporate quick-service kiosks and café corners into its 32 hypermarkets. This interplay of rising incomes and urbanization is also fueling demand for premium and experiential dining options, such as craft coffee bars, artisanal bakeries, and farm-to-table concepts, which generate higher average order values and encourage repeat visits.
Heightened Health Awareness Driving Clean-Label Local Sourcing
Expatriates and affluent consumers in Oman are increasingly seeking clean-label, minimally processed ingredients, driving shifts in menus and supply chains. To enhance domestic food production by 30% by 2040 and reduce import dependency, the Ministry of Agriculture, Fisheries, and Water Resources has initiated the Saham Agricultural City project with a USD 4.2 billion investment. This project allows local restaurants to source fresh produce, dairy, and poultry domestically. A'Saffa Foods is expanding its broiler production capacity from 48 million to 60 million birds annually, solidifying its role as a halal-certified, traceable protein supplier for both quick-service and full-service restaurants. The Silal Central Market, operational since 2024, consolidates over 80 municipal markets and slaughterhouses into a unified cold-chain network. This system reduces spoilage and ensures farm-to-fork traceability, appealing to health-conscious diners. In response, operators are highlighting ingredient origins on their menus—such as "Salalah-grown tomatoes," "Dhofar honey," and "Batinah Coast seafood." They are also partnering with local farms to create seasonal specialties. This strategy not only helps brands stand out in a competitive market but also supports premium pricing models.
Rise of Digital Platforms and Online Ordering Systems
Online food delivery market revenue reached USD 360 million in 2024 and is projected to hit USD 605 million by 2029, expanding at 10.96% CAGR and outpacing the overall market Statista. Talabat, owned by Delivery Hero, commands 74.8% of the aggregator market and has launched multiple dark kitchens in Muscat to reduce delivery times and commission drag for restaurant partners. Careem, Uber's regional subsidiary, operates a competing platform with commission structures typically ranging from 15% to 35%, creating competitive pressure that benefits consumers through discounts and loyalty programs. Kitopi, Sweetheart Kitchen, and iKcon have established regional footprints and are piloting virtual brands, single-cuisine concepts operating from shared facilities, that test new menu ideas with minimal risk. This digital-first model is particularly attractive to young entrepreneurs and international franchisors seeking rapid market entry without the overhead of traditional brick-and-mortar rollouts.
Restraints Impact Analysis*
| Restraints | (~) %Impact on CAGR Forecasts | Geographic Relevance | Impact Timeline |
|---|---|---|---|
| Heavy Dependence on Food Imports | -0.7% | National, affecting all operator segments | Long term (≥ 4 years) |
| Escalating Labor Costs and Skilled Hospitality Shortages | -0.8% | National, most acute in Muscat and Sohar | Medium term (2-4 years) |
| Food Price Fluctuations and Supply Chain Hurdles | -0.5% | National, with higher impact on full-service formats | Short term (≤ 2 years) |
| Surging Energy and Urban Rental Expenses | -0.6% | Muscat Capital Area, Sohar, and Salalah | Medium term (2-4 years) |
| Source: Mordor Intelligence | |||
Heavy Dependence on Food Imports
Oman's arid climate and limited arable land significantly limit domestic agricultural output, making the country dependent on imports for over 50% of its food consumption. This reliance exposes operators to risks such as currency fluctuations, geopolitical disruptions, and freight cost volatility. According to the Food and Agriculture Organization, smaller economies like Oman achieve dietary diversity primarily through imports. As a result, supply-chain disruptions, such as Red Sea shipping delays or export bans by major grain producers, can quickly drive up input costs. While the Saham Agricultural City project aims to increase domestic production by 30% by 2040, its timeline extends beyond the current forecast period, leaving operators vulnerable in the short term. Projects like the Duqm Food and Fishery Industrial Complex and Silal Central Market improve cold-chain efficiency and reduce spoilage, but fail to address the underlying dependency on imports. Operators with diversified supplier networks and long-term hedging contracts are better equipped to handle these shocks. However, smaller independents, which will account for 56.85% of outlets in 2025, often lack the scale and financial expertise to mitigate these risks, resulting in compressed margins during commodity price spikes.
Escalating Labor Costs and Skilled Hospitality Shortages
In 2023, the implementation of a new Labor Law and the planned launch of a Social Protection Fund in 2026 will increase employer contributions for both Omani and expatriate workers. These changes are expected to raise labor costs for full-service restaurants, reliant on front-of-house and kitchen staff, by approximately 8% to 12%. Expatriates account for 68% of the workforce and hold 86% of private-sector jobs, while Omani nationals earn nearly double the wages of their expatriate counterparts. This wage gap creates a two-tier cost structure, complicating workforce planning for businesses. The shortage of skilled professionals, such as chefs, sommeliers, and service managers, forces operators to recruit talent from countries like India, the Philippines, and Egypt. However, this approach involves high costs, including visa processing fees, relocation expenses, and training investments that can exceed USD 2,000 per hire. Additionally, the government's Omanization policy, which requires a specific percentage of Omani nationals in private-sector roles, adds compliance challenges and limits staffing flexibility. This is particularly problematic for businesses seeking specialized culinary expertise that is not readily available domestically. Labor-intensive full-service restaurants are the most affected, while quick-service restaurants (QSR) and cloud kitchens benefit from standardized processes, digital ordering kiosks, and centralized preparation, which reduce staffing needs and help mitigate wage inflation.
*Our forecasts treat driver/restraint impacts as directional, not additive. The impact forecasts reflect baseline growth, mix effects, and variable interactions.
Segment Analysis
By Foodservice Type: Cloud Kitchens Outpace Traditional Formats
In 2025, Quick Service Restaurants (QSRs) accounted for 47.23% of revenue, reflecting strong consumer demand for fast and affordable options like burgers, pizza, fried chicken, and bakery items. Cloud Kitchens are growing rapidly, with a 10.28% CAGR through 2031, driven by asset-light, delivery-focused models that avoid high street rents. Operators prioritize kitchen equipment, menu optimization, and digital marketing. Talabat's dark-kitchen partnerships and Kitopi's virtual-brand strategy—offering single-cuisine concepts from shared spaces- showcase how technology and logistics enable quick market entry without traditional overheads. Full-service restaurants, offering diverse global cuisines, attract diners seeking ambiance and table service but face margin pressures from rising labor costs and the 2023 Labor Law's Social Protection Fund, effective in 2026 under Oman's Ministry of Labor[3]Source: Ministry of Labor, “Royal Decree on Social Protection Fund,” mol.gov.om. Cafés and Bars, including coffee shops, juice bars, dessert parlors, and pubs, thrive in university areas and mixed-use developments, leveraging Instagram-friendly designs and limited-edition beverages to drive social media buzz and repeat visits.
In January 2025, Americana Restaurants acquired 46 Pizza Hut outlets from Khimji Ramdas, adding USD 11 million in annual revenue. This expanded Americana's Oman presence from 63 to 109 stores and increased its regional Pizza Hut network to about 450 locations. In January 2024, Areen Foods launched six F&B brands: Hen (chicken delivery), Oak (chocolate and coffee), Tender (steakhouse), Reveal (comfort food), Mash (burgers), and Diet Box (meal subscription). This multi-brand strategy uses shared infrastructure to target various dining occasions. Full-service operators are upgrading interiors, partnering with celebrity chefs, and adopting technology like tableside ordering tablets and contactless payments to improve efficiency and reduce labor reliance. However, they continue to face cost disadvantages compared to QSRs and cloud kitchens, posing medium-term challenges.


By Outlet: Chained Formats Gain Share Through Franchise Expansion
In 2025, independent outlets accounted for 56.85% of Oman's revenue, highlighting the fragmented market dominated by family-owned restaurants, cafés, and street-food vendors catering to local demand. Chained outlets, however, are growing at a 9.95% CAGR through 2031, driven by international franchisors leveraging Oman's low inflation (0.8% in 2025), government SME incentives, and rising consumer trust in standardized quality and hygiene. Alshaya operates brands like Starbucks, P.F. Chang's, and Shake Shack, while Apparel Group manages Costa Coffee, Burger King, and Subway. Both benefit from brand recognition, centralized procurement, and marketing scale, which independents struggle to match. Lulu Group's November 2024 IPO, raising USD 1.7 billion to USD 1.8 billion, is funding three new hypermarkets in Duqm, Musannah, and Samail, each featuring quick-service kiosks and café corners to capture impulse purchases and extend dwell time.
Chained operators also gain from digital integration, including loyalty apps, online ordering, and delivery aggregator partnerships, which independents often lack the resources to implement. Talabat's 74.8% market share in the aggregator segment creates a bottleneck favoring chains, which negotiate lower commission rates (15%-25%) compared to independents paying 25%-35%. The Ministry of Commerce, Industry, and Investment Promotion has expedited franchise licensing, reducing time-to-market from 12 months to 6 months for operators with proven systems and financial backing. While independents excel in menu flexibility, local sourcing, and personalized service, the shift toward chains is expected to continue as consumers prioritize convenience, consistency, and digital payment options.
By Locations: Lodging and Travel Hubs Capture Tourism Upside
In 2025, standalone locations, including high-street restaurants, neighborhood cafés, and suburban QSR outlets, contributed 78.16% of the revenue, serving residential and office catchments. Lodging-linked outlets are growing at a 9.78% CAGR through 2031, driven by Vision 2040's USD 31 billion tourism investment in hotel F&B renovations, airport concessions, and resort dining. The World Travel & Tourism Council projects Oman's tourism GDP will rise from OMR 2.8 billion (USD 7.3 billion) in 2023 to OMR 5.4 billion (USD 14 billion) by 2034, ensuring steady demand for hotel restaurants, rooftop lounges, and in-room dining. International hotel chains are upgrading F&B facilities and introducing branded concepts, such as celebrity-chef partnerships and craft cocktail bars, supported by occupancy rates exceeding 90% in Muscat's prime districts.
Travel hubs like airports, seaports, and highway rest stops benefit from captive audiences and premium pricing but face challenges such as 24-hour staffing, security protocols, and landlord commissions of 20%-30% of revenue. Retail locations in shopping malls and hypermarkets attract impulse traffic and longer dwell times. For example, Lulu Group's 32 hypermarkets integrate quick-service kiosks and café corners, increasing revenue per square meter. Leisure venues, including theme parks, museums, and heritage sites, remain underdeveloped compared to regional peers. However, Vision 2040's focus on cultural tourism and outdoor recreation is expected to drive investments in destination dining that combines local cuisine with storytelling. Standalone operators maintain flexibility in site selection, lease terms, and menu strategies, but the growth in lodging and travel hubs highlights a shift toward organized, tourism-focused foodservice with higher average checks and repeat visits.
By Service Type: Delivery Accelerates on Digital Aggregator Growth
In 2025, dine-in services generated 70.27% of total revenue, highlighting strong consumer preference for social dining, ambiance, and multi-course meals that home settings cannot replicate. Delivery services, however, are growing rapidly at an 11.02% CAGR through 2031, driven by Talabat's 74.8% aggregator market share, Careem's market entry, and the rise of cloud kitchens. Talabat has introduced dark kitchens in Muscat to cut delivery times below 30 minutes and reduce commission costs for restaurant partners. Careem's integration with Uber's logistics platform enables dynamic routing and real-time tracking, enhancing customer satisfaction.
Takeaway services appeal to consumers seeking quick meals without delivery fees but lack the growth drivers of delivery or the appeal of dine-in. Operators are adopting digital kiosks, mobile apps, and loyalty programs to streamline takeaway processes and enable targeted promotions. The 2023 Labor Law's Social Protection Fund mandates, effective 2026, will increase labor costs for dine-in formats reliant on waitstaff, creating a cost advantage for delivery and takeaway models that use kitchen staff and third-party couriers. Oman's median age of 30.6 years and 73% working-age population favor convenience, digital payments, and on-demand services, particularly for weekday lunches and late-night dining, over traditional sit-down options.
Geography Analysis
Oman's foodservice market is expanding in line with the country's urban growth and increased investments in tourism. The Muscat metropolitan area leads the market, driven by high disposable incomes, a significant international business presence, and government efforts to position the city as a regional hub for commerce and tourism. Strategically located at the intersection of Europe, Asia, and Africa, Oman offers foodservice operators opportunities to cater to diverse expatriate communities and international business travelers. Under the Vision 2040 initiative, the government has allocated OMR 3 billion for tourism development, focusing on regions such as Salalah for eco-tourism, Nizwa for cultural heritage, and coastal areas for cruise tourism. The expansion of the Sohar industrial zone has increased demand for institutional catering and quick-service options for workers, while Duqm's transformation into a logistics hub is creating new market opportunities for foodservice operators.
Consumer preferences and purchasing power differ across Oman's governorates, resulting in varied market dynamics. According to World Bank data from 2024, Oman's GDP is USD 106.94 billion. Urban areas like Muscat and Sohar exhibit a higher acceptance of international cuisines and premium pricing, while traditional regions favor authentic Omani and regional Arab dishes. Government agricultural initiatives, such as the 54,000-acre Al Najd Agricultural City project, enhance local sourcing opportunities, benefiting restaurants that prioritize farm-to-table concepts. Coastal regions leverage Oman's 158% self-sufficiency in fish production to support seafood-focused establishments, while interior regions capitalize on 97% self-sufficiency in date production and traditional cuisine. Improved transportation infrastructure, including road networks connecting remote areas to urban centers, is gradually extending the foodservice market's reach beyond traditional population hubs.
The geographic expansion of foodservice operations presents both opportunities and challenges shaped by government policies and infrastructure development. The Ministry of Commerce's restriction of 123 commercial activities, including mobile coffee shops and specialized food retail, to Omani nationals creates obstacles for foreign operators while protecting opportunities for local entrepreneurs. However, the Capital Market Incentives Program, which reduces corporate tax rates from 15% to 5-10% for qualifying investments, encourages expansion in designated development zones. The Oman Investment Authority's USD 500 million joint fund with Turkey's OYAK focuses on agriculture and food sectors, potentially accelerating foodservice infrastructure development in emerging regions. Energy costs are a critical factor for geographic expansion, as new commercial electricity tariffs of 25 baisa per kWh significantly impact operational economics, particularly for energy-intensive operations like large-scale kitchens and refrigeration systems.
Competitive Landscape
The Oman foodservice market showcases low fragmentation. This score indicates a competitive landscape where no single entity holds sway. Yet, established regional players leverage their scale and brand recognition for a competitive edge. The market's journey has seen a shift from traditional family-run venues to sophisticated franchises and chains. Concurrently, regulatory shifts are tilting the balance in favor of those operators who boast strong compliance and local partnerships. As the landscape evolves, new challenges arise: mandatory e-payment systems are phasing out cash-only businesses, and Omanization mandates are posing hurdles for firms reliant on expatriate leadership.
In this competitive arena, technology stands out as a pivotal differentiator. Operators who harness digital ordering, loyalty initiatives, and advanced supply chain systems are reaping the rewards of heightened efficiency and customer connection. Three dominant strategies are taking shape: established GCC players are eyeing regional growth, international franchises are making their mark, and local entrepreneurs are championing authentic Omani flavors. A case in point is LuLu Group, which not only inaugurated its 31st outlet in Oman but also saw a 70% surge in its e-commerce segment, underscoring the regional expansion trend.
Meanwhile, international players like M.H. Alshaya, with brands ranging from Starbucks to Shake Shack, are adeptly tapping into varied consumer demographics. On the other hand, homegrown brands like Hala, an Omani cloud kitchen, are making waves on the global stage. As the government pushes for food security, savvy operators are seizing the moment, blending local sourcing with modern delivery methods. This evolving landscape increasingly favors those who can adeptly maneuver through regulatory mazes while curating genuine experiences that appeal to both locals and global visitors.
Oman Foodservice Industry Leaders
Al Daud Restaurants LLC
Americana Restaurants International PLC
Jawad Business Group
Khimji Ramdas
LuLu Group International
- *Disclaimer: Major Players sorted in no particular order

Recent Industry Developments
- June 2025: Tanatan, a renowned modern Indian restaurant brand, opened a new restaurant in Oman. The restaurant offers various Indian cuisines and cocktails along with a live music experience.
- May 2025: The Lux Collective, in partnership with Adanté Realty, announced the official launch of SOCIO By The Lux Collective, the first hotel and branded residences development in Oman’s Sultan Haitham City.
- April 2025: Nobu Hospitality announced its expansion into Oman with the launch of the Nobu Hotel, Restaurant, and Residences Muscat, a major luxury mixed-use development located on Yiti Beach. The destination featured an 80-room Nobu Hotel, a signature Nobu Restaurant, a full-service spa and fitness center, multiple swimming pools, and a Nobu-style beach club, alongside a limited collection of branded residences.
- December 2024: Em Sherif made its debut in Oman with the opening of its flagship restaurant at The St. Regis Al Mouj Muscat Resort. The Muscat restaurant, led by Executive Head Chef Yasmina Hayek, offers a curated menu showcasing both traditional and contemporary dishes


Oman Foodservice Market Report Scope
Cafes & Bars, Cloud Kitchen, Full Service Restaurants, Quick Service Restaurants are covered as segments by Foodservice Type. Chained Outlets, Independent Outlets are covered as segments by Outlet. Leisure, Lodging, Retail, Standalone, Travel are covered as segments by Location.| Café and Bars | By Cuisine | Bars & Pubs |
| Café | ||
| Juice/Smoothie/Desserts Bars | ||
| Specialist Coffee & Tea Shops | ||
| Cloud Kitchen | ||
| Full Service Restaurants | By Cuisine | Asian |
| European | ||
| Latin American | ||
| Middle Eastern | ||
| North American | ||
| Other FSR Cuisines | ||
| Quick Service Restaurants | By Cuisine | Bakeries |
| Burger | ||
| Ice Cream | ||
| Meat-based Cuisines | ||
| Pizza | ||
| Other QSR Cuisines |
| Chained Outlets |
| Independent Outlets |
| Leisure |
| Lodging |
| Retail |
| Sandalone |
| Travel |
| Dine-in |
| Takeaway |
| Delivery |
| By Foodservice Type | Café and Bars | By Cuisine | Bars & Pubs |
| Café | |||
| Juice/Smoothie/Desserts Bars | |||
| Specialist Coffee & Tea Shops | |||
| Cloud Kitchen | |||
| Full Service Restaurants | By Cuisine | Asian | |
| European | |||
| Latin American | |||
| Middle Eastern | |||
| North American | |||
| Other FSR Cuisines | |||
| Quick Service Restaurants | By Cuisine | Bakeries | |
| Burger | |||
| Ice Cream | |||
| Meat-based Cuisines | |||
| Pizza | |||
| Other QSR Cuisines | |||
| By Outlet | Chained Outlets | ||
| Independent Outlets | |||
| By Locations | Leisure | ||
| Lodging | |||
| Retail | |||
| Sandalone | |||
| Travel | |||
| By Service Type | Dine-in | ||
| Takeaway | |||
| Delivery | |||


Market Definition
- FULL-SERVICE RESTAURANTS - A foodservice establishment where customers are seated at a table, give their order to a server and are served food at a table.
- QUICK SERVICE RESTAURANTS - A foodservice establishment that provides customers convenience, speed, and food offerings at lower prices. Customers usually help themselves and carry their own food to their tables.
- CAFES & BARS - A type of foodservice business that include bars and pubs that are licensed to serve alcoholic drinks for consumption, cafes that serve refreshments and light food items, as well as specialty tea and coffee shops, dessert bars, smoothie bars, and juice bars.
- CLOUD KITCHEN - A foodservice business that utilizes a commercial kitchen for the purpose of preparing food for delivery or takeout only, with no dine-in customers.
| Keyword | Definition |
|---|---|
| Albacore Tuna | It is one of the smallest species of tuna found in the six distinct stocks known globally in the Atlantic, Pacific, and Indian oceans, as well as the Mediterranean Sea. |
| Angus beef | It is beef derived from a specific breed of cattle indigenous to Scotland. It requires certification from the American Angus Association to receive the "Certified Angus Beef" quality mark. |
| Asian cuisine | It includes full-service offerings in restaurants that serve cuisines from cultures such as Chinese, Indian, Korean, Japanese, Bengali, Southeast Asian, etc. |
| Average Order Value | It is the average value of all orders made by the customers at a foodservice establishment. |
| Bacon | It is salted or smoked meat that comes from the back or sides of a pig. |
| Bars & Pubs | It is a drinking establishment that is licensed to serve alcoholic drinks for consumption on the premises. |
| Black Angus | It is beef derived from a black-hided breed of cows that don't have horns. |
| BRC | British Retail Consortium |
| Burger | It is a sandwich consisting of one or more cooked beef patties, placed inside a sliced bread roll or bun roll. |
| Café | It is a foodservice establishment serving various refreshments (mainly coffee) and light meals. |
| Cafes & Bars | It is a type of foodservice business that include bars and pubs that are licensed to serve alcoholic drinks for consumption, cafes that serve refreshments and light food items, as well as specialty tea and coffee shops, dessert bars, smoothie bars, and juice bars. |
| Cappuccino | It is an Italian coffee drink that is traditionally prepared with equal parts double espresso, steamed milk, and steamed milk foam. |
| CFIA | Canadian Food Inspection Agency |
| Chained Outlet | It refers to a foodservice establishment that shares brands, operates in several locations, has central management, and standardized business practices. |
| Chicken Tender | It refers to chicken meat prepared from the pectoralis minor muscles of a chicken bird. |
| Cloud Kitchen | It is a foodservice business that utilizes a commercial kitchen for the purpose of preparing food for delivery or takeout only, with no dine-in customers. |
| Cocktail | It is an alcoholic mixed drink made with either a single spirit or a combination of spirits, mixed with other ingredients such as juices, flavored syrups, tonic water, shrubs, and bitters. |
| Edamame | It is a Japanese dish prepared with soybeans (harvested before they ripen or harden) and cooked in its pod. |
| EFSA | European Food Safety Authority |
| ERS | Economic Research Service of the USDA |
| Espresso | It is a concentrated form of coffee, served in shots. |
| European cuisine | It includes full-service offerings in restaurants that serve cuisines from cultures such as Italian, French, German, English, Dutch, Danish, etc. |
| FDA | Food and Drug Administration |
| Fillet Mignon | It is a cut of meat taken from the smaller end of the tenderloin. |
| Flank Steak | It is a cut of beef steak taken from the flank, which lies forward of the rear quarter of a cow. |
| Foodservice | It refers to the part of the food industry which includes businesses, institutions, and companies which prepare meals outside the home. It includes restaurants, school and hospital cafeterias, catering operations, and many other formats. |
| Franks | Also known as frankfurter or Würstchen, it is a type of highly seasoned smoked sausage popular in Austria and Germany. |
| FSANZ | Food Standards Australia New Zealand |
| FSIS | Food Safety and Inspection Service |
| FSSAI | Food Safety and Standards Authority of India |
| Full service restaurant | It refers to a foodservice establishment where customers are seated at a table, give their order to a server, and are served food at a table. |
| Ghost Kitchen | It refers to a cloud kitchen. |
| GLA | Gross Leasable Area |
| Gluten | It is a family of proteins found in grains, including wheat, rye, spelt, and barley. |
| Grain-fed beef | It is beef derived from cattle that have been fed a diet supplemented with soy and corn and other additives. Grain-fed cows can also be given antibiotics and growth hormones to fatten them up more quickly. |
| Grass-fed beef | It is beef derived from cattle that have only been fed grass as feed. |
| Ham | It refers to the pork meat taken from the leg of a pig. |
| HoReCa | Hotels, Restaurants and Cafes |
| Independent Outlet | It refers to a foodservice establishment that operates with a single outlet or is structured as a small chain with no more than three locations. |
| Juice | It is a drink made from the extraction or pressing of the natural liquid contained in fruit and vegetables. |
| Latin American | It includes full-service offerings in restaurants that serve cuisines from cultures such as Mexican, Brazilian, Argentinian, Colombian, etc. |
| Latte | It is a milk-based coffee that is made up of one or two shots of espresso, steamed milk, and a thin layer of frothed milk. |
| Leisure | It refers to foodservice offered as a part of a recreation business, such as sports arenas, zoos, movie theaters, and museums. |
| Lodging | It refers to foodservice offerings at hotels, motels, guesthouses, holiday homes, etc. |
| Macchiato | It is an espresso coffee drink with a small amount of milk, usually foamed. |
| Meat-based cuisines | This inlcudes food items like fried chicken, steak, ribs, etc. where meat is the primary ingredient for the dish. |
| Middle Eastern cuisine | It includes full-service offerings in restaurants that serve cuisines from cultures such as Arabic, Lebanese, Iranian, Israeli, etc. |
| Mocktail | It is an non-alcoholic mixed drink. |
| Mortadella | It is a large Italian sausage or luncheon meat made of finely hashed or ground heat-cured pork, which incorporates at least 15% small cubes of pork fat. |
| North American | It includes full-service offerings in restaurants that serve cuisines from cultures such as American, Canadian, Caribbean, etc. |
| Pastrami | It refers to a highly seasoned smoked beef, typically served in thin slices. |
| PDO | Protected Designation of Origin: It is the name of a geographical region or specific area that is recognized by official rules to produce certain foods with special characteristics related to location. |
| Pepperoni | It is an American variety of spicy salami made from cured meat. |
| Pizza | It is a dish made typically of flattened bread dough spread with a savory mixture usually including tomatoes and cheese and often other toppings and baked. |
| Primal cuts | It refers to the major sections of the carcass. |
| Quick service restaurant | It refers to a foodservice establishment that provides customers convenience, speed, and food offerings at lower prices. Customers usually help themselves and carry their own food to their tables. |
| Retail | It refers to a foodservice outlet inside a mall. shopping complex or a commercial real estate building, where there are other businesses operating as well. |
| Salami | It is a cured sausage consisting of fermented and air-dried meat. |
| Saturated fat | It is a type of fat in which the fatty acid chains have all single bonds. It is generally considered unhealthy. |
| Sausage | It is a meat product made of finely chopped and seasoned meat, which may be fresh, smoked, or pickled and which is then usually stuffed into a casing. |
| Scallop | It is an edible shellfish that is a mollusk with a ribbed shell in two parts. |
| Seitan | It is a plant-based meat substitute made out of wheat gluten. |
| Self-service kiosk | It refers to a self-order point-of-sale (POS) system through which customers place and pay for their own orders at kiosks, enabling totally contactless and frictionless service. |
| Smoothie | It is a beverage made by placing all the ingredients in a container and processing them together, without removing the pulp. |
| Specialty coffee & tea shops | It refers to a foodservice establishment that serves only various types of tea or coffee. |
| Standalone | It refers to a restaurants that have an independent infrastructure setup and not connected to any other business. |
| Sushi | It is a Japanese dish of prepared vinegared rice, usually with some sugar and salt, accompanied by a variety of ingredients, such as seafood—often raw—and vegetables. |
| Travel | It refers to foodservice offerings such as airplane food, dining on long-distance trains, and foodservice on cruise ships. |
| Virtual Kitchen | It refers to a cloud kitchen. |
| Wagyu Beef | It is beef derived from any of four strains of a breed of black or red Japanese cattle that are valued for their highly marbled meat. |


Research Methodology
Mordor Intelligence follows a four-step methodology in all our reports.
- Step-1: Identify Key Variables: In order to build a robust forecasting methodology, the variables and factors identified in Step 1 are tested against available historical market numbers. Through an iterative process, the variables required for the market forecast are set, and the model is built on the basis of these variables.
- Step-2: Build a Market Model: Market size estimations for the forecast years are in nominal terms. Inflation is considered for average order value, and it is forecasted as per predicted inflation rates in the countries.
- Step-3: Validate and Finalize: In this important step, all market numbers, variables, and analyst calls are validated through an extensive network of primary research experts from the market studied. The respondents are selected across levels and functions to generate a holistic picture of the market studied.
- Step-4: Research Outputs: Syndicated Reports, Custom Consulting Assignments, Databases & Subscription Platforms


