Oleochemicals Market Size and Share
Market Overview
| Study Period | 2021 - 2031 |
|---|---|
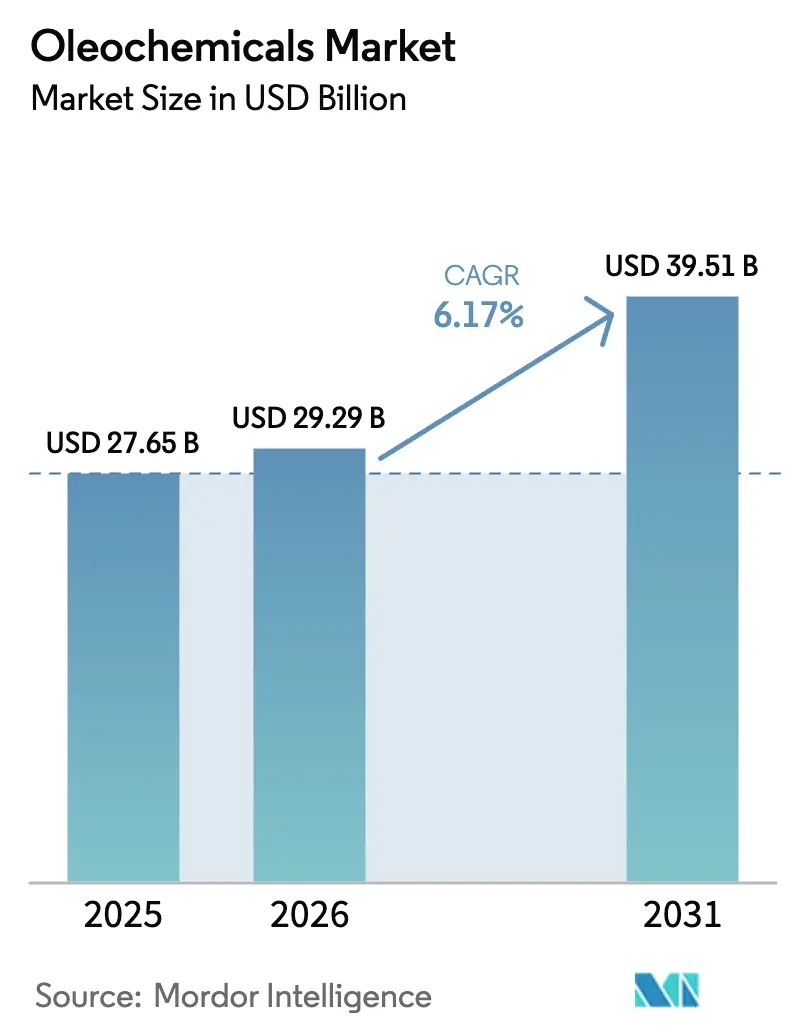
| Market Size (2026) | USD 29.29 Billion |
| Market Size (2031) | USD 39.51 Billion |
| Growth Rate (2026 - 2031) | 6.17% CAGR |
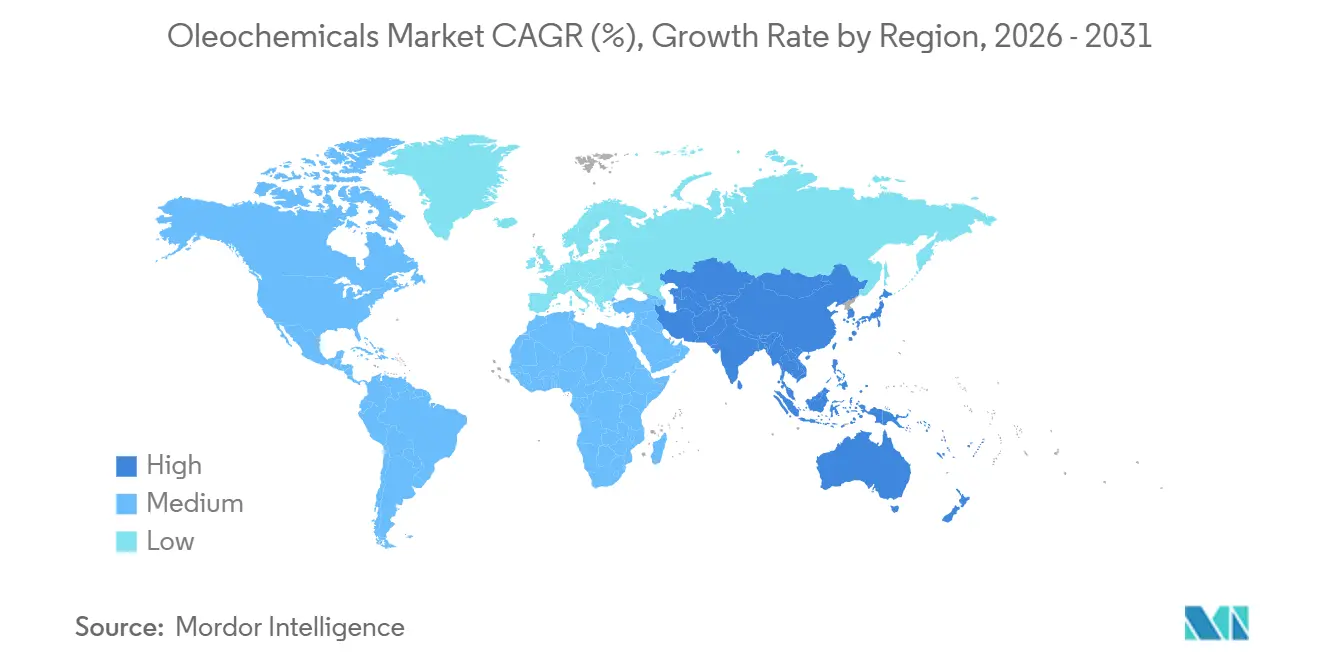
| Fastest Growing Market | Asia Pacific |
| Largest Market | Asia Pacific |
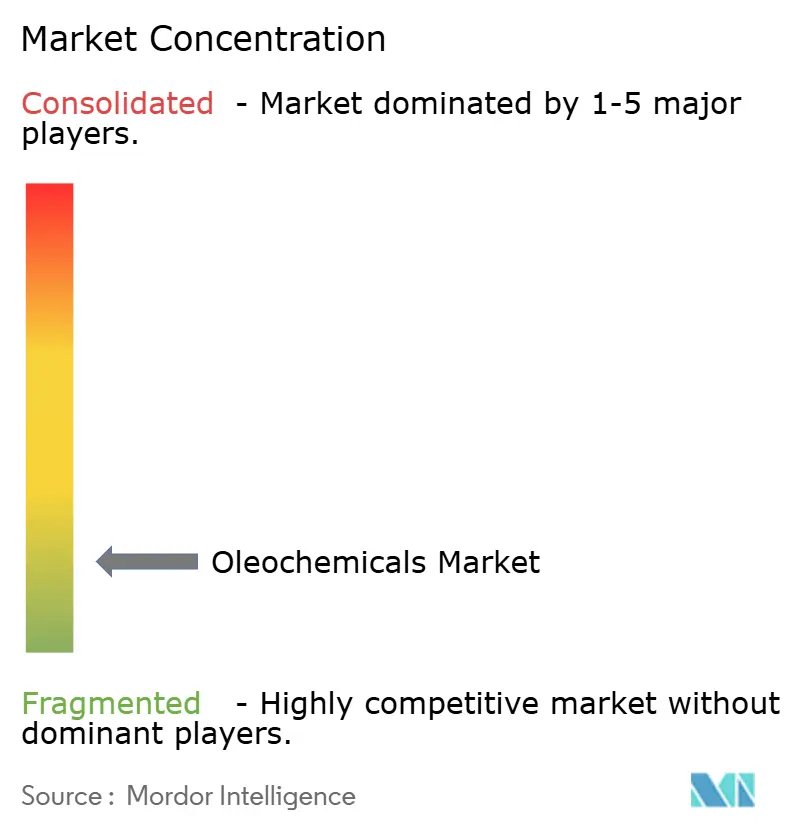
| Market Concentration | Low |
Major Players *Disclaimer: Major Players sorted in no particular order Image © Mordor Intelligence. Reuse requires attribution under CC BY 4.0. | |
Oleochemicals Market Analysis by Mordor Intelligence
The Oleochemicals Market size is projected to expand from USD 27.65 billion in 2025 and USD 29.29 billion in 2026 to USD 39.51 billion by 2031, registering a CAGR of 6.17% between 2026 to 2031. Demand is shifting toward bio-based intermediates as biodiesel blending rules broaden, brand-owner net-zero pledges accelerate, and extended producer-responsibility schemes tighten recycling targets. Feedstock economics continue to favor vertically integrated refiners that lock in palm, rapeseed, and tallow derived inputs at the source, while enzymatic routes lower both energy use and carbon intensity. Policy tailwinds in transportation fuels are cascading into methyl-ester capacity additions, and certification premiums for Roundtable on Sustainable Palm Oil (RSPO) grades have entrenched a two-tier pricing structure. Heightened scrutiny of deforestation is pushing Western buyers toward traceable, geolocated supply, further segmenting the oleochemicals market along sustainability lines.
Key Report Takeaways
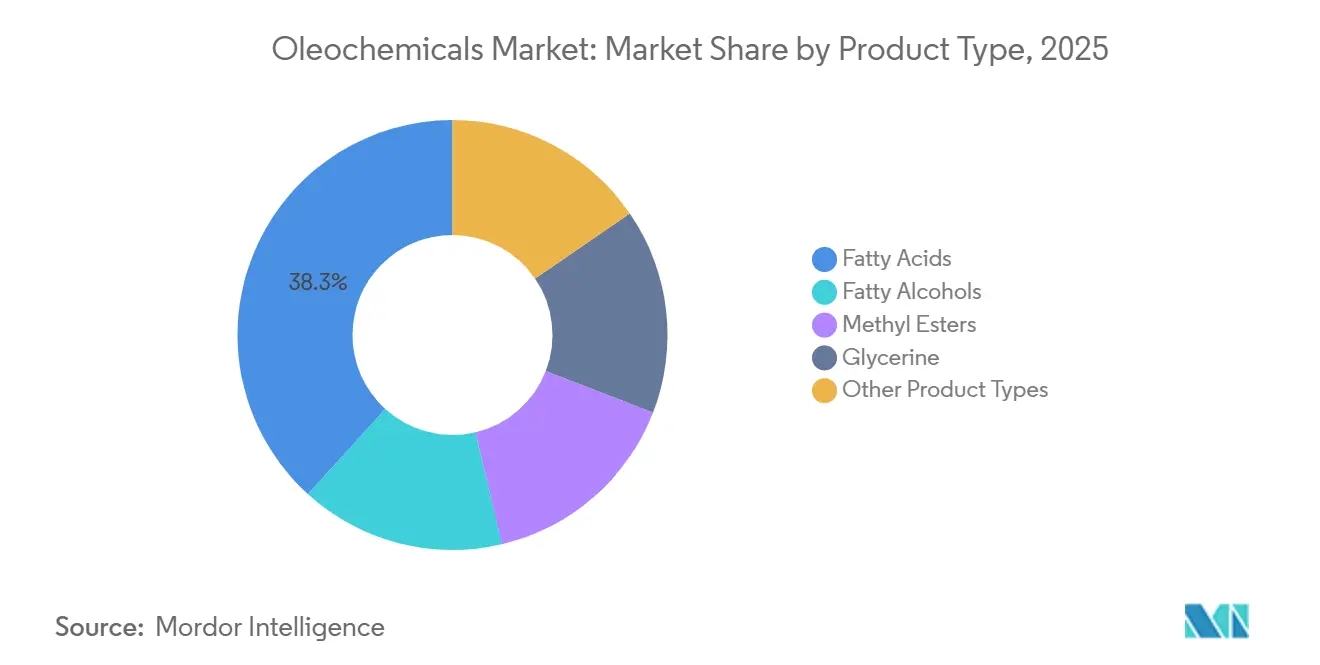
- By product type, fatty acids led with 38.26% of the oleochemicals market share in 2025, whereas methyl esters are forecast to grow the fastest at a 7.85% CAGR through 2031.
- By feedstock, vegetable oils held 64.61% of the oleochemicals market size in 2025 and are projected to expand at a 6.80% CAGR to 2031.
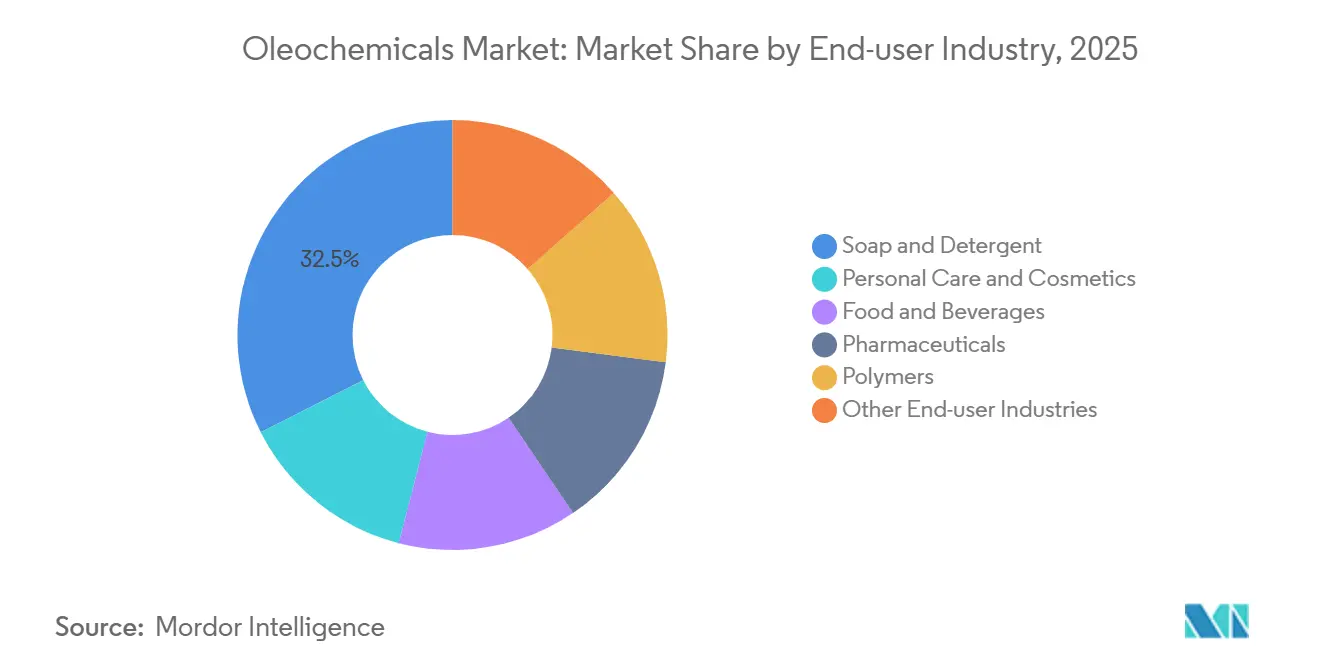
- By end-user industry, soap and detergents held 32.47% of the oleochemicals market size in 2025, while personal care and cosmetics are advancing at a 7.71% CAGR through 2031.
- By geography, Asia-Pacific held 47.59% of the oleochemicals market size in 2025; it is expected to rise at an 8.12% CAGR through 2031.
Note: Market size and forecast figures in this report are generated using Mordor Intelligence’s proprietary estimation framework, updated with the latest available data and insights as of 2026.
Global Oleochemicals Market Trends and Insights
Drivers Impact Analysis*
| Driver | (~) % Impact on CAGR Forecast | Geographic Relevance | Impact Timeline |
|---|---|---|---|
| Growing surfactants capacity in Asia-Pacific | +1.8% | APAC core, spill-over to Middle-East | Medium term (2-4 years) |
| Expanding personal-care and cosmetics demand | +1.5% | Global, led by APAC and North America | Long term (≥ 4 years) |
| Biodiesel mandates for fatty-acid methyl esters | +1.3% | Europe, Brazil, Indonesia | Short term (≤ 2 years) |
| Shift toward biodegradable, plant-based chemicals | +1.2% | North America and EU, regulatory spill-over to APAC | Medium term (2-4 years) |
| Urban waste-oil upcycling expands feedstock pool | +0.9% | Europe, China, urban centers in Southeast Asia | Short term (≤ 2 years) |
| Source: Mordor Intelligence | |||
Growing Surfactants Capacity in Asia-Pacific
China’s surfactant output touched 4.5 million t in 2024, replacing petrochemical alternatives with oleochemical linear alkylbenzene sulfonates and alcohol ethoxylates that cut dosing per wash by 30-40%. Rising urban incomes and e-commerce logistics distribute premium detergents deep into tier-3 cities, bolstering the oleochemicals market. India’s Bureau of Indian Standards (IS 13171) compels 60% biodegradability in 28 days, steering capacity additions by local majors toward fatty alcohols[1]Bureau of Indian Standards, “IS 13171 Detergent Standard,” bis.gov.in . Southeast Asian suppliers exploit proximity to palm-kernel and coconut oils to under-price Western peers by 10-15%, capturing Middle-Eastern and African detergent demand. Regional governments fast-track import duties on refined oils, spurring backward integration into glycerine and fatty-acid plants. The oleochemicals market thereby enjoys an Asia-centric production boom that redistributes global trade flows.
Expanding Personal-Care and Cosmetics Demand
The global beauty sector advanced to USD 262.8 billion in 2025, with clean-label claims pushing formulators toward oleochemical emollients such as cetyl and stearyl alcohols. Glycerine secured new roles as a propylene-glycol substitute in serums, aided by surplus output from biodiesel. South Korea exported USD 7.6 billion worth of cosmetics in 2024, embedding plant-sourced squalane to meet vegan certifications. Japan simplified renewable-ingredient approvals, truncating time-to-market for fatty-acid innovations. Kao’s 2024 low-irritation surfactant line demonstrated a 25% reduction in skin redness, reinforcing the shift toward mild, bio-based cleansers. These factors together elevate the oleochemicals market as the principal supply route for natural personal-care formulations.
Biodiesel Mandates for Fatty-Acid Methyl Esters
EU Renewable Energy Directive III lifts the advanced-biofuel quota to 5.5%, vaulting rapeseed-oil methyl esters to 6.4 million t in 2024, while palm-based volumes slid below 0.1 million t. Brazil’s B14 requirement soaked up 6.8 million t of soybean oil in 2024, inflating domestic feedstock costs by 12%. Indonesia’s B35 aims for 9.5 million t of palm-oil biodiesel, restricting export availability. The oleochemicals market therefore rides a policy-led substitution away from fossil inputs and toward methyl esters, yet faces margin squeeze when used-cooking-oil values spike under aviation-fuel mandates.
Shift Toward Biodegradable, Plant-Based Chemicals
EU Detergents Regulation requires 60% mineralization in 28 days, a bar that oleochemical surfactants clear naturally. The EU Ecolabel covered 18% of laundry-detergent sales in 2024, up from 12% in 2022, proving consumer readiness to pay 5-10% premiums for certified goods. U.S. retailers use scorecards to reward biodegradable products, nudging brands toward fatty-acid-based alkyl polyglucosides. Procter & Gamble raised renewable surfactant content to 45% in 2024 with a 70% target by 2030. Certification lags, however, as RSPO-certified palm-kernel oil grows only 4% annually, below demand, widening price spreads that complicate oleochemicals market planning.
Restraints Impact Analysis*
| Restraint | (~) % Impact on CAGR Forecast | Geographic Relevance | Impact Timeline |
|---|---|---|---|
| Feedstock price volatility | -1.1% | Global, acute in import-dependent regions | Short term (≤ 2 years) |
| NGO and regulatory pressure on unsustainable palm oil | -0.8% | Europe, North America, spill-over to Asia-Pacific | Medium term (2-4 years) |
| Synthetic-biology hydrocarbon surfactants competition | -0.5% | North America, Europe, pilot deployments in Asia | Long term (≥ 4 years) |
| Source: Mordor Intelligence | |||
Feedstock Price Volatility
Palm oil ranged between MYR 3,800-4,200 t in 2024, while soybean oil swung from USD 800-1,100 t on South-American droughts. Rapeseed oil hit EUR 1,100 t on tighter EU supply. Producers on 60-day contracts watched margin erosion as product prices lagged spot moves by up to 90 days. Futures hedges only partly cushioned shocks because basis risk widened to 8-12% amid port congestion in Southeast Asia, leaving the oleochemicals market exposed to earnings swings that deter project finance.
NGO and Regulatory Pressure on Unsustainable Palm Oil
EU Deforestation Regulation obliges geolocation data for each shipment after December 2024, a hurdle for smallholders lacking GPS and satellite tools. RSPO coverage reached only 19% of global production in 2024, below the 6-7% annual rise in certified-surfactant demand. Campaigns by Rainforest Action Network pressed major FMCGs to pledge 100% certified inputs by 2025, tightening supply even further. Prices for certified palm oil now sit 3-20% higher than conventional grades, embedding a structural premium into the oleochemicals market cost base.
*Our forecasts treat driver/restraint impacts as directional, not additive. The impact forecasts reflect baseline growth, mix effects, and variable interactions.
Segment Analysis
By Product Type: Methyl Esters Surge on Biofuel Policy
In 2025 fatty acids secured 38.26% of the oleochemicals market share, yet methyl esters are poised for a 7.85% CAGR through 2031 on tightening blend mandates. Rapeseed-methyl ester build-outs in Europe and soybean-based volumes in Brazil underpin this rise. Glycerine, an inevitable co-product, faces structural oversupply; spot values fell to USD 400-600 t in 2024, forcing integrated players to search for high-purity pharmaceutical outlets. Specialty esters and amines stay below 10% share because limited scale keeps unit costs elevated, but niche demand in agrochemicals offers selective upside.
A parallel rebalancing unfolds among fatty alcohols, where Sasol’s new 180 k t Louisiana unit reduces North-American dependence on Asian lauric supply. Enzymatic hydrogenation drops process energy by 15-20%, bolstering plant competitiveness. By 2031 mid-single-digit gains in detergent and personal-care use will consolidate fatty alcohols as the oleochemicals industry’s third-largest product slate. That momentum partially offsets glycerine headwinds and preserves overall segment margins within a 10-12% EBITDA corridor.


By Feedstock Source: Vegetable Oils Dominate Despite Sustainability Scrutiny
Vegetable oils underpinned 64.61% of oleochemicals market output in 2025 and will track a 6.80% CAGR to 2031, even as EU geolocation demands strain smallholder compliance. Palm oil keeps its unit-cost edge but RSPO premiums widen, nudging European producers toward rapeseed. The oleochemicals market size linked to animal fats is climbing because tallow trades 20-30% cheaper than palm; however, rendering capacity is regionally skewed—North America and Europe possess 75% of global throughput.
Urban waste-oil supplies, recognized as advanced feedstock in RED III, command EUR 800-1,000 t as aviation fuel programs compete. Coconut and palm-kernel oils, critical for lauric derivatives are supported by combined output in the Philippines and Indonesia. Nevertheless capacity expansions lag demand for certified grades, inserting supply-tightness into the oleochemicals industry’s lauric chain.
By End-user Industry: Personal Care Outpaces Traditional Detergents
Soap and detergents retained 32.47% revenue in 2025, yet the personal-care channel will expand at 7.71% CAGR through 2031. Brand commitments to 50-70% natural content make fatty-alcohol-based alkyl polyglucosides the surfactant of choice for premium toiletries. Rising Asian middle-class income lifts per-capita spend on shampoos and serums, intensifying oleochemical pull-through.
Food-grade emulsifiers grow moderately as bakery and dairy brands retire synthetic additives. Pharmaceutical uptake for USP-grade glycerine and medium-chain triglycerides is rising due to injectable-drug formats. Polyurethane makers adopt bio-polyols to trim vehicle carbon footprints 20-30% by 2030. Collectively, these shifts diversify the oleochemicals market, cushioning it from detergent maturity in Western economies.
Geography Analysis
Asia-Pacific represented 47.59% of global sales in 2025 and will power ahead at an 8.12% CAGR. China installed 4.5 million t surfactant capacity in 2024, leaning on oleochemical LAS and alcohol ethoxylates that meet biodegradability codes from the Ministry of Ecology and Environment[2]Ministry of Ecology and Environment China, “Detergent Environmental Standards,” mee.gov.cn . India’s IS 13171 compels 60% biodegradability, catalyzing expansions by Godrej and local peers. Proximity to palm-kernel supply lets Southeast Asian players under-cut Western pricing by 10-15%, unlocking Middle-East and Africa export lanes. Japan and South Korea chase high-purity fatty acid niches for K-beauty exports, adding further pull on certified lauric intermediates.
In North America detergent volumes plateau. U.S. soybean-oil diversion into B-based diesel tightens feedstock, yet Sasol’s 180 k t fatty-alcohol unit in Louisiana tempers import reliance. Canadian output focuses on canola-derived biodiesel, whereas Mexico's detergent growth on household formation. The EPA Safer Choice label propels reformulations toward biodegradable surfactants, supporting regional oleochemicals market resilience.
Europe is expanding annually under stringent sustainability rules. Palm-to-rapeseed substitution deepens as EU Deforestation Regulation activates, while used-cooking-oil uptake scales under RED III quotas. KLK’s new 100 k t German unit supplies RSPO-certified fatty alcohols to regional brands at a 3-20% price premium. Northern Europe boasts high waste-oil capture, but the south lags, leaving untapped feedstock that could bolster the oleochemicals market if collection logistics improve.
South America demand is driven by Brazil’s B14 mandate that absorbed 6.8 million t soybean oil. Argentina’s crushing surplus directs feedstock to both export and domestic oleochemicals. Bio-polyol pilots in Brazil point to automotive foam use, widening local value-add. The Middle-East and Africa demand is climbing as detergent penetration deepens. Saudi Arabia’s planned USD 500 million Jubail complex will anchor regional supply by 2028, while South Africa scales tallow-based soaps.

Competitive Landscape
Global capacity remains low concentrated; the top five players account for roughly 17% output. Wilmar, IOI, and Musim Mas integrate plantation through fractionation, sheltering gross margins from feedstock whipsaws. Wilmar’s USD 150 million Indonesian expansion adds 120 k t fatty acids and 40 k t glycerine to pursue food-emulsifier and polymer-polyol demand turing European premiums. Emery and BASF’s Malaysian JV channels USD 50 million into bio-polyols, eyeing automotive clients chasing 30% lighter foams.
Specialty incumbents (BASF, Croda, Evonik) license enzymatic or fermentation technology to convert low-grade tallow into pharma-grade stearic acid, commanding 20-30% premiums. Technology disruptors Genomatica and LanzaTech narrow the cost gap on fermentation-derived surfactants, supported by 18% rise in biosurfactant patent filings during 2024. Certification capacity grows only 4% yearly, under the 6-7% certified-product demand climb, sustaining two-tier pricing. The oleochemicals market therefore balances scale economics of integrated agribusinesses against agility of biotech entrants.
Oleochemicals Industry Leaders
IOI Oleochemical
KLK OLEO
BASF
Wilmar International Ltd
Musim Mas Group
- *Disclaimer: Major Players sorted in no particular order

Recent Industry Developments
- March 2025: The Indonesian government implemented the B40 biodiesel mandate, which substantially increased domestic feedstock demand. This reduced global availability for other oleochemical derivatives.
- January 2024: Godrej Industries Group announced an INR 600 crore (USD 69.43 million) investment plan over four years to expand its Valia facility in Bharuch, Gujarat. The facility produced oleochemical products derived from organic materials, serving industries such as personal care, pharmaceuticals, and food.


Global Oleochemicals Market Report Scope
Oleochemicals are chemical compounds derived from natural oils and fats, typically obtained from vegetable sources such as palm, soybean, and coconut, or animal sources like tallow and lard. These chemicals undergo various processes such as hydrolysis, transesterification, or hydrogenation to produce a wide range of products, including fatty acids, glycerin, fatty alcohols, esters, and other derivatives.
The oleochemicals market is segmented by product type, feedstock source, end-user industry, and geography. By product type, the market is segmented into fatty acids, fatty alcohols, methyl esters, glycerine, and other product types. By feedstock source, the market is segmented into vegetable oils and animal fats. By end-user industry, the market is segmented into soap and detergent, personal care and cosmetics, food and beverages, pharmaceuticals, polymers, and other end-user industries. The report also covers the market size and forecasts for the oleochemicals in 15 countries across major regions. For each segment, the market sizing and forecasts have been done on the basis of value (USD).
| Fatty Acids |
| Fatty Alcohols |
| Methyl Esters |
| Glycerine |
| Other Product Types |
| Vegetable Oils |
| Animal Fats |
| Soap and Detergent |
| Personal Care and Cosmetics |
| Food and Beverages |
| Pharmaceuticals |
| Polymers |
| Other End-user Industries |
| Asia-Pacific | China |
| India | |
| Japan | |
| South Korea | |
| ASEAN Countries | |
| Rest of Asia-Pacific | |
| North America | United States |
| Canada | |
| Mexico | |
| Europe | Germany |
| United Kingdom | |
| France | |
| Italy | |
| Rest of Europe | |
| South America | Brazil |
| Argentina | |
| Rest of South America | |
| Middle-East and Africa | Saudi Arabia |
| South Africa | |
| Rest of Middle-East and Africa |
| Product Type | Fatty Acids | |
| Fatty Alcohols | ||
| Methyl Esters | ||
| Glycerine | ||
| Other Product Types | ||
| Feedstock Source | Vegetable Oils | |
| Animal Fats | ||
| End-user Industry | Soap and Detergent | |
| Personal Care and Cosmetics | ||
| Food and Beverages | ||
| Pharmaceuticals | ||
| Polymers | ||
| Other End-user Industries | ||
| Geography | Asia-Pacific | China |
| India | ||
| Japan | ||
| South Korea | ||
| ASEAN Countries | ||
| Rest of Asia-Pacific | ||
| North America | United States | |
| Canada | ||
| Mexico | ||
| Europe | Germany | |
| United Kingdom | ||
| France | ||
| Italy | ||
| Rest of Europe | ||
| South America | Brazil | |
| Argentina | ||
| Rest of South America | ||
| Middle-East and Africa | Saudi Arabia | |
| South Africa | ||
| Rest of Middle-East and Africa | ||


Key Questions Answered in the Report
What is the size of the oleochemicals market?
The oleochemicals market stands at USD 29.29 billion in 2026 and is forecast to reach USD 39.51 billion, rising at a 6.17% CAGR from 2026-2031.
Which product category is growing the fastest?
Methyl esters, boosted by global biodiesel mandates, are expected to post a 7.85% CAGR through 2031.
Why is Asia-Pacific the leading revenue contributor?
Strong surfactant capacity in China and India plus feedstock proximity lift the region to a 47.59% share and an 8.12% CAGR.
How are sustainability regulations shaping feedstock choices?
EU deforestation rules and RSPO premiums drive a shift from uncertified palm oil to traceable rapeseed, soybean, and waste-oil sources.
Page last updated on:


