
OLED Microdisplay Market Size and Share
Market Overview
| Study Period | 2020 - 2031 |
|---|---|
| Market Size (2026) | USD 1.76 Billion |
| Market Size (2031) | USD 8.85 Billion |
| Growth Rate (2026 - 2031) | 38.23 % |
| Fastest Growing Market | Middle East and Africa |
| Largest Market | Asia Pacific |
| Market Concentration | Medium |
Major Players
*Disclaimer: Major Players sorted in no particular order Image © Mordor Intelligence. Reuse requires attribution under CC BY 4.0. |
|
OLED Microdisplay Market Analysis by Mordor Intelligence
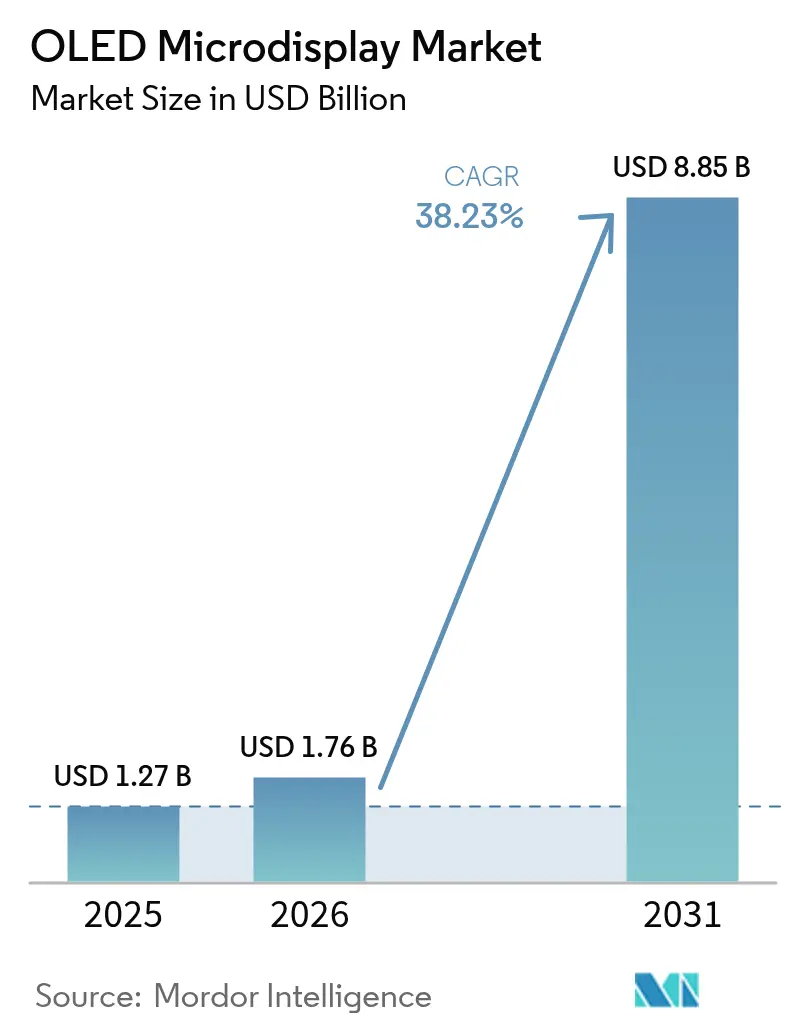
oled microdisplay market size in 2026 is estimated at USD 1.76 billion, growing from 2025 value of USD 1.27 billion with 2031 projections showing USD 8.85 billion, growing at 38.23% CAGR over 2026-2031. Robust demand for compact, high-resolution near-eye panels in augmented and virtual reality headsets, military helmet systems and premium automotive head-up displays is accelerating volume growth. Direct patterning and tandem-stack architectures are lifting brightness ceilings toward 60,000 nits while cutting power draw, strengthening the technology’s position against emerging MicroLED. Parallel capacity expansions at Chinese OLED-on-Silicon foundries are lowering unit costs and shortening lead times, which encourages broader consumer-electronics adoption. Strategic acquisitions—most notably Samsung Display’s 2024 purchase of eMagin—are pushing advanced process know-how into high-volume manufacturing lines, widening the performance gap with late-entry competitors
Key Report Takeaways
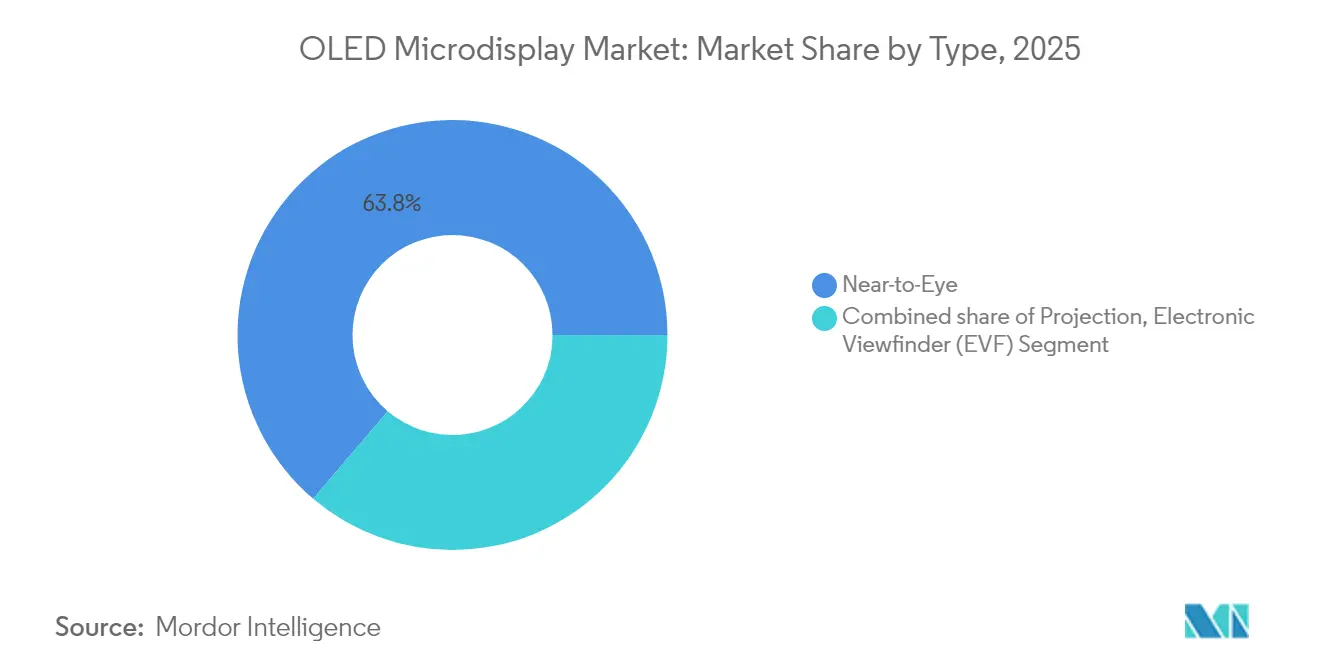
- By type, Near-to-Eye devices held 63.78% of oled microdisplay market share in 2025, while Electronic Viewfinders are projected to expand at a 40.15% CAGR through 2031.
- By technology, RGB OLED-on-Silicon led with 54.62% revenue share in 2025; the White OLED + Color Filter route is forecast to grow at 41.85% CAGR to 2031.
- By resolution, the HD (720p) tier accounted for 35.42% of the oled microdisplay market size in 2025; Above FHD (2K–4K+) is the fastest-growing tier at 40.7% CAGR.
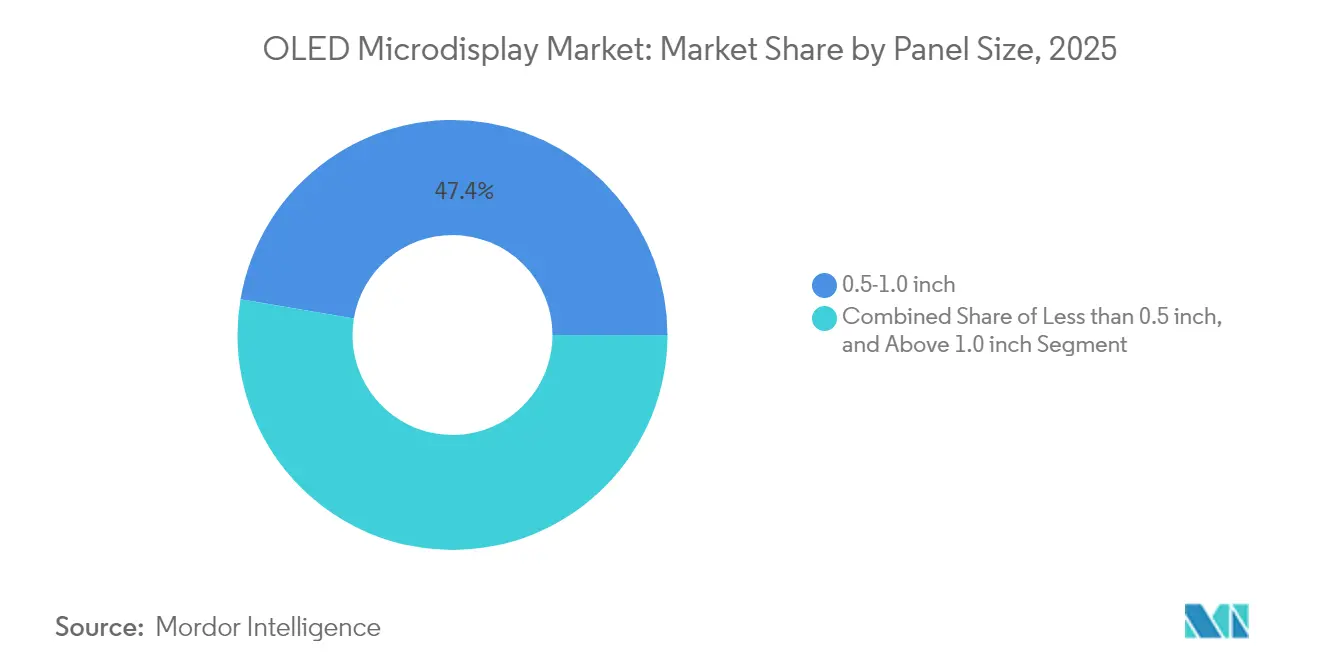
- By panel size, 0.5-1.0 inch modules commanded 47.35% share of the oled microdisplay market size in 2025, while sub-0.5 inch units are advancing at 38.05% CAGR.
- By end-user, Consumer Electronics generated 50.46% revenue in 2025; Automotive applications are set to rise at 39.7% CAGR between 2026-2031.
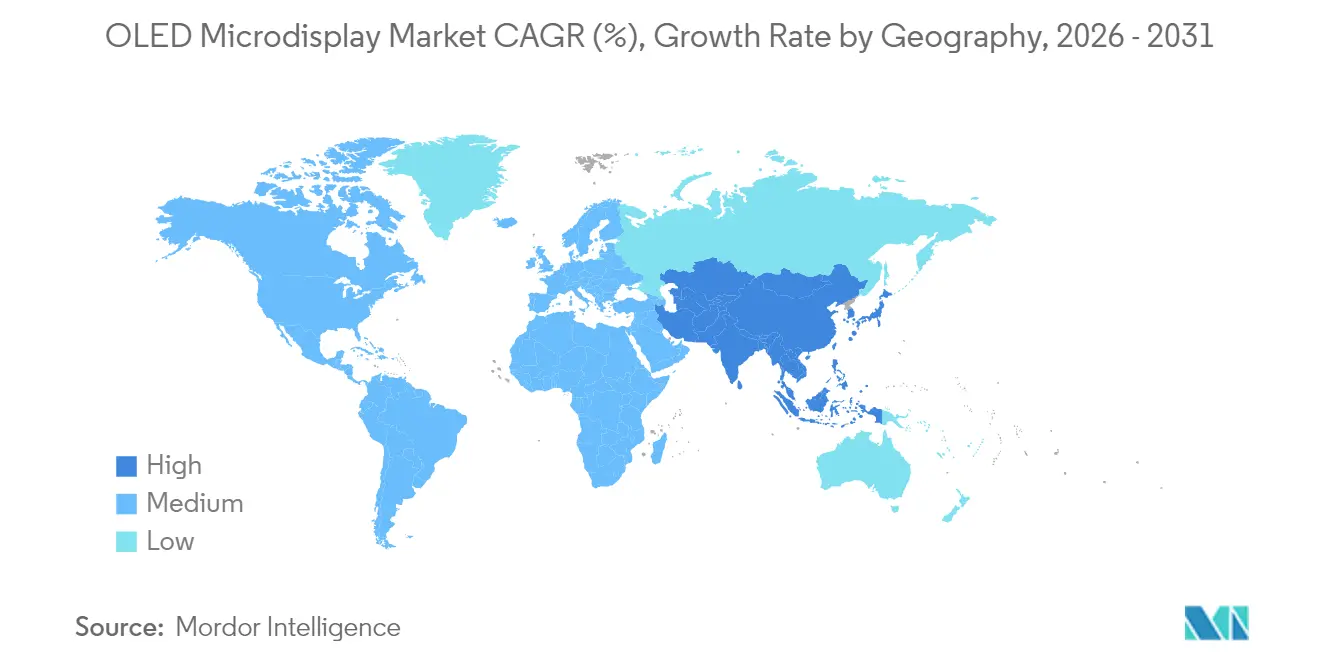
- By geography, Asia Pacific dominated with 56.64% share in 2025; the Middle East & Africa region is projected to grow at 40.6% CAGR through 2031.
Note: Market size and forecast figures in this report are generated using Mordor Intelligence’s proprietary estimation framework, updated with the latest available data and insights as of 2026.
Market Trends and Insights
Drivers Impact Analysis of OLED Microdisplay Market*
| Driver | (~) % Impact on CAGR Forecast | Geographic Relevance | Impact Timeline |
|---|---|---|---|
| Expansion of OLED-on-Silicon (OLEDoS) Capacity by Chinese Foundries | +8.5% | Asia Pacific, with spillover to North America | Medium term (2-4 years) |
| Accelerated Adoption of MicroOLED in Military Helmet-Mounted Displays across North America | +6.2% | North America | Short term (≤ 2 years) |
| Automotive OEM Integration of AR Head-Up Displays Using MicroOLED Panels in Europe | +7.8% | Europe, with spillover to North America | Medium term (2-4 years) |
| Surge in High-End Mirrorless Camera EVFs in Japan & South Korea | +5.4% | Asia Pacific | Short term (≤ 2 years) |
| Growing VC Funding for AR/VR Start-ups Focused on OLED Microdisplays in the US & Israel | +4.3% | North America, Middle East | Medium term (2-4 years) |
| Cost-Performance Advantage over MicroLED in <0.7-inch, >3,000 ppi Range | +3.2% | Global | Long term (≥ 4 years) |
| Source: Mordor Intelligence | |||


Expansion of OLED-on-Silicon Capacity by Chinese Foundries
Production ramp-ups at BOE, SeeYA and IRay Group are injecting high-volume, high-yield supply into the oled microdisplay market. Foundries are pairing pixel-dense front-planes with newly built silicon backplane lines to raise throughput and tighten process control. IRay’s dedicated backplane investment illustrates a vertical-integration push that reduces outsourcing steps, enhancing cost competitiveness.[1]Ray Group, “IRay Group To Invest In OLED Microdisplay Backplane Production Project,” iraygroup.comThese moves reposition Asia Pacific from a regional to a global supply anchor, challenging Japanese and Korean incumbents on both scale and technology leadership. Wider capacity also stabilizes pricing, encouraging consumer device OEMs to commit to long-term oled microdisplay market orders.
Accelerated Adoption in Military Helmet-Mounted Displays
North American defense programs are rapidly shifting from AMLCD to OLED microdisplays for pilot, ground-troop and night-vision optics. Kopin’s USD 7.5 million award in April 2025 underscores rising demand for ruggedized near-eye modules with superior contrast, zero-motion blur and reduced weight.[2]Kopin Corporation, “Kopin Secures USD 7.5 Million Contract for Helmet Mounted Display Systems Supporting Aircraft Pilots,” Kopin, kopin.comValidation within the F-35 platform demonstrates mission-critical reliability, prompting other programs to specify similar display architectures. Diversification into weapon sights and command-control eyewear spreads procurement risk, making military demand a stable cornerstone of the oled microdisplay market.
Automotive OEM Integration of AR Head-Up Displays
Premium European brands are embedding MicroOLED panels in wide-field head-up systems that overlay navigation and hazard alerts directly on the windshield. Projects such as DashAR show how lightweight near-eye optics can be paired with in-vehicle diagnostics to personalize driver information. Concurrent academic work on pixel-level audio generation suggests a forthcoming fusion of visual and directional sound cues within the same panel substrate. These design advances lift functional value and justify higher panel ASPs, supporting robust growth for the oled microdisplay market in automotive interiors.
Surge in High-End Mirrorless Camera EVFs
Professional photography houses in Japan and South Korea are migrating flagship mirrorless bodies from optical prisms to OLED electronic viewfinders. Real-time exposure simulation, focus peaking and HDR previews demand microdisplays with high color accuracy and fast response. Sony’s imaging group leverages its semiconductor division to co-optimize sensors and oled microdisplay panels, compressing time-to-market for feature upgrades. Rising unit volumes from camera lines offer a secondary demand pillar that balances cyclical swings in AR/VR headset shipments.
Restraints Impact Analysis of OLED Microdisplay Market*
| Restraint | (~) % Impact on CAGR Forecast | Geographic Relevance | Impact Timeline |
|---|---|---|---|
| Moisture-Ingress Encapsulation Challenges for OLEDoS | -3.2% | Global | Medium term (2-4 years) |
| Sub-1,000 cd/m² Brightness Ceiling versus MicroLED | -2.8% | Global | Short term (≤ 2 years) |
| Supply-Chain Concentration in Japan–China Creating Geopolitical Risk | -1.9% | Asia Pacific, North America | Medium term (2-4 years) |
| Rapid Product Obsolescence Increasing OEM Inventory Risk | -1.6% | Global | Long term (≥ 4 years) |
| Source: Mordor Intelligence | |||
Moisture-Ingress Encapsulation Challenges for OLEDoS
The persistent challenge of moisture ingress represents a significant technical barrier to widespread OLED microdisplay adoption, particularly in harsh operating environments like automotive and military applications. Unlike conventional displays, the ultra-compact form factor of microdisplays leaves minimal space for traditional encapsulation methods, creating a fundamental engineering challenge that impacts both manufacturing yield and long-term reliability. Recent innovations from Korean universities have introduced multi-functional encapsulation for fiber-based wearable OLEDs, potentially offering pathways to more robust solutions. The technical complexity of this challenge is compounded by the need for encapsulation solutions that maintain optical clarity while providing hermetic sealing—a balance that becomes increasingly difficult as pixel densities exceed 3,000 ppi. This constraint particularly impacts applications where extended operational lifetimes are expected, such as automotive displays with 10+ year service requirements, creating a competitive opportunity for companies that can develop proprietary encapsulation technologies.
Sub-1,000 cd/m² Brightness Ceiling versus MicroLED
The brightness limitations of OLED microdisplays compared to emerging MicroLED alternatives represent a critical competitive vulnerability, particularly for outdoor augmented reality applications where ambient light can overwhelm displays with insufficient luminance. This technical constraint has created a segmentation in the market, with OLED dominating indoor and controlled-lighting applications while struggling to penetrate high-brightness use cases. The competitive dynamics are evolving rapidly, however, as demonstrated by INT-Tech's breakthrough RGB OLED microdisplay achieving 60,000 nits brightness-a five-fold increase from previous generations. This advancement directly challenges the primary advantage of MicroLED technology, potentially redefining competitive boundaries between the two technologies. The brightness race has significant implications for power consumption and thermal management, with each brightness increase typically requiring disproportionate power increases unless offset by efficiency improvements. This creates a complex optimization challenge for device manufacturers, who must balance brightness requirements against battery life and thermal constraints in wearable form factors.
*Our forecasts treat driver/restraint impacts as directional, not additive. The impact forecasts reflect baseline growth, mix effects, and variable interactions.
OLED Microdisplay Market Segment Analysis
By Type:
Near-to-Eye Dominates While EVFs AccelerateThe oled microdisplay market size for Near-to-Eye devices stood at USD 0.81 billion in 2025, equal to 63.78% of total revenue. Sustained shipments to mixed-reality headsets, training goggles and smart helmets anchor demand. Ecosystem investment from platform owners supports annual resolution and brightness upgrades, which in turn lift average selling prices and gross margins.
Electronic Viewfinders contributed a smaller base in 2025, yet their 40.15% CAGR prospect through 2031 signals ample headroom. Professional mirrorless bodies from Sony, Nikon and Canon are standardizing OLED EVFs to deliver lag-free framing and HDR previews. As camera makers streamline model cycles, panel volumes could double within three years, establishing EVFs as a strategic hedge within the oled microdisplay market.


By Resolution:
Above FHD Segment Drives Premium ApplicationsThe HD 720p tier held 35.42% of oled microdisplay market share in 2025, balancing acceptable clarity with tight power budgets for mainstream AR viewers. Growth momentum, however, lies in the Above-FHD tier where pixel densities exceed 3,000 ppi. Early 2025 samples from Samsung Display achieve 5,000 ppi and 20,000 nits peak luminance, positioning these panels for enterprise VR and military recon goggles.
A 40.7% CAGR forecast to 2031 for Above-FHD shipments will absorb much of the incremental oled microdisplay market size expansion. Higher bandwidth interfaces and low-latency drivers accompany these panels, creating ancillary silicon demand that benefits integrated suppliers.
By Technology:
RGB OLED-on-Silicon Leads Market TransformationRGB OLED-on-Silicon technology generated 54.62% revenue in 2025, reinforced by direct-patterning processes that eliminate color-filter losses and elevate brightness. Samsung’s acquisition of eMagin secures core intellectual property in this field, allowing rapid scale-up.
White OLED with color filter remains cost-efficient for wearables that prioritize size over peak luminance and is projected to outpace the broader oled microdisplay market at 41.85% CAGR. Tandem-stack research is unlocking current efficiencies above 20 cd/A, narrowing performance gaps with RGB emitters while simplifying mass production.
By Panel Size:
Sub-0.5 Inch Segment Accelerates MiniaturizationThe 0.5-1.0 inch bracket accounted for 47.35% of 2025 shipments and continues to suit AR spectacles and camera EVFs. Design engineers value the balance between eye-box comfort and industrial-design freedom.
Sub-0.5 inch formats are poised for 38.05% CAGR through 2031 as manufacturers push toward socially acceptable smart-glasses that resemble conventional eyewear. The oled microdisplay market size in this bracket could surpass USD 2.14 billion by 2031 if recent power-efficiency gains from Lumicore flow into high-volume lines.
By End-User:
Consumer Electronics Leads While Automotive AcceleratesConsumer Electronics maintained 50.46% share in 2025 on the back of AR/VR headsets and digital imaging devices. These volumes cement baseline fab utilization, permitting aggressive cost optimization.
Automotive integrators are now the fastest-growing customers, with a 39.7% CAGR outlook linked to widescreen augmented head-up displays in electric and premium vehicles. As European OEMs finalize display specifications, multi-year sourcing agreements will create predictable pull for oled microdisplay market suppliers, diversifying revenue away from cyclical consumer cycles.
Geography Analysis
APAC OLED Microdisplay Market
Asia Pacific commanded 56.64% of global revenue in 2025, reflecting the region’s dense network of backplane fabs, emitter suppliers and consumer-device assemblers. Ongoing capacity expansions by Samsung Display and leading Chinese foundries ensure supply continuity, while cross-border joint ventures smooth technology transfer. Government incentives in South Korea and China further lower production costs, sustaining regional leadership.
North America OLED Microdisplay Market
North America anchors high-specification demand, especially for defense and enterprise-XR deployments that demand ruggedized, high-brightness modules. Venture-capital funding in Silicon Valley and Boston fuels start-ups developing optics and driver ICs, which in turn elevates local sourcing of prototype displays. Defense procurement, led by programs such as the F-35 helmet upgrade, adds a stable layer to North American oled microdisplay market purchases.
EMEA and South America OLED Microdisplay Market
Europe focuses on automotive rollouts and high-margin medical visualization. German and French tier-one suppliers work with panel makers to co-design low-latency interfaces for automotive head-up implementations. The Middle East & Africa region, although starting from a small base, is pacing at a 40.6% CAGR due to defense-modernization budgets and luxury-vehicle imports that include advanced AR-HUDs. South America remains largely consumer-oriented, with gradual opportunities arising from local camera production and burgeoning gaming communities.

Value Chain Analysis
The OLED microdisplay value chain runs from silicon backplane design and wafer processing through OLED emitter material supply, deposition and patterning equipment, and panel fabrication that integrates the OLEDoS front-plane. It then moves through testing and module assembly, including optical-grade bonding and encapsulation, before downstream integration into near-to-eye optics, EVFs, and HUD engines. Asia Pacific remains the manufacturing hub, supported by ongoing OLEDoS capacity build-outs at Chinese and South Korean players. For example, BOE disclosed plans in September 2025 to convert its Beijing B1 LCD line into OLEDoS production infrastructure, reflecting the shift toward higher-volume microdisplay supply.
Key pinch points are more concentrated in advanced process and packaging steps than in basic materials. High-brightness, small-pixel OLEDoS requires tight semiconductor process control, sophisticated microlens structures, and thin-film encapsulation that can manage moisture ingress at high ppi. The supply chain also relies on specialized equipment vendors for deposition and fine patterning, along with upstream components such as driver ICs and optical-grade bonding materials. The evidence pack indicates these are heavily import-dependent in China. In response, suppliers are pursuing vertical integration and regionalization, including Kopin's May 2026 move to purchase OLED deposition equipment to establish full-scale in-house OLED microdisplay manufacturing capability in Westborough, Massachusetts for domestic defense demand.
Competitive Landscape
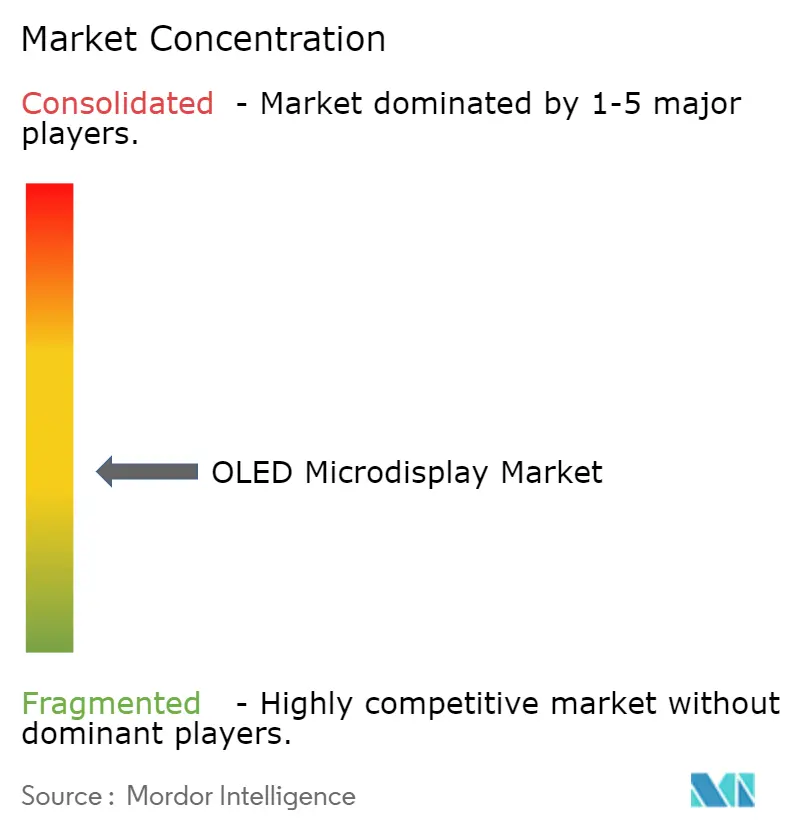
Roughly five vendors-Samsung Display, LG Display, BOE Technology, Sony Semiconductor Solutions and eMagin-collectively controlled 65% of 2024 revenue. Direct access to maskless lithography, tandem-stack emitters and proprietary backplanes forms a high barrier for late entrants. The Samsung-eMagin deal integrates cutting-edge direct patterning with world-scale OLED lines, accelerating cost reductions at resolutions above 4K.[3]eMagin Corporation, “Samsung Display Completes Acquisition of eMagin,” eMagin, emagin.com
Specialists such as Kopin and Lumicore differentiate through optical-path co-design and power-reduction algorithms, serving military, medical and industrial clients that value bespoke performance. INT-Tech’s 60,000-nits proof-of-concept panel signals that innovation is not confined to conglomerates, keeping competitive pressure high within premium tiers of the oled microdisplay market.[4]OLEDWorks, “OLEDWorks Awarded DoD Contract for High-Brightness OLED Display Development,” OLEDWorks, oledworks.com
Partnership models are proliferating. Automotive suppliers are linking with display houses to codevelop head-up optics and driver software; camera OEMs are entering long-term volume commitments to lock in capacity. The outcome is a moderate-concentration structure that rewards both scale and specialization, with ongoing M&A expected as smaller firms seek capital for pilot-line expansion.
OLED Microdisplay Industry Leaders
-
Microoled SA (Photonis Technologies SAS)
-
Yunnan Olightek Opto-electronic Technology Co. Ltd
-
Winstar Display Co. Ltd
-
Emagin Corporation
-
Kopin Corporation
- *Disclaimer: Major Players sorted in no particular order
OLED Microdisplay Market Companies Covered in this Report
- Sony Semiconductor Solutions Corp.
- Seiko Epson Corporation
- Kopin Corporation
- eMagin Corporation
- Yunnan Olightek Opto-Electronic Technology
- Microoled SA
- WiseChip Semiconductor Inc.
- Fraunhofer FEP
- Sunlike Display Technology
- BOE Technology Group Co., Ltd.
- Raysolve Technology
- SeeYA Technology
- AUO Corporation
- Dresden Microdisplay GmbH
- Jasper Display Corp.
- Himax Technologies, Inc.
- United Microdisplay Partners
- HC SemiTek Corporation
- Plessey Semiconductors
- OLiGHTEK Optoelectronics Kunming Co.
- Truly Semiconductors Ltd.

Market Opportunities and Future Outlook
Large-scale 12-inch wafer investments and module capacity additions in China are expanding the addressable supply base for sub-1 inch OLEDoS, which supports cost-down programs and broader OEM qualification beyond early adopters. Lumicore is one example, commencing construction of a USD 390 million 12-inch OLED microdisplay fab in Nanjing in February 2026, with early production targeted for 2027. Sidtek has also pointed to multi-hundred-million-dollar 12-inch and module expansion plans, including a Meishan module fab capacity plan referenced at 13 million modules annually in the evidence pack. With this capex wave, equipment, materials, and test suppliers have clearer entry points to support high-yield tandem-stack and direct-patterning process flows.
Demand opportunities concentrate where users pay for higher brightness, higher ppi, and rugged reliability, including defense helmet-mounted and weapon sight optics, premium XR near-to-eye systems, and automotive AR-HUD optical engines. Product refresh cycles also tend to reward differentiated suppliers as tandem OLEDoS becomes a centerpiece for flagship AR optical stacks. The evidence pack notes eMagin introduced a tandem RGB OLED microdisplay for AR waveguides in May 2026, with engineering sample availability. As Chinese pure-play OLEDoS manufacturers gain broader visibility, supplier shortlists widen and OEMs can dual-source more effectively, reducing some of the geopolitical and lead-time risks tied to Japan-China supply-chain concentration highlighted in the report context.
Recent Industry Developments in OLED Microdisplay Market
- May 2026: Kopin announced the purchase of OLED deposition systems and related equipment to establish full-scale in-house OLED microdisplay manufacturing capability at its Westborough, Massachusetts headquarters. The move shifts Kopin further from a fabless posture toward vertically integrated domestic production aligned to US defense demand, tightening supply assurance for military programs that specify rugged near-to-eye modules.
- October 2025: MICROOLED raised an additional EUR 8.5 million in funding from existing shareholders. The financing supports continued product and business expansion, reinforcing MICROOLED's ability to scale deliveries into defense and outdoor optics programs where qualification cycles and inventory commitments can be long.
- September 2024: Sony Semiconductor Solutions announced the release of the ECX350F, a 0.44-type Full HD OLED microdisplay featuring 5.1 micrometer pixels and 10,000 cd/m2 brightness. This launch pushed the competitive bar for pixel miniaturization and luminance in compact form factors, strengthening the supplier toolkit for high-resolution EVFs and near-to-eye systems.


OLED Microdisplay Market Report Scope and Research Methodology
Market Definition and Coverage
This market covers OLED microdisplays that are typically under 1 inch diagonal and sold as display components into near-to-eye systems and other compact optical viewing products, where high pixel density and low power are needed.
Scope exclusions: We exclude LCD and LCoS microdisplays, micro-LED microdisplays, panels larger than 1 inch, and module refurbishments.
Segments Covered in This Report
-
By Type
- Near-to-Eye (NTE)
- Projection
- Electronic Viewfinder (EVF)
-
By Resolution
- SVGA and Below (≤800 × 600)
- XGA (1,024 × 768)
- HD (720p)
- Full HD (1080p)
- Above FHD (2K-4K-Plus)
-
By Technology
- RGB OLED-on-Silicon
- White OLED + Color Filter
- AMOLED on Glass
- Top-Emitting OLED
-
By Panel Size (Diagonal)
- <0.5 inch
- 0.5-1.0 inch
- >1.0 inch
-
By End-User Industry
-
Consumer Electronics
- AR/VR Headsets
- Digital Cameras and Camcorders
- Smart Wearables
-
Automotive
- AR Head-Up Displays
- Side-Mirror Replacement Displays
-
Healthcare
- Surgical and Diagnostic Wearables
- Medical Imaging Devices
-
Industrial and Enterprise
- Smart Glasses
- Machine Vision Systems
-
Aerospace and Defense
- Helmet-Mounted Displays
- Weapon and Thermal Sights
-
Law Enforcement and Security
- Night-Vision Goggles
- Body-Worn Cameras
- Others (Research and Education)
-
Consumer Electronics
-
By Geography
-
North America
- United States
- Canada
- Mexico
-
Europe
- Germany
- United Kingdom
- France
- Italy
- Spain
- Rest of Europe
-
Asia-Pacific
- China
- Japan
- South Korea
- India
- South East Asia
- Australia
- Rest of Asia-Pacific
-
South America
- Brazil
- Rest of South America
-
Middle East and Africa
-
Middle East
- United Arab Emirates
- Saudi Arabia
- Rest of Middle East
-
Africa
- South Africa
- Rest of Africa
-
Middle East
-
North America
Data Sources, Market Sizing, and Validation
Desk Research
Desk research starts by grounding the size model in measurable signals that move with OLED microdisplay demand. We review public sources such as UN Comtrade and national customs statistics for relevant display component trade flows, and we use US International Trade Commission datasets where classification details help with cross-checks. Technical adoption cues are also taken from sources such as IEEE and SPIE papers, along with patent publications that show where improvements in pixel density, brightness, and backplane design are being targeted.
To connect supply activity to demand, we also rely on company annual reports, earnings call transcripts, investor presentations, and product announcements, which help identify capacity additions and shipment timing. In parallel, a paid subscription covering company financials and intelligence is used to standardize revenue splits when disclosures are uneven, and a patent database is used to map filing intensity by application area. The desk sources listed here are illustrative only, and many other public sources were also consulted for collection, validation, and clarification.
Primary Interviews and Surveys
Primary interviews and survey inputs are used to convert the desk signals into realistic assumptions on unit volumes, pricing, and timing across end uses like near-to-eye devices, electronic viewfinders, and specialized optical equipment. We speak with a mix of component suppliers, module integrators, OEM level product teams, and distribution or channel participants across APAC, EMEA, and the Americas so gaps in public reporting can be closed and assumptions can be stress-tested.
Distribution of primary research fieldwork respondents
| Company type | Respondent position | Region |
|---|---|---|
| Top tier: 28% | CXOs: 12% | APAC: 42% |
| Mid tier: 56% | Functional/Unit leaders: 31% | EMEA: 34% |
| Smaller Players: 16% | Managers: 57% | Americas: 24% |
Market-Sizing & Forecasting
The core model is built with a top-down approach where production, adoption, and device shipment signals are used to reconstruct the addressable demand pool for OLED microdisplays, and then translated into revenue using an application level ASP range. To make sure the totals are realistic, selective bottom-up checks are run, such as rolling up sampled supplier shipments, validating channel allocations, and using unit volumes times price bands for key use cases.
A few inputs matter a lot in this market, so they are handled carefully and then reviewed again during validation. These include near-to-eye device shipment outlook, mix shifts between consumer and defense or industrial programs, average microdisplay size and resolution trends (which can change pricing), yield and capacity utilization signals from the supply side, and currency conversion timing for reported revenues. When a bottom-up check has missing coverage, we fill the gap using conservative penetration and pricing assumptions that are anchored in interview ranges and then tested against the total demand pool.
For forecasting, scenario analysis is used to reflect the fact that program ramps can be lumpy, especially for AR or defense procurement cycles. The scenarios are built around adoption timing, expected ASP progression, and supply availability constraints, and then the final forecast is aligned to the most consistent view across expert inputs and observable shipment indicators.
Data Validation & Update Cycle
Validation happens in several steps so the final number is not driven by one assumption. We compare outputs against independent signals such as device shipment ranges, trade movement direction, and supply-side capacity announcements, and then investigate variances that look out of pattern for the year.
Before sign-off, the model and its assumptions are reviewed by another analyst, and outliers are rechecked with follow-up questions when needed. Reports are refreshed annually, and interim updates are made when material events occur, such as major capacity changes or demand shocks in near-to-eye devices. Right before delivery, we do a fresh pass through key inputs so clients receive the latest updated view.
Mordor Intelligence's Oled Microdisplay Market Size Measured Against Other Published Estimates
Published market sizes for OLED microdisplays can look far apart, even when they sound like they are measuring the same thing. The gap usually comes from how each study draws the product boundary, the year used for the stated value, and the way pricing and volume ramps are assumed for near-to-eye devices.
By tracking shipment outlooks, ASP bands by application, and the under-1-inch product boundary, Mordor Intelligence keeps the estimate tied to actual demand signals rather than counting adjacent microdisplay technologies or refurbished modules. Differences also show up when a source uses a longer forecast window with slower early adoption, applies a single blended price across all use cases, or converts currencies using a different timing, which can shift the stated USD value for the same year.
Benchmark comparison
| Source | Market Size | Gaps in Research Methodology |
|---|---|---|
| Mordor Intelligence | USD 1.76 B (2026) | |
| Industry Publisher A | USD 1.06 B (2024) | Uses an earlier base year and appears to include a broader manufacturer and regional production-consumption framing, with limited clarity on whether adjacent display technologies or module level revenue are filtered out the same way. |
| Industry Publisher B | USD 0.33 B (2024) | Lower 2024 value aligns with more conservative early adoption assumptions and a longer forecast horizon, which can understate near-term program ramps and keep ASP progression flatter across applications. |
The table shows that year selection and boundary control drive most of the spread. When the market is counted only for OLED microdisplays below 1 inch and then pressure-tested with demand and pricing checks, the outcome stays more traceable to repeatable inputs that can be revalidated during updates.


Key Questions Answered in the Report
What is the current value of the oled microdisplay market?
The market is worth USD 1.76 billion in 2026 and is tracking a 38.23% CAGR toward USD 8.85 billion by 2031.
Which application segment generates the largest revenue?
Near-to-Eye headsets account for 63.78% of 2025 revenue due to strong AR/VR headset demand.
How fast is the automotive segment expanding?
Automotive integrations, mainly AR head-up displays, are projected to grow at 39.7% CAGR between 2026-2031.
Which region dominates supply?
Asia Pacific holds 56.64% of global revenue and concentrates the majority of OLED-on-Silicon foundry capacity.
What technological hurdle most limits wider adoption?
Moisture-ingress encapsulation remains the foremost reliability challenge, trimming the forecast CAGR by an estimated 3.2%.
Who recently advanced panel brightness leadership?
INT-Tech demonstrated a direct-patterned RGB microdisplay reaching 60,000 nits, signaling rapid progress toward outdoor-readable OLED wearables.
Page last updated on:





