Oil And Gas Security Market Size and Share
Market Overview
| Study Period | 2020 - 2031 |
|---|---|
| Market Size (2026) | USD 31.87 Billion |
| Market Size (2031) | USD 40.55 Billion |
| Growth Rate (2026 - 2031) | 4.92% CAGR |
| Fastest Growing Market | Asia Pacific |
| Largest Market | North America |
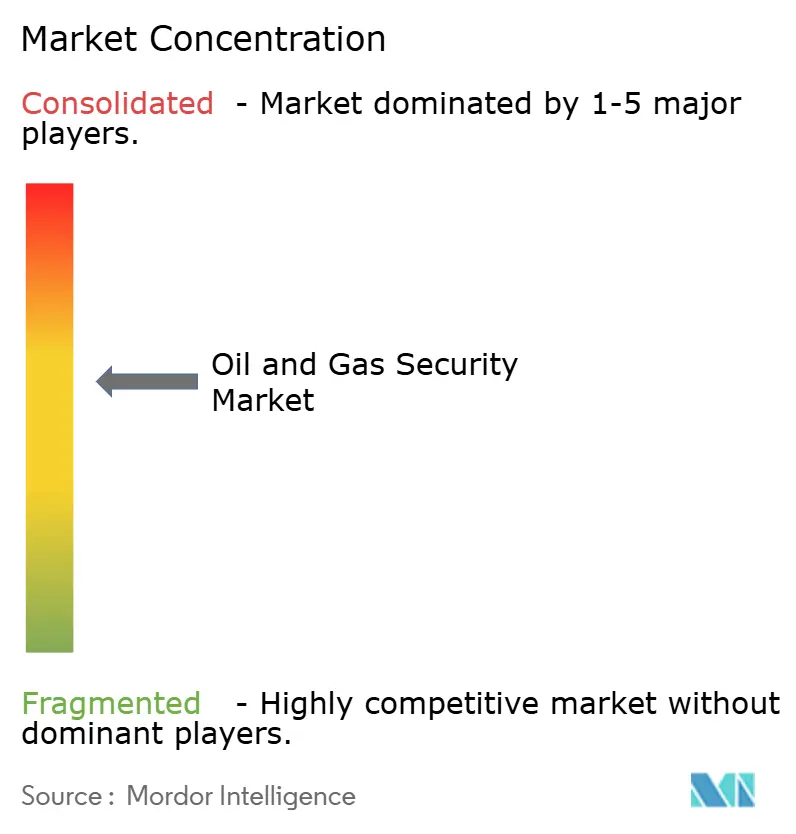
| Market Concentration | Medium |
Major Players *Disclaimer: Major Players sorted in no particular order Image © Mordor Intelligence. Reuse requires attribution under CC BY 4.0. | |
Oil And Gas Security Market Analysis by Mordor Intelligence
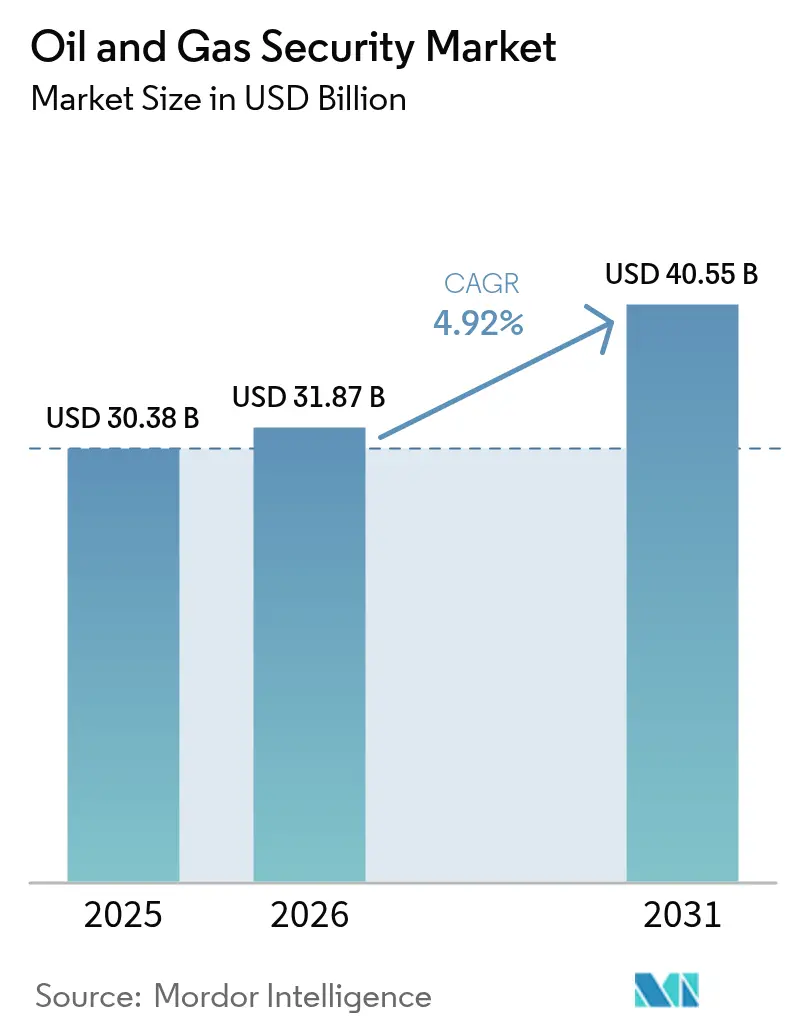
The Oil And Gas Security market size is expected to grow from USD 30.38 billion in 2025 to USD 31.87 billion in 2026 and is forecast to reach USD 40.55 billion by 2031 at 4.92% CAGR over 2026-2031.
This growth trajectory shows that energy companies are putting sustained capital into security programs even as commodity prices swing. The shift from reactive safeguards to proactive, intelligence-driven models is accelerating because cyber incidents now expose operational technology (OT) as well as information technology (IT) assets. Heightened geopolitical tension, stricter pipeline rules, and rising insurance prerequisites keep budgets anchored on both cyber and physical controls. Vendors that can blend hardware, software, and managed services into a unified OT-IT stack are positioned to capture disproportionate value in the next five years.
Key Report Takeaways
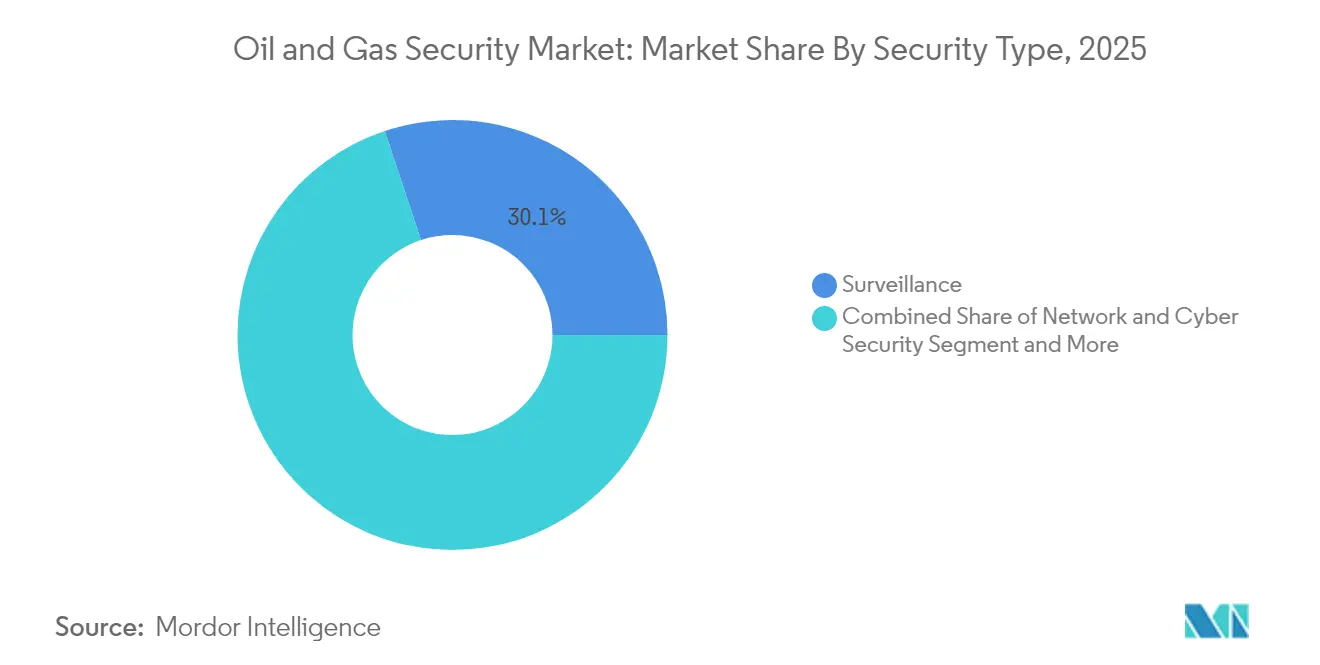
- By security type, surveillance systems led with 30.10% revenue share of the oil and gas security market in 2025, while cybersecurity solutions are projected to expand at an 7.85% CAGR through 2031.
- By component, hardware accounted for 52.10% of the oil and gas security market size in 2025, whereas managed and professional services are forecast to grow at a 9.05% CAGR to 2031.
- By operation stage, upstream operations held 46.70% oil and gas security market share in 2025, while downstream segments are set to advance at an 8.35% CAGR through 2031.
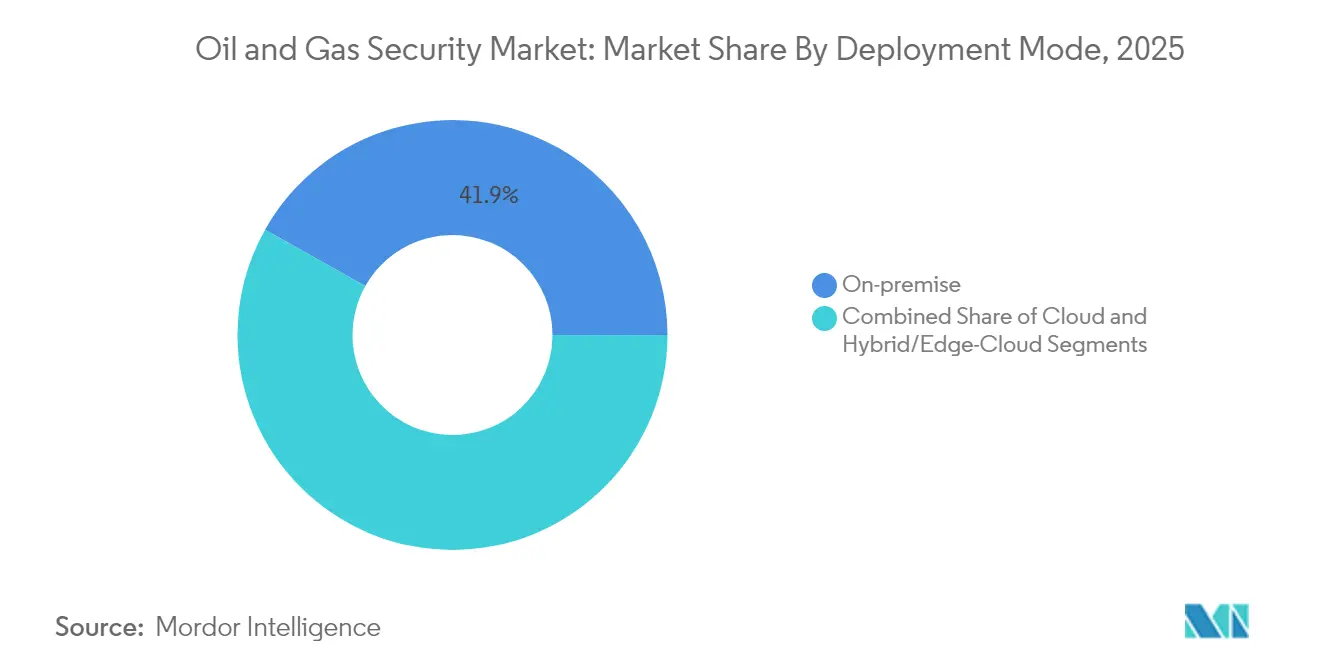
- By deployment mode, on-premise installations captured 41.85% share of the oil and gas security market size in 2025, with cloud solutions accelerating at a 9.25% CAGR to 2031.
- By application, exploration and production sites commanded 28.10% of the oil and gas security market share in 2025, whereas refineries and petrochemical plants are projected to grow fastest at a 7.15% CAGR through 2031.
- By geography, North America commanded 35.90% market share in 2025, whereas Asia-Pacific records the strongest regional CAGR at 8.75% to 2031.
Note: Market size and forecast figures in this report are generated using Mordor Intelligence’s proprietary estimation framework, updated with the latest available data and insights as of 2026.
Global Oil And Gas Security Market Trends and Insights
Drivers Impact Analysis*
| Driver | (~) % Impact on CAGR Forecast | Geographic Relevance | Impact Timeline |
|---|---|---|---|
| OT–IT convergence lifts cyber-risk | +1.2% | Global, concentrated in North America and Europe | Medium term (2-4 years) |
| Mandatory TSA and IEC rules for pipelines | +0.8% | North America and Europe, expanding into Asia-Pacific | Short term (≤ 2 years) |
| AI-driven predictive security analytics | +0.6% | Global, led by North America and China | Medium term (2-4 years) |
| Energy-price volatility spurs insurance demand | +0.4% | Global, with high sensitivity in Europe and Asia-Pacific | Short term (≤ 2 years) |
| Autonomous offshore assets needing edge-to-core security | +0.3% | Global, concentrated in North Sea and Gulf of Mexico | Long term (≥ 4 years) |
| Source: Mordor Intelligence | |||
Growing OT–IT Convergence Elevating Cyber-Risk
Operational assets, once isolated from corporate networks, now connect to cloud and enterprise systems, broadening attack surfaces. Incidents prompted by this linkage allow adversaries to pivot from IT into safety-critical OT, increasing the likelihood of physical disruption. [1]National Institute of Standards and Technology, “Guide to Operational Technology Security,” nist.gov United States agencies report that even low-skill groups successfully target industrial control systems, exposing weak segmentation and minimal multifactor authentication. Network zoning, zero-trust policies, and real-time anomaly detection are therefore moving from best practice to baseline expectation. Complexity grows as firms modernize without halting production, forcing staged rollouts and parallel architectures. Improved governance that aligns IT security, engineering, and production teams forms a critical piece of spend over the forecast horizon.
Mandatory TSA and IEC Cyber Rules for Pipelines
Revised Transportation Security Administration directives compel pipeline operators to verify controls, close gaps, and report breaches in set time windows. IEC 62443 is simultaneously emerging as the global control-system benchmark, with regional groups such as Japan’s CERT delivering implementation guidance. [2]Japan Computer Emergency Response Team, “IEC 62443 Control-System Security,” jpcert.or.jp Europe’s NIS2 directive layers additional duties by mandating incident disclosure within 24 hours. Monetary penalties and potential shutdown orders for non-compliance raise security from discretionary spending to operational necessity. Vendors versed in both governance and technical deployment are in demand as operators seek turnkey compliance programs.
AI-Driven Predictive Security Analytics Adoption
Machine-learning models now analyze sensor flows from wells, compressors, and valves to spot abnormal patterns before they escalate. Research shows deep neural networks detect offshore flow anomalies with heightened precision, cutting unplanned downtime and false positives. Start-ups such as AI EdgeLabs package lightweight agents capable of operating on constrained edge devices in remote basins. Combining predictive maintenance and cyber threat scoring, these platforms support consolidated physical-to-cyber security operation centers. Cost advantages stem from earlier incident detection and reduced manual triage, reinforcing steady adoption across upstream, midstream, and downstream nodes.
Energy-Price Volatility Boosting Insurance Requirements
Insurers now require rigorous evidence of cybersecurity maturity before extending or renewing coverage. Brokers note steady premium levels despite rising claims, making adequate coverage achievable for firms that can show sound controls. Large reinsurers list ransomware, supply-chain exposure, and state-backed attacks as primary loss drivers for energy policyholders. For operators, this trend equates to a financial incentive to tighten monitoring and incident response. Those demonstrating compliance with OT security standards benefit from broader capacity and lower deductibles, further propelling investment in integrated control environments.
Restraints Impact Analysis*
| Restraint | (~) % Impact on CAGR Forecast | Geographic Relevance | Impact Timeline |
|---|---|---|---|
| Legacy SCADA upgrade cost overruns | -0.7% | Global, highest in North America | Medium term (2-4 years) |
| OT-security talent shortage in remote basins | -0.5% | Global, acute in emerging and isolated regions | Long term (≥ 4 years) |
| Cloud-data sovereignty conflicts | -0.3% | Primarily EU and Asia-Pacific | Short term (≤ 2 years) |
| ESG-driven divestment reducing capex | -0.2% | Europe and North America | Long term (≥ 4 years) |
| Source: Mordor Intelligence | |||
Legacy SCADA Upgrades Cost Overruns
Many platforms still rely on 20-year-old supervisory control systems never architected for network exposure. Firms routinely underestimate the engineering and downtime expense needed for segmentation, multifactor authentication, and encrypted telemetry. Upgrades often cost two to three times the original budget when compatibility hurdles surface mid-deployment. Extended asset lifecycles make capital allocation difficult, forcing operators to weigh short-term productivity loss against long-term resilience. Academic studies find that ineffective cross-department communication further delays execution and inflates cost.
Shortage of OT-Security Talent in Remote Basins
Industrial cybersecurity requires expertise in Modbus, DNP3, Safety Instrumented Systems, and fieldbus protocols—skills scarce in rural locations. Public-sector analyses highlight the gap between conventional IT curricula and OT needs. Companies respond by partnering with specialized academies, yet the learning curve keeps reliance on managed services high. Lack of on-site expertise can slow incident containment and lengthen recovery windows. Elevated labor costs and consultant dependence dilute margins, particularly for small and midsize operators.
*Our forecasts treat driver/restraint impacts as directional, not additive. The impact forecasts reflect baseline growth, mix effects, and variable interactions.
Segment Analysis
By Security Type: Surveillance Leads, Cyber Accelerates
Surveillance platforms commanded 30.10% revenue share in 2025, confirming the market’s long-standing focus on perimeter and situational awareness. The oil and gas security market size tied to video analytics, drones, and access control remains significant, but annual growth moderates as budgets reallocate toward digital defenses. Network and cybersecurity solutions, advancing at an 7.85% CAGR, reflect mandatory pipeline rules and the rise in ransomware aimed at field assets. Incidents such as the Colonial Pipeline attack emphasized that an operational halt can stem from a laptop rather than a fence breach, nudging capital toward intrusion detection and secure remote-access gateways.
In the forecast window, integrated command centers that fuse camera feeds with cyber telemetry are expected to outpace single-purpose deployments. This convergence reduces false positives by correlating physical badges with network logins. Vendors able to cross-tag events from cameras, firewalls, and controllers into a unified screen are likely to capture an expanding slice of the oil and gas security market. Consequently, surveillance remains vital but increasingly embedded within broader cyber-physical platforms, moderating standalone unit sales while lifting software analytics revenue.


By Component: Hardware Dominates, Services Surge
Hardware still comprised 52.10% of the oil and gas security market share in 2025, spanning firewalls ruggedized for hazardous zones, intrinsically safe cameras, and vibration-resistant servers. However, the managed-services segment posts a 9.05% CAGR as operators contract 24 × 7 monitoring and incident response to offset skill gaps. The oil and gas security market size attached to service retainers is increasing because each new site demands advanced analytics, threat intelligence feeds, and periodic red-team assessments.
Service growth is also tied to regulatory audits, which require independent validation and documentation. Firms lacking internal capacity rely on MSSPs that specialise in OT assets; these providers bundle asset discovery, vulnerability management, and compliance reporting into multi-year agreements. Hardware vendors are reacting through outcome-based models that package equipment and services, thereby smoothing revenue and deepening customer lock-in.
By Operation Stage: Upstream Dominates, Downstream Accelerates
Upstream fields, offshore platforms, and unmanned wellheads absorbed 46.70% of 2025 spending, reflecting their broad geographic footprint and inherent risk. However, downstream refineries and petrochemical complexes grow fastest at 8.35% CAGR as Industry 4.0 programs join process control with enterprise resource planning. The oil and gas security market size for downstream projects is buoyed by investments in advanced process controllers, edge servers, and AI-powered anomaly detection tied to safety-instrumented loops.
In contrast, upstream budgets are expected to level off as many rigs have already adopted baseline controls during prior digital initiatives. Downstream operators, driven by a large aggregation of feedstocks and high consequences of disruption, are layering secure Wi-Fi, digital twins, and predictive maintenance. Convergence with supply-chain platforms pushes information beyond facility walls, forcing stronger encryption and zero-trust gateways that align with refinery turnaround cycles.
By Deployment Mode: On-Premise Prevails, Cloud Surges
On-premise models represented 41.85% of 2025 revenue because operators continue to value local oversight of mission-critical data. Yet cloud implementations expand at a 9.25% CAGR, aided by platforms such as Halliburton’s iEnergy Hybrid Cloud that blends edge processing with central analytics. The oil and gas security market size attributed to hybrid deployments will broaden as operators adopt containerized workloads running on rugged edge nodes synchronized to regional data centers.
Policy hurdles around data residency slow uptake in Europe and parts of Asia, but vendors address these by offering sovereign regions and customer-managed encryption keys. While cloud usage introduces new attack vectors, it also enables near-real-time global threat intelligence and automated response, improving mean time to remediate. Consequently, decision makers weigh the security gains of consolidated telemetry against compliance requirements, leading to a hybrid path rather than a full leap to the public cloud.
By Application: Exploration Sites Lead, Refineries Accelerate
Exploration and production sites retained a 28.10% share of 2025 spending because their remote nature demands satellite-backhauled video, perimeter intrusion detection, and portable containers housing micro-data centers. The oil and gas security market size linked to refineries, however, grows at 7.15% CAGR as sensor density rises and supply-chain integrations deepen. Integration of automated blend controls and digital twins boosts surface area for cyber threats, thereby expanding budgets for layered defenses.
LNG terminals and gas processing plants follow similar trajectories, modernizing control rooms and integrating predictive analytics that depend on secure connectivity. Pipeline corridors sustain steady spending due to direct regulatory oversight. Retail and distribution terminals round out the application mix, modernizing payment systems and adopting license-plate recognition, which requires encrypted links to central data lakes.
Geography Analysis
North America maintained a 35.90% stake in the oil and gas security market in 2025, supported by mandatory TSA directives and the lingering lessons of the Colonial Pipeline ransomware event. Canada’s threat assessments cite state-sponsored actors targeting production and midstream hubs, prompting coordinated public-private drills and grants for OT segmentation. Offshore assets in the Gulf of Mexico and the North Slope face calls for urgent cyber upgrades following federal audits that flagged outdated firewalls and unpatched HMIs.
Asia-Pacific records the fastest CAGR at 8.75% through 2031 as China extends trunk pipelines and storage capacity into border regions, blending OT security with sovereign cloud mandates from Beijing. Japan legislated economic-security rules that classify oil and gas as critical social infrastructure, compelling operators to file security plans with regulators. India expands refinery capacity and LNG terminals, sourcing managed services from local security operations centers in Bengaluru and Hyderabad. Australia and South Korea embed OT security clauses into new LNG export projects after noting rising regional tension in the South China Sea. Europe’s modernization drive centers on the NIS2 framework that mandates 24-hour incident reporting and annual audits for essential energy entities. LNG import build-outs across Germany, France, and the Netherlands add scale and complexity, necessitating encrypted maritime-to-terminal links. The Middle East and Africa experience stepped-up funding after a 206% rise in documented attacks, showcased at regional cyber forums. Latin America remains nascent but sees incremental investment as Brazil, Argentina, and Guyana grow production and seek alignment with IEC 62443.


Competitive Landscape
The oil and gas security market remains moderately fragmented. Traditional automation vendors—Honeywell, Schneider Electric, and Siemens—use entrenched OT footprints to cross-sell cyber modules and managed services. Specialist firms like Dragos, Claroty, and Nozomi Networks differentiate through deep packet inspection tuned for industrial protocols. Meanwhile, cloud hyperscalers collaborate with oilfield service companies to deliver hybrid OT-cloud stacks, evidenced by Red Hat and Intel’s edge compute initiative tailored for ruggedized sites.
M&A activity is reshaping portfolios. Rockwell Automation’s acquisition of Verve Industrial fuses asset inventory, vulnerability management, and SOC workflows into a single pane. Armis’s purchase of Otorio expands exposure-management tools for pipelines and refineries. Cloud providers partner with telecoms to deliver private 5G backhauls, securing unmanned wellheads while meeting bandwidth for AI video analytics.
Strategic positioning now hinges on platform breadth rather than point solutions. Vendors that integrate safety-instrumented systems, cyber telemetry, and AI-driven analytics inside subscription licenses build recurring revenue and stickier customer relationships. Service rollouts in remote basins, autonomous offshore fields, and LNG loading terminals create opportunities for niche entrants offering edge-hardened micro-SOC appliances. Overall, rivalry intensifies as suppliers race to secure wallet share before multiyear compliance timelines lock budgets.
Oil And Gas Security Industry Leaders
ABB Ltd.
Airbus Defence and Space
BAE Systems plc
Baker Hughes Cyber-Security Services
Belden Inc.
- *Disclaimer: Major Players sorted in no particular order

Recent Industry Developments
- May 2025: EOG Resources agreed to acquire Encino Acquisition Partners for USD 5.6 billion, expanding its Utica Shale acreage and elevating risk-management requirements for new gathering systems.
- March 2025: Honeywell announced plans to separate its automation and aerospace units, enabling a pure-play industrial-software company focused on secure, connected operations.
- March 2025: Armis acquired Otorio to deepen operational-technology exposure management for critical energy assets.
- February 2025: EQT finalized its Equitrans transaction worth USD 4.7 billion, adding pipeline assets that fall under TSA cyber oversight.
- January 2025: Liberty Energy partnered with Cummins to develop a variable-speed, large-displacement natural-gas engine for fracturing fleets, embedding secure telematics from inception.
- December 2024: SECURE Energy Services disclosed USD 175 million in metals-recycling acquisitions, broadening exposure to waste streams linked to oilfield services.
- October 2024: IFS rolled out AI-driven BOLO 15, automating back-office tasks and tightening data lineage for joint-interest accounting.


Research Methodology Framework and Report Scope
Market Definitions and Key Coverage
Our study defines the oil and gas security market as all spending on hardware, software platforms, and managed or professional services deployed to prevent, detect, or respond to physical and cyber threats across upstream, midstream, and downstream facilities.
Scope Exclusion: payroll costs for in-house guards and standalone insurance premiums are outside this scope.
Segmentation Overview
- By Security Type
- Network and Cyber Security
- Surveillance
- Screening and Detection
- Command and Control
- Physical Access Control
- Other Types
- By Component
- Hardware
- Software Platforms
- Services (Managed and Professional)
- By Operation Stage
- Upstream (Exploration and Production)
- Midstream (Pipelines and Storage)
- Downstream (Refining and Distribution)
- By Deployment Mode
- On-premise
- Cloud
- Hybrid/Edge-Cloud
- By Application
- Exploration and Production Sites
- Offshore Platforms and FPSOs
- Pipeline Monitoring
- Refineries and Petrochem Plants
- LNG and Gas Processing
- Retail and Distribution Terminals
- By Geography
- North America
- United States
- Canada
- Mexico
- South America
- Brazil
- Argentina
- Chile
- Rest of South America
- Europe
- Germany
- United Kingdom
- France
- Italy
- Spain
- Russia
- Rest of Europe
- Asia-Pacific
- China
- India
- Japan
- South Korea
- Malaysia
- Singapore
- Australia
- Rest of Asia-Pacific
- Middle East and Africa
- Middle East
- United Arab Emirates
- Saudi Arabia
- Turkey
- Rest of Middle East
- Africa
- South Africa
- Nigeria
- Egypt
- Rest of Africa
- Middle East
- North America
Detailed Research Methodology and Data Validation
Primary Research
Mordor analysts interviewed OT security managers at offshore platforms, midstream control-room supervisors in North America and the Middle East, and global integrators supplying surveillance and industrial firewall bundles. Responses clarified refresh cycles, typical spend per kilometer of pipeline, and regional variance in cloud migration of SCADA defenses.
Desk Research
We began with open-source fundamentals from agencies and bodies such as the US Transportation Security Administration pipeline directives, the International Energy Agency cybersecurity guidelines, the International Association of Oil & Gas Producers incident database, and customs shipments aggregated by Volza for security hardware flows. Annual reports, 10-Ks, and investor decks from major pipeline operators supplemented adoption benchmarks.
Supporting financial intelligence was retrieved from D&B Hoovers, news vetting through Dow Jones Factiva, and patent trends via Questel to gauge emerging analytics and sensor technologies. These inputs framed baseline demand, regulatory triggers, and average solution price bands; many other public and proprietary references were consulted for cross-checks, yet are not exhaustively listed here.
Market-Sizing & Forecasting
A top-down reconstruction anchored on active well counts, installed pipeline length, and refinery throughputs was built, then balanced with selective bottom-up vendor roll-ups of hardware units multiplied by sampled average selling prices. Key variables like incident frequency trends, TSA fine schedules, average security spend per barrel equivalent, cloud adoption ratios, and regional CAPEX guidance drive our multivariate regression forecast. Where supplier data were patchy, incidence-based proxies and channel interviews filled gaps before iterative recalibration.
Data Validation & Update Cycle
Outputs pass anomaly scans, senior analyst peer review, and variance checks against independent energy price and capex indices; models refresh annually, with interim updates triggered by material cyber events or regulatory shifts, ensuring clients receive the latest view before each delivery.
Why Mordor's Oil And Gas Security Baseline Is Dependable
Published estimates frequently diverge because firms vary scope filters, refresh cadence, and the rigor applied to validate supplier claims.
Key gap drivers include whether services bundled with enterprise-wide IT security are counted, the treatment of one-off pipeline hardening projects, currency conversion timing, and how aggressively declining ASPs are modeled after 2027. Mordor reports only spend clearly tied to oil and gas operational assets and refreshes the baseline every twelve months, which moderates over-optimistic spikes seen elsewhere.
Benchmark comparison
| Market Size | Anonymized source | Primary gap driver |
|---|---|---|
| USD 30.38 B (2025) | Mordor Intelligence | - |
| USD 27.76 B (2024) | Global Consultancy A | excludes managed services and uses 18-month-old pricing data |
| USD 29.48 B (2025) | Regional Consultancy B | limited primary interviews; hardware-centric scope |
| USD 32.50 B (2025) | Trade Journal C | lumps maritime shipping risk modules into total |
These comparisons show that when inconsistent scopes or aging assumptions are stripped away, Mordor's disciplined blend of fresh field inputs and transparent variable mapping offers a balanced, decision-ready baseline.


Key Questions Answered in the Report
What is the current size of the oil and gas security market?
The oil and gas security market size is estimated at USD 31.87 billion in 2026 and is projected to reach USD 40.55 billion by 2031.
Which segment grows fastest within the oil and gas security market?
Cybersecurity solutions show the highest growth, expanding at an 7.85% CAGR as operators focus on threat detection and compliance.
Why is Asia-Pacific the fastest-growing regional market?
Massive infrastructure expansion in China, Japan’s critical-infrastructure laws, and heightened geopolitical risks drive a 8.75% regional CAGR.
How are regulatory mandates influencing investment?
TSA pipeline directives, IEC 62443 standards, and EU NIS2 rules make cyber controls compulsory, moving spending from optional to essential.
What role does cloud deployment play in future security strategies?
Hybrid cloud platforms enable centralized analytics and faster patch cycles, supporting a 9.25% CAGR in cloud-based security solutions.
How fragmented is the competitive landscape?
With a concentration score of 6, market power is shared by large automation vendors and an expanding group of specialized industrial-cyber firms.
Page last updated on:


