
Market Overview
| Study Period | 2021 - 2031 |
|---|---|
| Forecast Data Period | 2026 - 2031 |
| Historical Data Period | 2021 - 2024 |
| Market Size (2026) | USD 3.41 Billion |
| Market Size (2031) | USD 4.67 Billion |
| Growth Rate (2026 - 2031) | 6.51 % |
| Market Concentration | Low |
Major Players *Disclaimer: Major Players sorted in no particular order Image © Mordor Intelligence. Reuse requires attribution under CC BY 4.0. | |
North America Spice And Herb Extracts Market Analysis by Mordor Intelligence
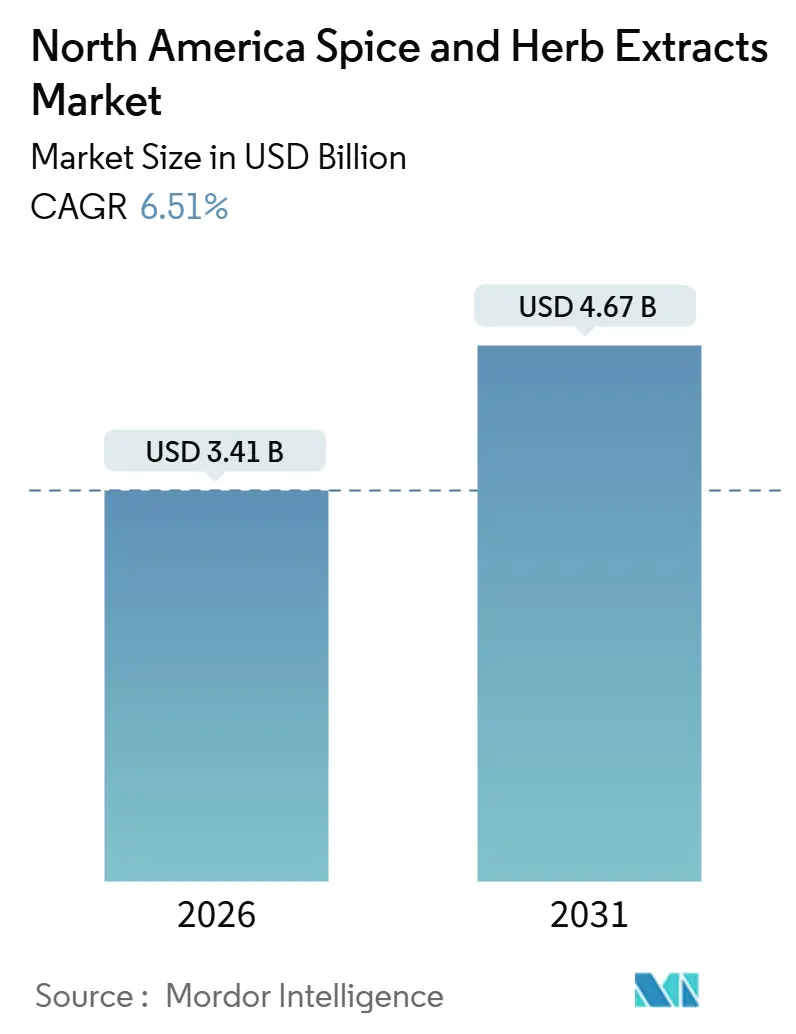
The North America spice and herb extracts market size stood at USD 3.41 billion in 2026 and is projected to reach USD 4.67 billion by 2031, advancing at a 6.51% CAGR during the forecast period. Ingredient transparency, clean-label mandates, and technology upgrades are reshaping procurement strategies as processors embed oleoresins, essential oils, and powder extracts into foods, beverages, supplements, and personal-care items. United States demand dominates, but Canada’s regulatory streamlining under the Natural Health Products Regulations is accelerating commercialization cycles, while Mexico’s emerging organic-processing base is attracting foreign direct investment. Retailers such as Whole Foods and Walmart now require front-of-pack disclosure of botanical origins, raising the strategic value of traceable extracts. At the same time, supercritical CO₂ and microencapsulation systems are lowering residual-solvent risks and extending shelf life, helping processors justify premium pricing and secure multiyear supply contracts.
Key Report Takeaways
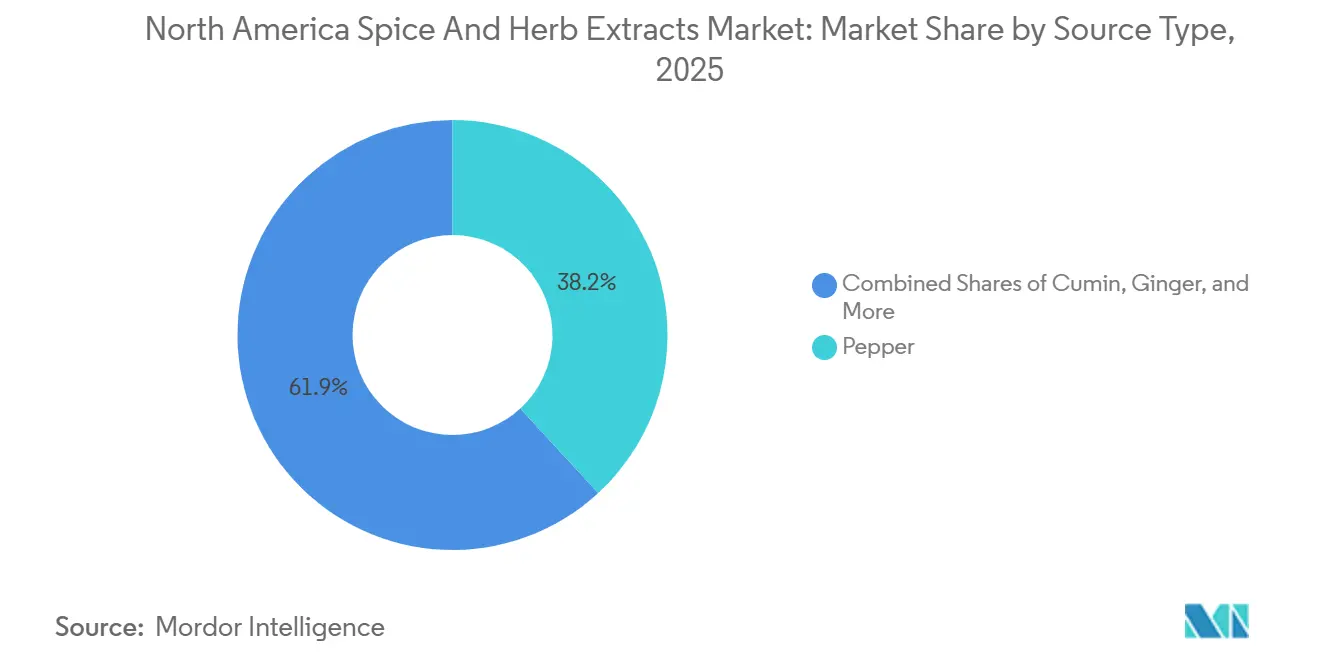
- By source type, pepper captured 38.15% of the North America spice and herb extracts market share in 2025, while ginger is expected to grow at a 7.82% CAGR through 2031.
- By form, liquid oleoresins held 42.51% revenue share in 2025; powder extracts are forecast to expand at an 8.25% CAGR to 2031.
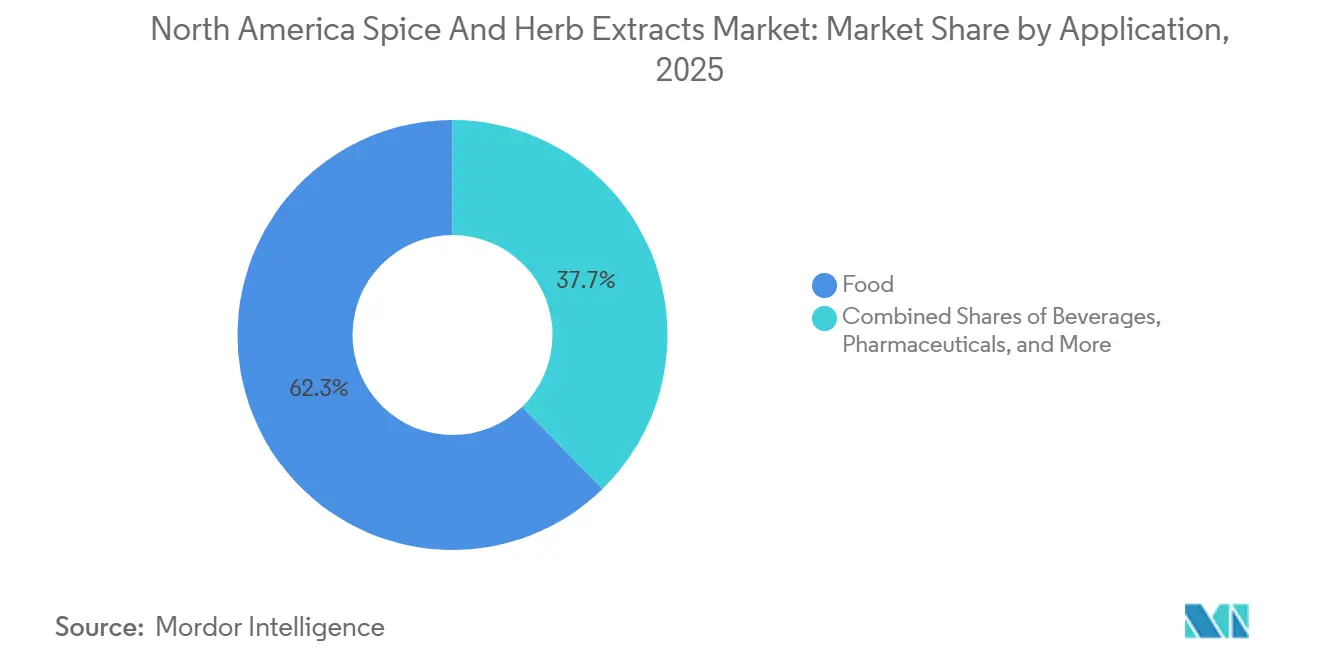
- By application, food accounted for 62.28% of the North America spice and herb extracts market size in 2025, whereas personal care and cosmetics are advancing at a 9.12% CAGR through 2031.
- By geography, the United States commanded 71.22% revenue share in 2025; Canada is projected to post a 9.28% CAGR between 2026 and 2031.
Note: Market size and forecast figures in this report are generated using Mordor Intelligence’s proprietary estimation framework, updated with the latest available data and insights as of January 2026.
North America Spice And Herb Extracts Market Trends and Insights
Drivers Impact Analysis*
| Drivers | (~)% Impact on CAGR Forecasts | Geographic Relevance | Impact Timeline |
|---|---|---|---|
| Increasing demand for natural and clean-label ingredients | +1.8% | United States, Canada, with spillover to Mexico | Medium term (2-4 years) |
| Rising adoption of spice and herb extracts in functional and fortified food and beverages | +1.5% | United States, Canada | Medium term (2-4 years) |
| Growing appeal of ethnic and exotic cuisines | +1.2% | United States urban centers, Canada metropolitan areas | Short term (≤ 2 years) |
| Preference for organic spices and herbs on the rise | +0.9% | United States, Canada | Long term (≥ 4 years) |
| Advancements in extraction technologies | +0.7% | United States, Canada | Long term (≥ 4 years) |
| Export expansion by major supplying countries | +0.4% | North America, with focus on US import channels | Medium term (2-4 years) |
| Source: Mordor Intelligence | |||
Increasing Demand for Natural and Clean-Label Ingredients
Processors are replacing synthetic flavor compounds with spice oleoresins to satisfy transparency mandates from retailers such as Whole Foods and Kroger, which now require suppliers to disclose all flavoring agents on front-of-pack labels. Ingredion's 2025 clean-label survey found that 68% of North American consumers actively avoid products listing "natural flavors" without botanical specificity, pushing formulators toward ingredients like paprika oleoresin and black pepper extract that carry recognizable names. This shift is compressing reformulation cycles, with Kalsec reporting a 22% increase in customer requests for Foreign Exchange Management Act GRAS-certified hop and spice extracts during 2025. The Food and Drug Administration's updated guidance on "natural" claims in January 2025 further tightened definitions, requiring extraction methods that avoid synthetic solvents-a standard that supercritical CO2 and ethanol-based processes inherently meet.[1].
Rising Adoption of Spice and Herb Extracts in Functional and Fortified Food and Beverages
Functional-beverage brands are embedding ginger and turmeric extracts into ready-to-drink formats targeting inflammation reduction and immune support, capitalizing on clinical evidence linking curcumin and gingerol to biomarker improvements. A 2024 study in Nutrients demonstrated that 500 milligrams of standardized ginger extract reduced C-reactive protein levels by 14% over 8 weeks, providing formulators with dosage benchmarks for label claims. Doehler's 2025 product catalog introduced microencapsulated cinnamon extract designed for protein shakes, delivering sustained release that masks bitterness while contributing antioxidant capacity. Regulatory frameworks are adapting, with Health Canada granting Natural Health Product Numbers to 17 spice-extract formulations in 2025, up from 9 in 2024, signaling faster pathways for structure-function claims[2].
Growing Appeal of Ethnic and Exotic Cuisines
North American restaurants are sourcing cumin, cardamom, and coriander extracts to replicate regional flavor profiles from South Asia, the Middle East, and Latin America, driven by demographic shifts and culinary tourism. The National Restaurant Association's 2025 trends report identified "global fusion" as the second-fastest-growing menu category, with 43% of operators adding dishes featuring harissa, gochugaru, or za'atar spice blends[3]. ADM's flavor division launched a line of liquid spice extracts in 2025 tailored for ghost kitchens, offering concentrated cardamom and fenugreek solutions that reduce prep time while maintaining authenticity. Retail channels are mirroring this trend, with Whole Foods reporting a 31% year-over-year increase in sales of products featuring "exotic spice" descriptors during 2025.
Advancements in Extraction Technologies
Supercritical CO2 extraction is displacing solvent-based methods for high-value botanicals, delivering higher purity and eliminating residual hexane concerns that trigger non-compliance with organic certifications. A 2025 patent filed by Synthite Industries detailed a two-stage CO2 process that extracts both volatile oils and non-volatile oleoresins from black pepper in a single run, reducing energy consumption by 28% compared to sequential steam distillation and solvent extraction. Microencapsulation via spray-drying is enabling powder formats that withstand high-temperature processing in extruded snacks, with Kerry Group's 2025 investor presentation highlighting a proprietary maltodextrin matrix that protects curcumin from oxidation during baking. These innovations are lowering the total cost of ownership for mid-sized processors, as modular CO2 systems priced below USD 500,000 enter the market, democratizing access to premium extraction capabilities.
Restraints Impact Analysis*
| Restraints | (~)% Impact on CAGR Forecasts | Geographic Relevance | Impact Timeline |
|---|---|---|---|
| Stringent and evolving European food safety and allergen labeling regulations | -0.6% | United States and Canada exporters to EU | Short term (≤ 2 years) |
| High cost of implementing advanced extraction technologies | -0.5% | Small and mid-sized processors in United States, Canada, Mexico | Medium term (2-4 years) |
| Intense competition from synthetic substitutes | -0.8% | United States, Canada | Short term (≤ 2 years) |
| Fluctuating prices and inconsistent supply of raw materials | -1.1% | North America, with acute impact on US and Canada | Short term (≤ 2 years) |
| Source: Mordor Intelligence | |||
Fluctuating Prices and Inconsistent Supply of Raw Materials
Black pepper prices climbed 18% in 2024 following drought conditions in Vietnam's Central Highlands, which account for 34% of global exports, forcing North American processors to activate contingency contracts with Brazilian and Indonesian suppliers at premium rates. Ginger supply tightened in early 2025 when China-responsible for 28% of global production-imposed temporary export quotas to stabilize domestic food inflation, creating a 6-week lead-time gap for oleoresin manufacturers. Cardamom prices remain volatile, oscillating between USD 25 and USD 38 per kilogram during 2025 due to erratic monsoons in Guatemala and India, the two dominant origins, according to the Financial Times. Processors are responding by diversifying sourcing footprints and investing in vertical integration, with McCormick's 2025 annual report disclosing the acquisition of a 500-acre organic turmeric farm in southern India to secure supply for its North American oleoresin operations.
Intense Competition from Synthetic Substitutes
Synthetic vanillin, capsaicin analogs, and nature-identical piperine continue to undercut natural extracts on price, with cost differentials ranging from 40% to 70% depending on the compound and purity grade. A 2025 cost analysis by IFF revealed that synthetic capsaicin for hot-sauce formulations costs USD 18 per kilogram versus USD 62 per kilogram for chili oleoresin standardized to 5% capsaicinoids, creating margin pressure for brands that lack premium positioning. However, regulatory tailwinds are narrowing this gap, as the European Union's Farm to Fork strategy and California's Proposition 65 updates in 2024 imposed stricter disclosure requirements for synthetic additives, prompting reformulation toward natural alternatives. Symrise's 2025 sustainability report noted a 19% increase in customer conversions from synthetic to natural spice extracts, driven by retailer mandates and consumer backlash against "chemical-sounding" ingredients.
*Our forecasts treat driver/restraint impacts as directional, not additive. The impact forecasts reflect baseline growth, mix effects, and variable interactions.
Segment Analysis
By Source Type: Pepper Dominates, Ginger Accelerates on Wellness Demand
In 2025, pepper dominated 38.15% of North America's spice and herb extracts market, primarily due to its significant applications in savory foods and nutraceutical blends. A key factor driving its demand is piperine, which enhances curcumin absorption by an impressive 2,000%, making it indispensable in health-focused formulations. Ginger, projected to grow at a robust CAGR of 7.82%, is gaining traction across multiple industries, including functional beverages, anti-nausea pharmaceuticals, and anti-inflammatory cosmetic products. Cumin is increasingly favored in plant-based meat alternatives, effectively masking the off-notes associated with pea protein. Additionally, chili oleoresins remain a cornerstone of the hot sauce segment, as evidenced by Huy Fong Foods' substantial 200 metric-ton supply agreement in 2025, highlighting their critical role in this category.
Herbs such as coriander, cardamom, oregano, basil, and thyme are establishing themselves in high-margin niches, particularly in premium spirits and preservative-free cosmetic products. The cinnamon market is undergoing a notable segmentation into Ceylon and Cassia variants. Ceylon cinnamon, with its lower coumarin content that complies with European Union safety regulations, commands a premium of 35%, reflecting its growing preference among health-conscious consumers. Meanwhile, celery extract remains a vital ingredient in "no nitrate added" meat curing processes, ensuring natural color and flavor while meeting United States Department of Agriculture Food Safety and Inspection Service (FSIS) tolerance requirements, thereby catering to the demand for clean-label meat products.

By Form: Liquid Oleoresins Lead, Powder Extracts Surge on Convenience
In 2025, liquid oleoresins accounted for a 42.51% revenue share, primarily due to their ability to provide precise dosing in applications such as sauces and marinades. On the other hand, powder extracts are anticipated to grow at a robust CAGR of 8.25%, driven by advancements in spray-drying and fluid-bed encapsulation technologies. These processes produce free-flowing, shelf-stable ingredients that are particularly well-suited for use in instant soups and seasoning blends. Essential oils occupy a high-value niche in the market, commanding prices two to three times higher than oleoresins. This premium pricing is attributed to their therapeutic-grade purity and compliance with ISO 4730 specifications, which ensure consistent quality and performance.
Microencapsulated formats represent the fastest-growing subsegment within the market. For instance, Kalsec has developed a dual-layer microencapsulation system that significantly enhances turmeric's bioavailability by 40% by ensuring its release in the intestine. This innovation creates new opportunities for targeted nutritional supplements. However, liquid oleoresins face logistical challenges related to cold-chain requirements, as oxidation rates for ingredients like ginger increase significantly when stored above 25 °C. In contrast, powder formats eliminate the need for chilled logistics, offering a cost-effective solution by reducing freight expenses and ensuring product stability during transportation.
By Application: Food Anchors Revenue, Personal Care Outpaces Growth
In 2025, food applications dominated the North American market for spice and herb extracts, claiming a substantial 62.28% share. This segment encompassed a diverse range, including dairy products, dressings, meats, and snacks. Meanwhile, the personal-care sector is set to witness robust growth, with projections indicating a 9.12% CAGR. This surge is largely attributed to the rising preference for oregano, rosemary, and thyme extracts, which are increasingly replacing synthetic preservatives. This shift not only aligns with market trends but also circumvents the prohibitions outlined in the EU's Annex II. In the pharmaceutical realm, ginger and turmeric, both of pharmacy-grade quality, are securing over-the-counter listings. Their prominence is particularly noted in products targeting digestive health and anti-inflammatory benefits, bolstered by three new Food and Drug Administration GRAS (Generally Recognized As Safe) notices in 2025.
In the food sector, dairy manufacturers are expanding flavor innovation. For instance, Danone's cardamom-infused Greek yogurt, which sold out in just four weeks across Canada, exemplifies the trend. Manufacturers are blending black pepper and cinnamon extracts into yogurts and cheeses to appeal to adventurous palates. On the meat front, processors are turning to rosemary and oregano oleoresins not only for flavor but also as a natural means to combat Listeria and Salmonella. This approach enhances safety and extends shelf life while reducing reliance on synthetic lactates. Snack brands are adopting microencapsulated chili to deliver a gradual heat sensation. Meanwhile, in the beverage sector, alcohol producers are collaborating with extract suppliers to develop signature botanicals for gin and vermouth.
Geography Analysis
The United States held 71.22% of 2025 revenue, anchored by the world's largest processed-food sector and stringent clean-label mandates from retailers such as Target and Walmart, which now require suppliers to disclose extraction methods and botanical origins. Food and Drug Administration regulations under 21 CFR 182 and 184 classify most spice oleoresins as Generally Recognized as Safe, streamlining their incorporation into food formulations without pre-market approval, a regulatory efficiency that European processors lack. McCormick's Baltimore facility, which processes 40% of the company's North American spice extracts, completed a USD 75 million supercritical CO2 expansion in late 2024, increasing oleoresin capacity by 18,000 metric tons annually. California's Proposition 65 updates in 2024 added 6 synthetic flavor compounds to the state's carcinogen list, accelerating reformulation toward natural spice extracts among West Coast food manufacturers.
Canada is forecast to grow at 9.28% through 2031, driven by Health Canada's streamlined Natural Health Products Regulations, which reduced approval timelines from 18 months to 9 months for standardized botanical extracts in 2025. Organic certification under the Canada Organic Regime expanded by 14% in 2025, with 23 new spice-extract processors achieving certification, signaling robust demand for premium, traceable ingredients, according to the Canadian Food Inspection Agency. Quebec-based processors are capitalizing on proximity to the United States Northeast market, offering 48-hour delivery for liquid oleoresins to craft-beverage producers in Vermont and New York.
Mexico's spice-processing sector remains underdeveloped relative to its agricultural output, yet United States Department of Agriculture organic equivalency agreements ratified in 2024 are attracting foreign investment, with Givaudan announcing a USD 30 million extraction facility in Jalisco scheduled to commence operations in 2027, according to Givaudan. Rest of North America, encompassing Central America and the Caribbean, contributes marginally but serves as a critical sourcing origin for vanilla and allspice, with Belize and Jamaica exporting semi-processed oleoresins to US toll manufacturers.
Regulatory Landscape
In the United States, spice and herb extracts used in foods are primarily managed under FDA food additive and GRAS frameworks, including 21 CFR 182.10 (spices and natural seasonings) and 21 CFR 172.510 (natural flavoring substances), with compliance anchored to Good Manufacturing Practices. FDA oversight is operationalized through tools such as the Substances Added to Food inventory, and extract compositions, along with permitted carriers or solvents, must align with applicable Title 21 requirements when used as flavoring ingredients.
In Canada, Health Canada sets food additive permissions through the Lists of Permitted Food Additives (incorporated by reference into the Food and Drug Regulations), and the Canadian Food Inspection Agency (CFIA) enforces composition and labeling. Canada also introduced an agile approach to food compositional standards on December 18, 2024, moving requirements into the incorporated Canadian Food Compositional Standards document, which supports faster updates that affect how botanical ingredients and extract-containing foods are formulated and labeled.
Value Chain Analysis
The value chain begins with cultivation and primary processing of spices and herbs in origin countries, often outside North America, and then moves through export logistics into the region for importers and ingredient distributors. Domestic processors carry out cleaning, milling, blending, and extraction (including solvent, hydroethanolic, and supercritical CO2 routes), followed by standardization, quality testing, and packaging into liquid oleoresins, essential oils, and powder or microencapsulated formats. Specialized extract manufacturers and flavor houses supply food and beverage formulators, supplement and natural health product manufacturers, and personal care and cosmetics producers, with downstream routes spanning direct-to-manufacturer contracts and distribution through ingredient channels.
Key control points that shape cost, lead time, and compliance include raw-material traceability, residue and solvent compliance under US food additive and GRAS rules (21 CFR Part 170, 21 CFR 182.10, and 21 CFR 172.510), and the food safety system requirements demanded by large buyers. Bottlenecks typically reflect origin concentration, variability in port and inland freight, and inventory carrying costs tied to clean-label documentation and analytical verification; several North America-facing suppliers have responded by emphasizing domestic processing to tighten quality control and shorten replenishment cycles.
Competitive Landscape
The North America spice and herb extracts market exhibits fragmented competition, as no single player commands more than 12% share and regional toll processors coexist with vertically integrated multinationals. Strategies bifurcate into cost leadership, pursued by high-volume oleoresin suppliers leveraging economies of scale in solvent extraction, and differentiation, exemplified by Kalsec's proprietary hop-extract platform that delivers natural antimicrobial and antioxidant functionality without off-flavors.
White-space opportunities are emerging in microencapsulated formats for controlled-release supplements and heat-sensitive applications, where incumbents lack the spray-drying infrastructure that specialized encapsulation firms like Southwest Research Institute have commercialized. Technology is the primary battleground, with patent filings for supercritical CO2 processes increasing 27% year-over-year in 2025, as firms race to secure intellectual property around energy-efficient extraction and novel botanical combinations.
Emerging disruptors include vertically integrated spice growers in Mexico and Central America that are bypassing traditional brokers to supply extract manufacturers directly, compressing supply chains and capturing margin previously lost to intermediaries. Symrise's 2025 acquisition of a Guatemalan cardamom estate exemplifies this backward-integration trend, securing 600 metric tons of annual raw-material supply while achieving Rainforest Alliance certification that appeals to sustainability-focused customers. ISO 22000 food-safety certification and FSSC 22000 compliance are becoming table stakes, with 18 North American extract processors achieving dual certification in 2025, up from 11 in 2024, as buyers mandate third-party audits to mitigate contamination risks. Smaller players are leveraging toll-manufacturing arrangements to access advanced extraction equipment without capital outlays, a model that Universal Oleoresins expanded in 2025 by opening its Texas facility to contract clients.
North America Spice And Herb Extracts Industry Leaders
-
Kerry Group plc
-
Dohler Gmbh
-
Olam International
-
DSM-Firmenich
-
McCormick and Company, Inc.
- *Disclaimer: Major Players sorted in no particular order

Market Opportunities and Future Outlook
Supplier programs that formalize origin traceability and sustainability are expanding commercialization space for branded, auditable spice-extract inputs across food, beverage, and adjacent categories. A concrete example is Olam Food Ingredients (ofi) launching Spice Maps in December 2025, which sets 2030 targets for major spices such as pepper, chile, and turmeric, supporting buyer requirements for documented sourcing and responsible supply chains. This fits retailer and manufacturer expectations for botanical specificity and origin disclosure, increasing the value of standardized, traceable extracts over generic flavor systems.
Formulation and processing opportunities are also tied to extraction and delivery technologies that reduce solvent concerns and improve stability in modern food matrices. The industry shift toward supercritical CO2 extraction and microencapsulation supports clean-label positioning and functional dosing needs in beverages, supplements, and personal care. Regulatory attention on food-ingredient governance remains active, including a March 2025 HHS direction for FDA to explore rulemaking to reform the self-affirmed GRAS pathway. Suppliers that can combine compliant processing, validated documentation, and rapid iteration, particularly in powder and encapsulated formats, have clearer paths to win reformulation projects and multi-application platform wins across North America.
Recent Industry Developments
- June 2026: Doehler announced a major expansion at its Cartersville, Georgia facility to increase natural flavor production and innovation capacity, including upgraded hydroethanolic extraction capabilities for botanicals and higher liquid flavor output. The move tightens regional supply for clean-label flavor systems that incorporate spice and herb extracts, while improving responsiveness for North America-focused product development cycles.
- April 2026: Kerry Group highlighted expanded beverage taste capacity and capability in North America in its Q1 2026 interim update. Additional local capacity supports faster scaling of spice and botanical extract-based taste systems for ready-to-drink and functional beverage customers that require consistent supply and short lead times.
- December 2025: Olam Food Ingredients (ofi) launched Spice Maps, a sustainability strategy covering priority spices including pepper, chile, turmeric, onion, cassia, and coconut across key sourcing regions. The framework elevates traceability and responsible sourcing as procurement requirements, influencing how extract suppliers secure origin supply and document compliance for North American customers.
Research Methodology Framework and Report Scope
Market Definition and Coverage
This market covers the value of spice and herb extracts sold in North America, where raw botanicals are processed into concentrated ingredients used to add flavor, aroma, and functional properties in end products.
Scope exclusions: Whole and unprocessed spices and herbs sold as retail or bulk commodities are excluded when they are not converted into extract formats.
Segmentation Overview
- By Source Type
- Celery
- Cumin
- Chili
- Coriander
- Cardamom
- Oregano
- Pepper
- Basil
- Ginger
- Thyme
- Cinnamon
- Other Source Types
- By Form
- Liquid Oleoresins
- Powder Extracts
- Essential Oils
- Micro-encapsulated Extracts
- By Application
- Food
- Dairy
- Dressings, Soups and Sauces
- Meat and Poultry
- Snacks and Convenience Food
- Other Applications
- Beverage
- Soft Drinks
- Tea & Herbal Drinks
- Alcoholic Beverages
- Pharmaceuticals
- Personal Care and Cosmetics
- Other Applications
- Food
- By Geography
- United States
- Canada
- Mexico
- Rest of North America
Data Sources, Market Sizing, and Validation
Desk Research
Desk research was used to set the market perimeter and to build the first set of inputs around supply, demand, and pricing. We relied on public, non-paywalled sources such as USDA data releases, USITC trade statistics, Statistics Canada tables, and Mexico INEGI industry outputs to understand processing activity and cross-border movement of extract-type ingredients.
To ground commercial assumptions, we also reviewed company filings and investor materials, customs and tariff notes, trade association publications for spices, flavors, and food ingredients, and peer-reviewed food science journals that discuss extraction yields and stability. Where it helped with consistency checks, we used paid subscriptions for company financial intelligence, patent lookups, and shipment-level import and export signals so the model could be reconciled with what is visible in the market. The sources listed here are illustrative only, and other public references were also used for data collection, validation, and clarification.
Primary Interviews and Surveys
Primary work focused on validating how extract demand is actually formed across food and beverage, supplements, and other users, and on checking typical price bands by form and concentration. We spoke with a mix of extract manufacturers, ingredient distributors, formulators, and procurement roles across the United States, Canada, and Mexico to correct desk-research assumptions where they were too broad.
Distribution of primary research fieldwork respondents
| Company type | Respondent position |
|---|---|
| Top tier: 33% | CXOs: 16% |
| Mid tier: 50% | Functional/Unit leaders: 30% |
| Smaller Players: 17% | Managers: 54% |
Market-Sizing & Forecasting
Sizing starts with a top-down build where North America demand is reconstructed from a combination of extract consumption indicators by application, trade flows for relevant ingredient codes, and processing output signals, which are then aligned to value using realistic price ladders. After that, selective bottom-up approximations are run to keep the totals realistic, including sampled supplier revenue splits, channel checks with distributors, and a volume times average selling price view by major extract forms.
A few inputs were treated as must-track variables because they move the market year to year. These include food and beverage production trends that pull flavor systems, the mix shift between liquid oleoresins and powder extracts, changes in clean-label reformulation activity, import reliance versus local processing in the United States, Canada, and Mexico, and average selling price movement driven by raw spice availability and concentration levels. For forecasting, we used scenario analysis supported by expert views, since crop-linked cost swings and reformulation cycles can create step changes that simple smoothing can miss. Where bottom-up views had gaps for small processors, the model uses conservative penetration assumptions and then rechecks them against trade and demand indicators before totals are finalized.
Data Validation & Update Cycle
Validation is done through repeated cross-checks so the market value does not rely on one single data series. Analysts compare the modeled totals against independent signals like trade direction, application-level demand movement, and price ranges gathered in interviews, then review outliers until the story and the math match.
Before sign-off, a second-pass review is completed to confirm unit conversions, currency timing, and any unusual jumps by country or application. Reports are refreshed annually, and material events that can shift pricing or supply availability trigger interim assumption updates. Right before delivery, a final analyst pass is completed so the latest available view is reflected in the publication.
Mordor Intelligence's North America Spice and Herb Extracts Market Sizing Compared With Other Published Estimates
Published market sizes for spice and herb extracts in North America often do not match because different studies count different products, use different base years, and apply their own pricing logic. Differences also show up when some numbers emphasize food-only use cases, while others mix in broader botanical ingredients that may not behave like extract markets.
The biggest gap drivers we see are how extract forms are grouped, how far the application scope is stretched beyond food and beverage, and how pricing is escalated across the forecast years. Some estimates apply aggressive growth and price inflation from a high base-year assumption, and others convert currencies or update assumptions at different points in the year, which can change the headline USD value. When the totals are tied back to form-level demand checks and realistic North America trade and processing signals, the spread becomes easier to explain. The approach used in this model is designed to keep that traceable linkage, with the 2026 base framed explicitly and kept consistent in Mordor Intelligence.
Benchmark comparison
| Source | Market Size | Gaps in Research Methodology |
|---|---|---|
| Mordor Intelligence | USD 3.41 B (2026) | |
| Regional Consultancy A | USD 4.80 B (2026) | This figure appears to use a wider ingredient umbrella that blends spice and herb extracts with adjacent botanical or clean-label ingredients, which inflates the counted demand pool beyond extract formats. |
| Industry Publisher B | USD 7.23 B (2025) | This estimate uses an earlier base year and a much higher starting value, which suggests broader inclusion by application and a faster price progression assumption rather than form- and concentration-linked pricing. |
Taken together, the comparison shows that scope and base-year choices explain most of the gap, and the remaining difference comes from how prices are rolled forward. Our method stays traceable because each step is linked to observable demand signals, practical form mixes, and interview-checked price ranges, which makes the resulting market size easier to reproduce and update.
Key Questions Answered in the Report
How large is the North America spice and herb extracts market in 2026?
The market generated USD 3.41 billion in 2026 and is forecast to reach USD 4.67 billion by 2031.
Which source type leads regional sales?
Pepper extracts led with 38.15% revenue share in 2025.
Which application is expanding fastest?
Personal-care and cosmetics uses are advancing at a 9.12% CAGR through 2031.
How fragmented is supplier competition?
No company holds more than 12% share, resulting in a concentration score of 3 out of 10.