Composite Material Market Size and Share
Market Overview
| Study Period | 2020 - 2031 |
|---|---|
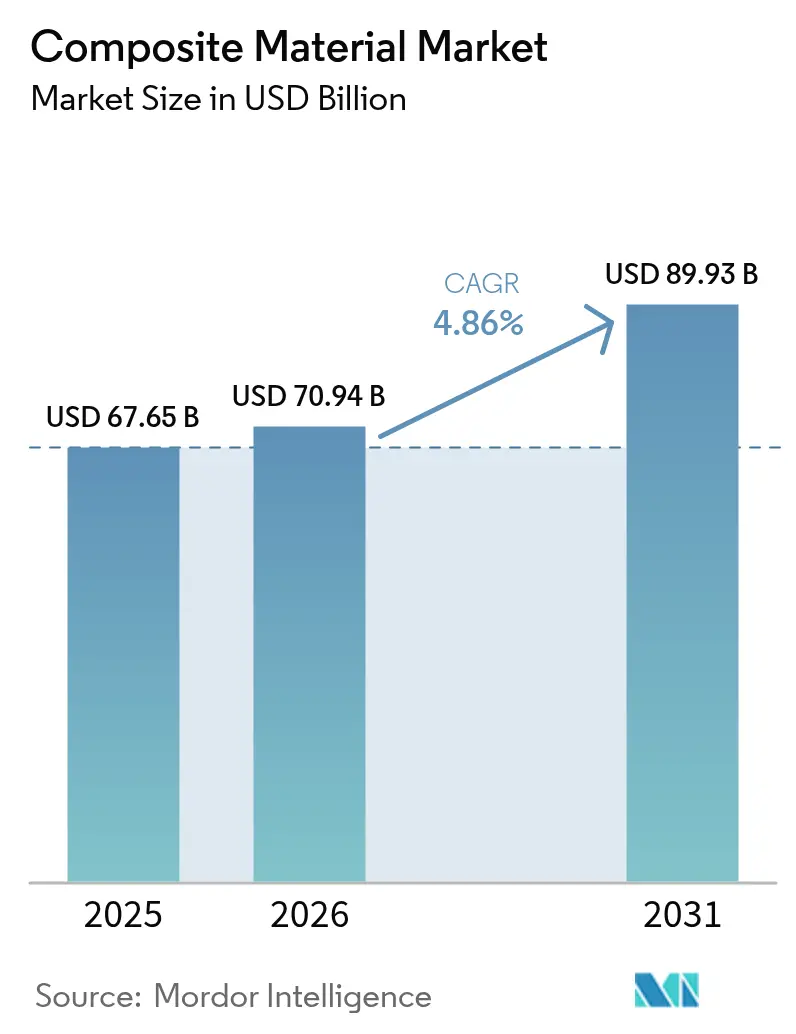
| Market Size (2026) | USD 70.94 Billion |
| Market Size (2031) | USD 89.93 Billion |
| Growth Rate (2026 - 2031) | 4.86% CAGR |
| Fastest Growing Market | Asia Pacific |
| Largest Market | Asia Pacific |
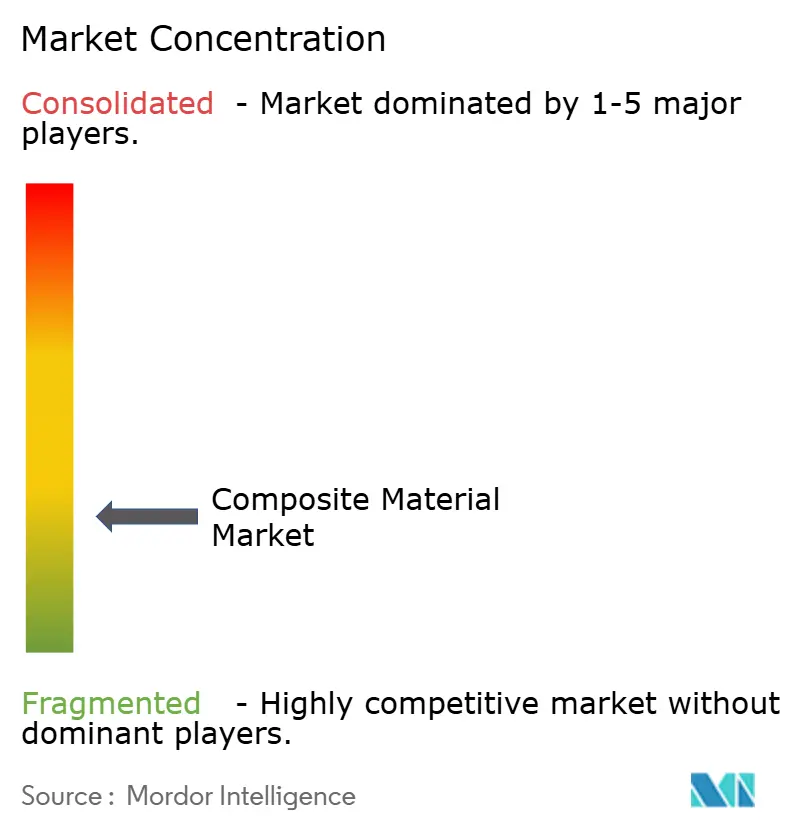
| Market Concentration | Low |
Major Players *Disclaimer: Major Players sorted in no particular order Image © Mordor Intelligence. Reuse requires attribution under CC BY 4.0. | |
Composite Material Market Analysis by Mordor Intelligence
The Composite Material market size is expected to grow from USD 67.65 billion in 2025 to USD 70.94 billion in 2026 and is forecast to reach USD 89.93 billion by 2031 at 4.86% CAGR over 2026-2031. Robust demand for lightweight, high-performance materials in transportation, energy, infrastructure and electronics is widening the application portfolio, while continuous process automation is lowering cycle times and defects. Asia-Pacific, holding 45.12% of global revenue in 2024, remains the epicenter of volume growth as wind-turbine expansion, electrification programs and large-scale infrastructure projects accelerate regional consumption. Rapid progress in ceramic matrix technologies, steady substitution of metals by polymer matrix grades and an improving supply base for specialty reinforcements are strengthening competitive barriers for late entrants. Recycling limitations, however, continue to cloud long-term circularity targets and could restrain adoption if end-of-life solutions do not keep pace with installation rates.
Key Report Takeaways
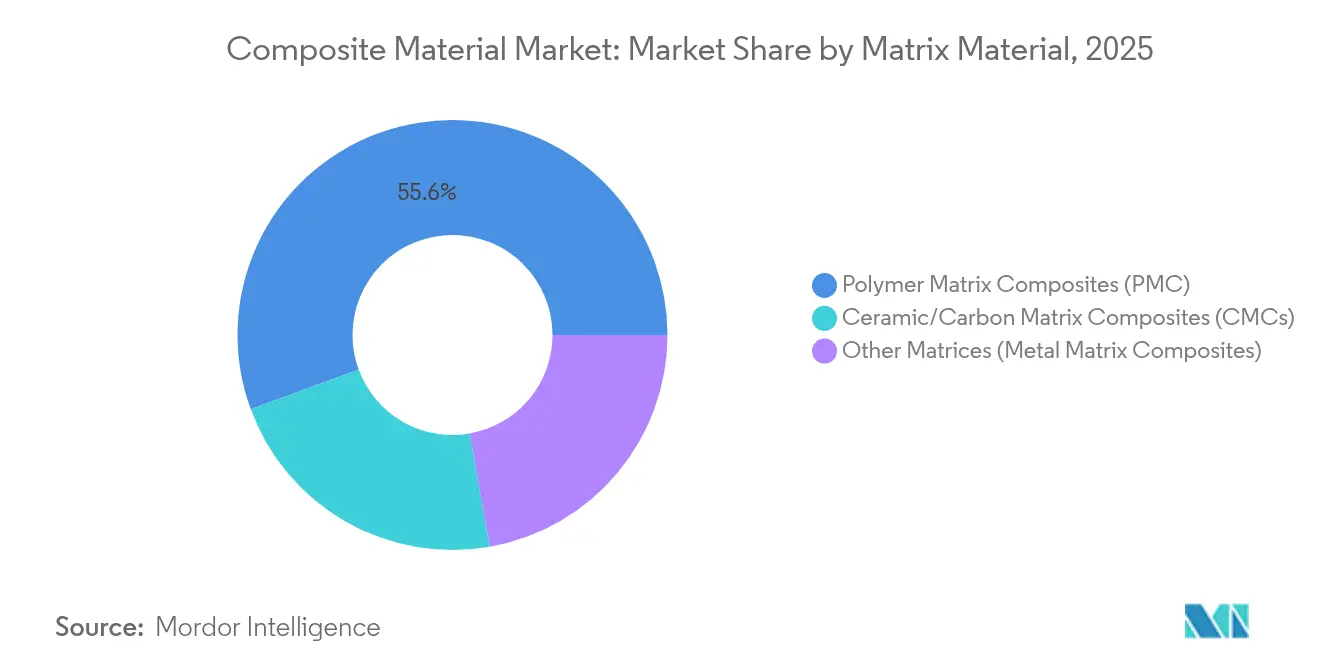
- By matrix material, polymer matrix composites commanded 55.62% of the composites market share in 2025, while ceramic matrix composites are poised to climb at an 8.12% CAGR through 2031.
- By reinforcement fiber, glass fiber held 54.63% revenue share in 2025; alternative fibers are forecast to expand at a 6.83% CAGR to 2031.
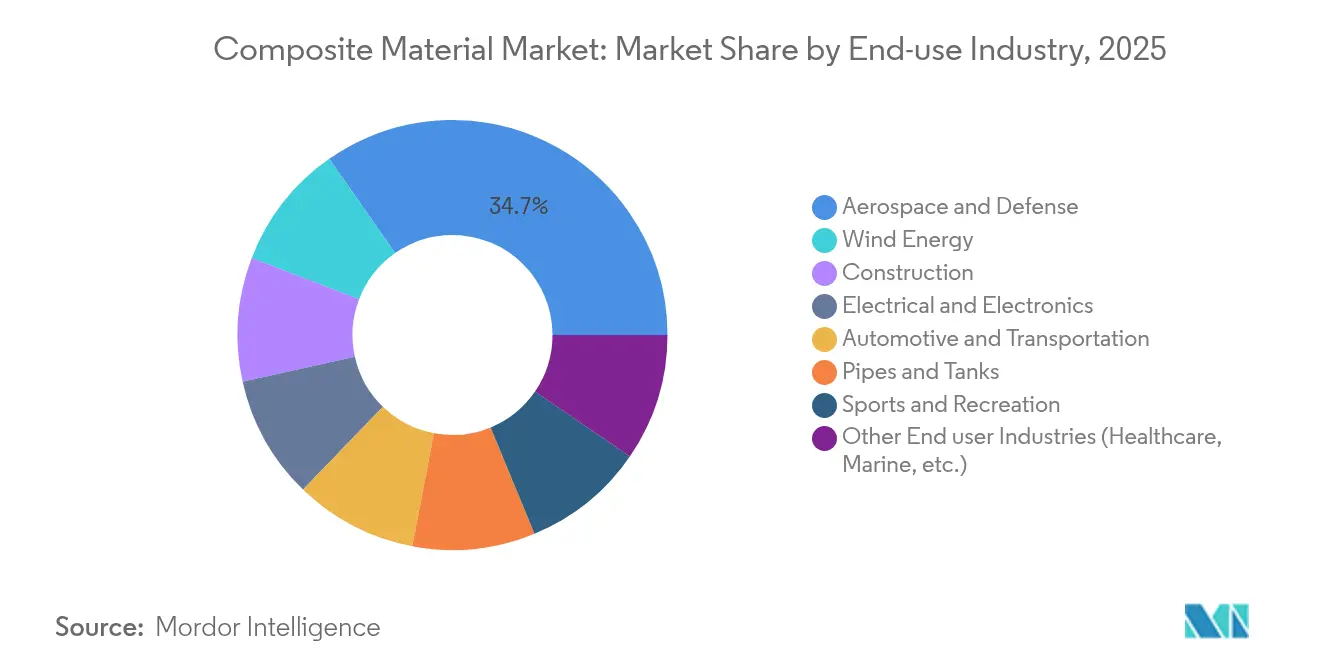
- By end-use industry, aerospace and defense accounted for 34.72% of the composites market size in 2025, whereas wind energy is surging at a 8.6% CAGR over the same horizon.
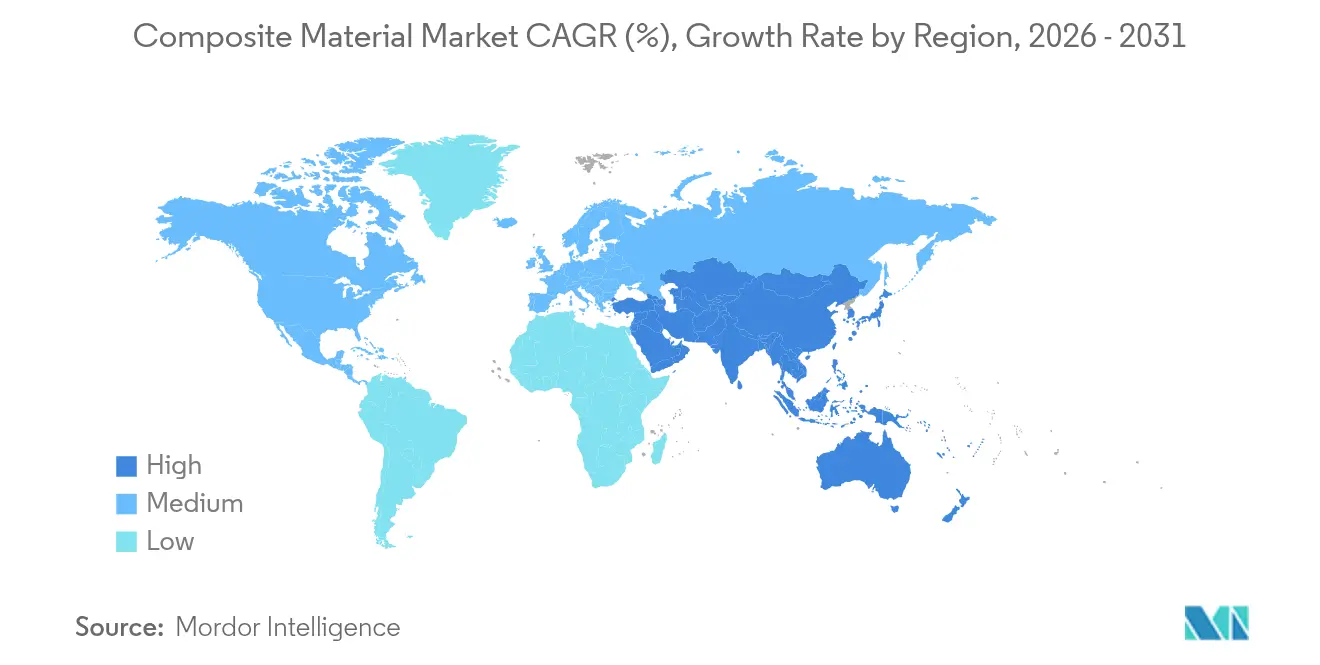
- By geography, Asia-Pacific led with 44.85% of global sales in 2025 and is tracking a 7.45% CAGR to 2031.
Note: Market size and forecast figures in this report are generated using Mordor Intelligence’s proprietary estimation framework, updated with the latest available data and insights as of 2026.
Global Composite Material Market Trends and Insights
Driver Impact Analysis*
| Driver | (~) % Impact on CAGR Forecast | Geographic Relevance | Impact Timeline |
|---|---|---|---|
| Electrification-driven carbon-fiber demand in e-mobility | +1.5% | Asia-Pacific, North America, Europe | Medium term (2-4 years) |
| Increasing usage in the manufacturing of wind turbine blades | +1.8% | Europe, Asia-Pacific, North America | Long term (≥ 4 years) |
| Growing adoption of thermoplastic composites in mass-production automotive | +1.4% | North America, Europe, Asia-Pacific | Medium term (2-4 years) |
| Increasing use of composites in the aerospace and defense industry | +1.6% | North America, Europe, Asia-Pacific | Long term (≥ 4 years) |
| Technological Advancement in the Field of Material Science | +1.2% | Global | Long term (≥ 4 years) |
| Source: Mordor Intelligence | |||
Electrification-Driven Carbon-Fiber Demand in E-Mobility
Electric vehicles integrate roughly 450 lb of plastics and polymer composites—an 18% rise compared with internal-combustion platforms—because every 10% curb in curb weight typically stretches driving range by 6-8%[1]American Chemistry Council, “Chemistry and Automobiles 2024,” americanchemistry.com. Battery enclosures have become a flagship application, where carbon-fiber reinforced polymers deliver a 30% mass cut versus aluminum without sacrificing thermal stability. Body panels molded from glass-fiber reinforced thermoplastics enable cost-competitive lightweighting, while natural-fiber laminates in interior trim broaden sustainability credentials. Automakers are converging on multi-material architectures that blend carbon, glass and bio reinforcements to optimise stiffness, crashworthiness and lifecycle emissions. Supply chains are responding by expanding tow capacity and qualified prepreg lines across North America, Europe and East Asia to avert bottlenecks during the 2026-2028 model-launch window.
Increasing Usage in the Manufacturing of Wind Turbine Blades
Global wind installations climbed 17% in 2024 and 35% in 2025, pushing cumulative capacity toward the 450 GW mark envisaged for 2035. Next-generation offshore machines now exceed 15 MW, requiring blades longer than 110 m that can only be realised with tailored composite lay-ups. More than 1 million t of glass and carbon reinforcements will be consumed annually for blade manufacture by the end of the decade, intensifying pressure on glass-fiber melt capacity and high-modulus carbon supply. While glass-fiber reinforced plastics continue to dominate on a cost-per-meter basis, selective carbon spar caps are proliferating to curb tip deflection and blade-root mass. Europe is piloting thermoplastic blades for weldable root joints, potentially enabling recycling routes that avoid co-processing in cement kilns. The sector’s emerging blade-circularity regulations make material traceability and resin reformulation urgent priorities for OEMs and fabricators.
Growing Adoption of Thermoplastic Composites in Mass-Production Automotive
Thermoplastic composites slice processing time by up to 60% compared with legacy thermoset systems, a prerequisite for 100 000-unit vehicle programs. Automated tape-laying now yields structural panels in minutes rather than hours, while injection over-molding unites metal inserts and ribbed thermoplastic skins in a single press cycle. Pultruded crash rails and roof bows bring continuous production economies to energy-absorbing sub-frames, broadening design freedom for battery-electric platforms. OEMs also value the intrinsic recyclability of fully thermoplastic architectures, which supports closed-loop scrap reuse goals and regulatory end-of-life directives. Technology suppliers such as Syensqo have validated composite formulations that tolerate quick-step consolidation without blistering, enabling press-shop takt times aligned with conventional steel stampings. As a result, the composites market is seeing heightened interest from volume manufacturers rather than niche supercar builders alone.
Increasing Use of Composites in the Aerospace and Defense Industry
Carbon-fiber laminates now comprise up to 50% of the empty weight of wide-body airliners, underpinning fuel-burn reductions of 15-20% on long-haul routes. Ceramic matrix composites are redefining propulsion envelopes by tolerating 1 600 °C turbine-inlet temperatures, boosting thermal efficiency and cutting cooling-air penalties. GE Aerospace’s LEAP program has already logged 25 million flight hours with CMC shrouds, validating durability for civil fleets. Defense agencies leverage carbon-based structures for hypersonic vehicles where thermal stability and radar transparency coincide. Concurrently, space-launch providers specify ultra-high temperature CMCs capable of surviving re-entry spikes beyond 1 700 °C, unlocking reusable architectures for small-lift boosters. These breakthroughs ripple downstream into commercial drone fuselages and satellite antenna reflectors, reinforcing the sector’s role as a crucible for next-generation composite systems.
Restraint Impact Analysis*
| Restraint | (~) % Impact on CAGR Forecast | Geographic Relevance | Impact Timeline |
|---|---|---|---|
| High cost of composite materials | -0.8% | Global, stronger in emerging markets | Short term (≤ 2 years) |
| Challenges in recycling composite materials | -0.6% | Europe, North America, Asia-Pacific | Long term (≥ 4 years) |
| Skilled-Labour Gap in Automated Lay-up Processes | -0.4% | Global, with concentration in manufacturing hubs | Medium term (2-4 years) |
| Source: Mordor Intelligence | |||
High Cost of Composite Materials
Carbon-fiber composites typically price at five-to-ten times steel on a delivered-part basis, deterring penetration into cost-sensitive segments. Aerospace-grade prepregs entail autoclave curing, tight environmental controls and extensive non-destructive testing, each inflating unit expense. Automotive programs confront similar hurdles, confining carbon-fiber usage largely to premium marques despite favorable weight-benefit ratios. Production scale remains a pivotal barrier, since fiber-spinning lines and precursor plants run capital-intensive. Breakthroughs such as National Renewable Energy Laboratory’s thermoforming route promise 90-95% cost savings for recyclable carbon sheets, yet commercial deployment will require multi-year qualification campaigns[2]National Renewable Energy Laboratory, “Recyclable Carbon Fiber Composites Made Greener With Thermoforming,” nrel.gov. Until raw-material prices drop or design engineers capture superior system-level savings, many potential adopters may defer high-volume substitution.
Challenges in Recycling Composite Materials
Roughly 12 000 t of recyclable carbon fiber will flow out of retired aircraft in 2025, swelling an already complex waste stream. Thermoset matrices resist remelting because of cross-linked chemistries, forcing recyclers to rely on pyrolysis, solvolysis or grinding, each degrading mechanical properties. Wind-energy stakeholders anticipate parallel issues as first-generation turbine blades reach end of life; Europe alone is forecast to accumulate thousands of composite blades annually by 2030. Regulatory frameworks are tightening landfill bans, accelerating the hunt for circular routes such as cement-kiln co-processing, resin re-polymerisation and thermoplastic blade redesigns. Technological scale-up remains nascent, making recycling an enduring drag on the composites market growth trajectory until cost-competitive, high-quality secondary fiber streams emerge.
*Our forecasts treat driver/restraint impacts as directional, not additive. The impact forecasts reflect baseline growth, mix effects, and variable interactions.
Segment Analysis
By Matrix Material: Polymer Grades Dominate While Ceramics Gain Altitude
Polymer matrix composites (PMCs) delivered 55.62% of 2025 revenue, reinforcing the composites market as the preferred option for balanced performance and manufacturability. Thermoset epoxies remain mainstream in aerospace, marine and wind blades, yet recyclable thermoplastics are steadily eroding share in automotive and consumer goods. Commercial thermoplastic UD-tape lines now exceed 1 m wide, favouring high-throughput press forming for battery trays and seat structures. In parallel, the composites market size attributable to ceramic matrix composites is projected to post an 8.12% CAGR between 2026 and 2031, propelled by aerospace propulsion and concentrated solar-power receivers.
CMCs withstand more than 1 600 °C, replacing nickel super-alloys and slashing cooling demands, thereby unlocking unrivalled thermal efficiencies. Investment outlays are significant, but once quiver production stabilises, their life-cycle value proposition offsets initial premiums through weight savings, fuel burn reductions and lower maintenance. Metal matrix composites occupy a smaller niche that thrives on extraordinary thermal conductivity and wear resistance for electronic substrate carriers and brake rotors. Additive-manufacturing pathways and five-axis CNC finishing are broadening design envelopes, hinting at incremental penetration in the latter half of the decade.


By Reinforcement Fiber: Glass Rules, Carbon Climbs and Bio Fibers Emerge
Glass fiber retained a 54.63% share of 2025 volume across the composites market, thanks to its favorable cost-to-strength ratio, corrosion immunity and electrical insulation. Innovations in low-alkali E-glass formulations have delivered modulus enhancements without meaningful price inflation, solidifying its foothold in construction rebars, boat hulls and electrical enclosures. Carbon fiber continues to scale, capturing premium demand in aerospace skins, wind-turbine spars and performance sport goods where 60% weight reductions reward end-users with tangible efficiency gains. The composites market size for higher-tensile 24k and 60k carbon tows is expanding quickly as automotive and energy customers validate mid-modulus grades.
Natural and bio-based fibers—hemp, kenaf, flax and bamboo—register the fastest growth at a 6.83% CAGR, stimulated by OEM sustainability pledges and regulatory mandates for renewable content. Hybrid fabrics interlacing natural yarns with glass rovings are mitigating historical deficits in moisture uptake and dimensional stability, extending bio fiber reach into door panels, rear shelves and acoustic headliners. Research on silane coupling agents and nano-cellulose coatings promises further property convergence between bio and engineered fibers.
By End-Use Industry: Aerospace Dominance and Wind-Energy Momentum
Aerospace and defense consumed 34.72% of composites market volume in 2025, cementing its status as the value driver for high-modulus carbon grades. Wide-body programs exploit composite fuselage barrels that cut fastener counts and deliver better fatigue performance than aluminum-lithium rivals. Regional jet and eVTOL developers replicate this design philosophy to reconcile payload limits with battery mass. Wind energy, conversely, is the fastest-growing end-use, as governments target net-zero grids by mid-century.
Blades represent up to 70% of a turbine’s composite weight, with each 15 MW offshore unit requiring more than 100 t of laminates. Automotive and transportation sectors leverage composites to offset battery weight, enhance crash energy absorption and dampen vibration; applications range from structural flooring to side-impact beams. Pressure-resistant thermoplastic composite pipes attract oil-and-gas operators seeking corrosion immunity and reduced installation costs in sour environments. Civil engineers adopt FRP bars, stay cables and bridge panels to address chronic reinforcement corrosion in coastal regions, anchoring long-term durability advantages.
Geography Analysis
Asia-Pacific anchors the composites market with 44.85% revenue in 2025 and is projected to grow at 7.45% through 2031 as China escalates offshore wind installations, India expands metro rail networks and Southeast Asia upgrades grid infrastructure. The regional composites market size also benefits from escalating carbon-fiber capacity; South Korea’s Hyosung is lifting annual output to 9 000 t to meet aerospace and hydrogen-tank demand. Japan’s value chain focuses on high-precision tow spreading and prepreg technologies, serving both domestic air-frame programs and export customers.
North America trails closely, propelled by sustained aerospace deliveries, federal investments in renewable energy and a resurgent recreational-marine segment. The United States Department of Energy earmarked USD 20 million to advance wind-turbine composite recycling, signalling policy momentum toward circularity. Canadian provinces sponsor advanced-materials clusters that couple academic R&D with injection over-molding pilot lines, aiming to retain domestic IP around bio-based thermoplastics.
Europe commands sophisticated design capabilities and stringent environmental regulations that foster rapid adoption of bio-resins and closed-loop processes. Although supply-chain disruptions and energy-cost spikes trimmed production in late-2024, the bloc maintains a 21.74% share of global volumes. Initiatives such as Vestas’s circular blades and low-emission towers illustrate how EU climate policy is steering OEM priorities toward holistic sustainability. Eastern European nations, leveraging skilled labor and proximity to Western markets, are courting investment in pultrusion and filament-winding plants.
South America and the Middle East & Africa, while collectively smaller, are registering outsized percentage gains as infrastructure modernization and desalination projects specify composite solutions. Brazilian wind corridors, Saudi desalination brine lines and South African electric-bus bodies are notable demand pockets. Technology transfer from multinational players, combined with local reinforcement supply (sisal, jute), is catalysing indigenous innovation and gradually narrowing cost gaps with imported parts.

Competitive Landscape
The composites market is fragmented, with global leaders integrating fiber production, fabric manufacturing, and part fabrication to streamline raw material access and certification timelines. Mergers and acquisitions, such as Owens Corning’s USD 755 million divestiture of its glass-reinforcements business to Praana Group, drive scale and portfolio realignment. SGL Carbon’s 2025 restructuring of its Carbon Fibers unit highlights wind sector demand volatility and high capital requirements. Technology investments in automation, resin infusion, and rapid-cycle materials, like Toray’s acquisition of Gordon Plastics’ assets, enhance competitiveness. Companies like Syensqo focus on thermoplastic innovations to capture OEM value. Sustainability is a key growth area, with start-ups like Pond Biomaterials and Composite Recycling advancing bio-based resins and fiber recovery. Collaborations on self-healing and multifunctional laminates, alongside intellectual property in nano-fillers and graphene coatings, are expected to strengthen pricing power and raise entry barriers despite rising demand.
Composite Material Industry Leaders
Owens Corning
Hexcel Corporation
Mitsubishi Chemical Group Corporation.
Syensqo
Toray Industries, Inc.
- *Disclaimer: Major Players sorted in no particular order

Recent Industry Developments
- June 2025: Flying Whales (FLWH) and Hexcel Corporation have partnered to develop advanced airship structures using Hexcel’s HexTow IMA Carbon Fiber, known for its cost-efficiency and superior mechanical properties, to support the transition to a low-carbon economy, leveraging Hexcel’s expertise in aerospace composite materials for innovative and reliable solutions.
- November 2024: Toray Industries Inc. has expanded its thermoplastic composite materials portfolio by acquiring Gordon Plastics’ assets in Colorado, including a 47,000 sq. ft. facility. This move enhances Toray’s production capacity, R&D capabilities, and polymer processing expertise, with Gordon Plastics’ experienced team joining to support market growth.


Global Composite Material Market Report Scope
Composite materials are made by combining two or more materials with different properties without blending or dissolving them into each other. The global composite material market is segmented by matrix material, reinforcement fiber, end-use application, and geography. By matrix material, the market is segmented by polymer matrix composites(thermoset resins, thermoplastic resins), ceramic/carbon matrix composites, and other matrices(metal matrice composites). On the basis of reinforcement fiber, the market is segmented by glass fiber, carbon fiber, aramid fiber, and others. Similarly, by end-use application, the market is segmented into automotive and transportation, wind energy, aerospace and defense, pipes and tanks, electrical and electronics, sports and recreation, and other end-use applications. The report also offers market size and forecasts for 27 countries across major regions. For each segment, market sizing and forecasts have been done on the basis of revenue (USD).
| Polymer Matrix Composites (PMC) | Thermoset Resins |
| Thermoplastic Resins | |
| Ceramic/Carbon Matrix Composites (CMCs) | |
| Other Matrices (Metal Matrix Composites) |
| Glass Fiber |
| Carbon Fiber |
| Aramid Fiber |
| Other Fibers (Natural/Bio Fiber) |
| Automotive and Transportation |
| Wind Energy |
| Aerospace and Defense |
| Pipes and Tanks |
| Construction |
| Electrical and Electronics |
| Sports and Recreation |
| Other End user Industries (Healthcare, Marine, etc.) |
| Asia-Pacific | China |
| India | |
| Japan | |
| South Korea | |
| Thailand | |
| Malaysia | |
| Indonesia | |
| Vietnam | |
| Rest of Asia-Pacific | |
| North America | United States |
| Canada | |
| Mexico | |
| Europe | Germany |
| United Kingdom | |
| France | |
| Italy | |
| Spain | |
| Russia | |
| NORDIC Countries | |
| Turkey | |
| Rest of Europe | |
| South America | Brazil |
| Argentina | |
| Colombia | |
| Rest of South America | |
| Middle East and Africa | Saudi Arabia |
| South Africa | |
| Nigeria | |
| Qatar | |
| Egypt | |
| United Arab Emirates | |
| Rest of Middle-East and Africa |
| By Matrix Material | Polymer Matrix Composites (PMC) | Thermoset Resins |
| Thermoplastic Resins | ||
| Ceramic/Carbon Matrix Composites (CMCs) | ||
| Other Matrices (Metal Matrix Composites) | ||
| By Reinforcement Fiber | Glass Fiber | |
| Carbon Fiber | ||
| Aramid Fiber | ||
| Other Fibers (Natural/Bio Fiber) | ||
| By End-use Industry | Automotive and Transportation | |
| Wind Energy | ||
| Aerospace and Defense | ||
| Pipes and Tanks | ||
| Construction | ||
| Electrical and Electronics | ||
| Sports and Recreation | ||
| Other End user Industries (Healthcare, Marine, etc.) | ||
| By Geography | Asia-Pacific | China |
| India | ||
| Japan | ||
| South Korea | ||
| Thailand | ||
| Malaysia | ||
| Indonesia | ||
| Vietnam | ||
| Rest of Asia-Pacific | ||
| North America | United States | |
| Canada | ||
| Mexico | ||
| Europe | Germany | |
| United Kingdom | ||
| France | ||
| Italy | ||
| Spain | ||
| Russia | ||
| NORDIC Countries | ||
| Turkey | ||
| Rest of Europe | ||
| South America | Brazil | |
| Argentina | ||
| Colombia | ||
| Rest of South America | ||
| Middle East and Africa | Saudi Arabia | |
| South Africa | ||
| Nigeria | ||
| Qatar | ||
| Egypt | ||
| United Arab Emirates | ||
| Rest of Middle-East and Africa | ||


Key Questions Answered in the Report
What is the current size of the composites market?
The composites market is valued at USD 70.94 billion in 2026 and is projected to reach USD 89.93 billion by 2031.
Which region holds the largest share of composites consumption?
Asia-Pacific leads with 44.85% of global revenue and is also the fastest-growing region at a 7.45% CAGR through 2031.
Why are ceramic matrix composites (CMCs) attracting attention?
CMCs can operate above 1 600 °C, enabling lighter, more efficient jet-engine and energy-system components and are forecast to expand at an 8.12% CAGR.
What is the main obstacle to broader composites adoption?
High material cost and limited large-scale recycling options remain the primary challenges constraining wider penetration into cost-sensitive sectors.
Which manufacturing processes are becoming mainstream in automotive composites?
Rapid-cycle thermoplastic techniques such as automated tape laying, compression molding and injection over-molding are now aligning with mass-production takt times.
Page last updated on:


