North America Ready To Drink Tea Market Size and Share
Market Overview
| Study Period | 2021 - 2031 |
|---|---|
| Forecast Data Period | 2026 - 2031 |
| Historical Data Period | 2021 - 2024 |
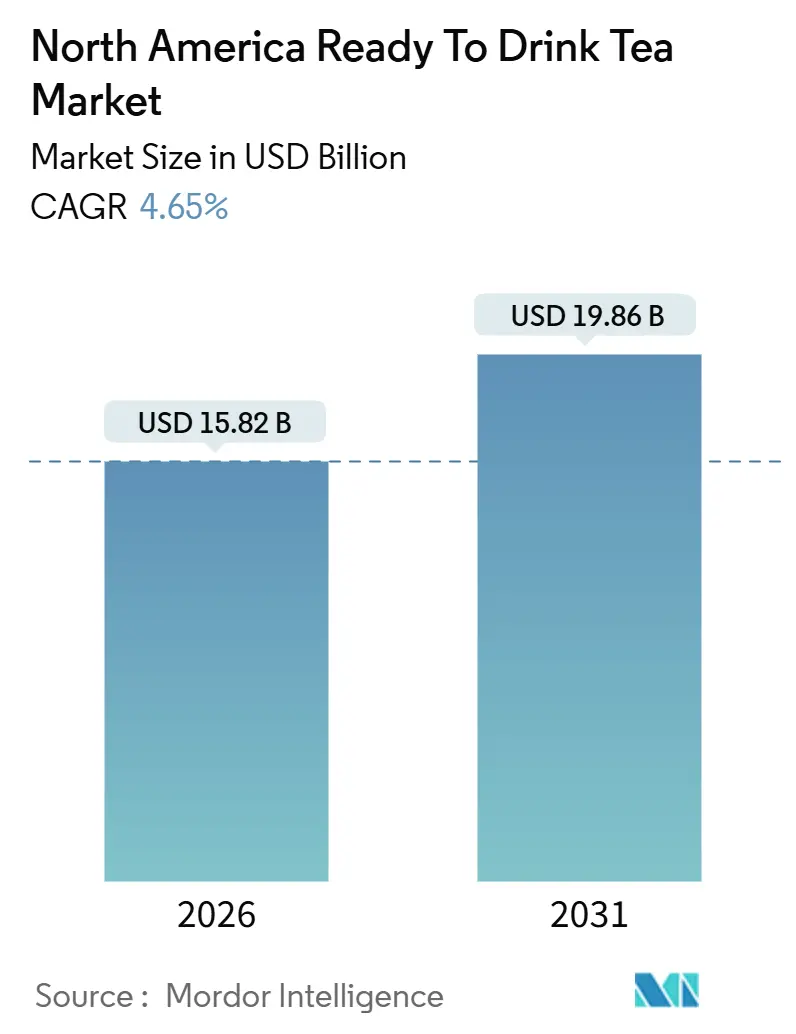
| Market Size (2026) | USD 15.82 Billion |
| Market Size (2031) | USD 19.86 Billion |
| Growth Rate (2026 - 2031) | 4.65% CAGR |
| Market Concentration | Medium |
Major Players
*Disclaimer: Major Players sorted in no particular order Image © Mordor Intelligence. Reuse requires attribution under CC BY 4.0. |
|
North America Ready To Drink Tea Market Analysis by Mordor Intelligence
The North American ready-to-drink tea market reached USD 15.82 billion in 2026 and is expected to grow to USD 19.86 billion by 2031, at a CAGR of 4.65%. This growth highlights a clear consumer preference for beverages that are lower in calories and offer functional benefits, positioning tea as both a wellness product and a convenient refreshment option. The market's progress is driven by clean-label reformulations, the introduction of zero-sugar products, and improvements in sustainable packaging. Established companies are focusing on flavor innovations and functional ingredients to maintain their shelf presence, while emerging startups are leveraging digital sales channels to avoid slotting fees. However, stricter regulations on sugar content and labeling are prompting brands to revise recipes and enhance transparency, which, while adding costs, also creates opportunities for differentiation in a compliant market environment.
Key Report Takeaways
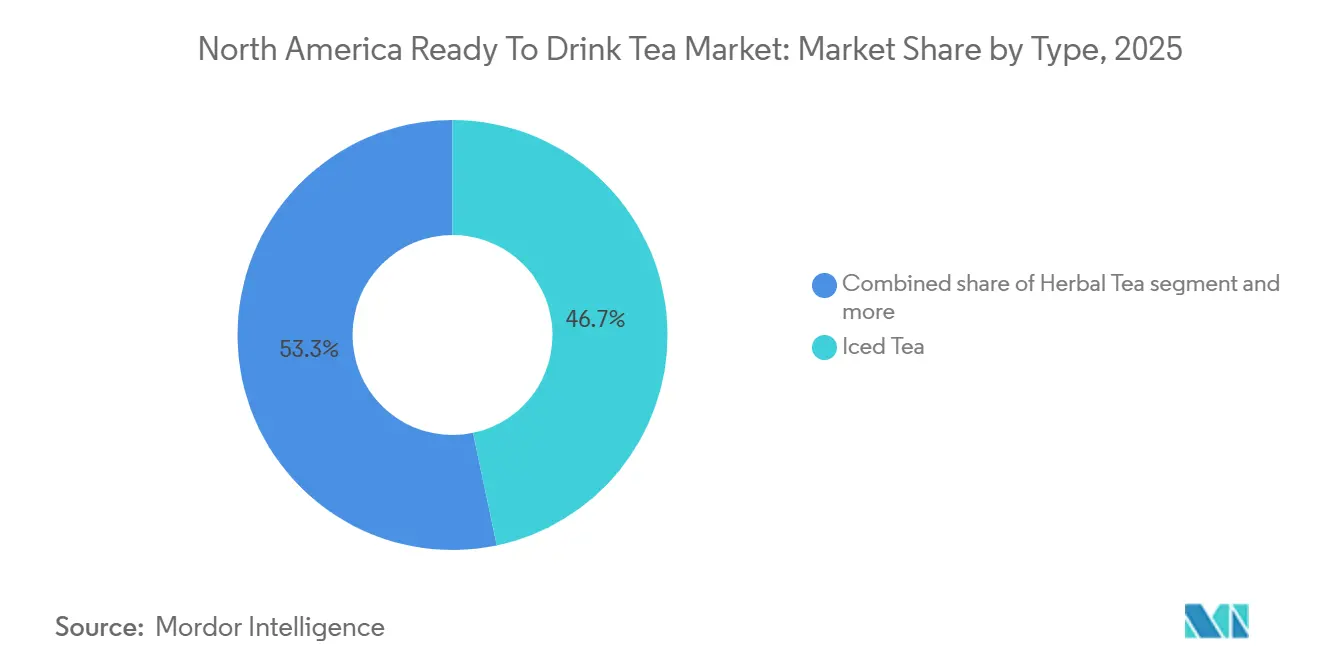
- By type, iced tea led with 46.71% of the North America ready-to-drink tea market share in 2025, and herbal variants are forecast to advance at a 6.57% CAGR through 2031.
- By packaging, PET bottles commanded 77.01% share of the North America ready to drink tea market size in 2025, whereas glass bottles are projected to grow at 6.14% between 2026 and 2031.
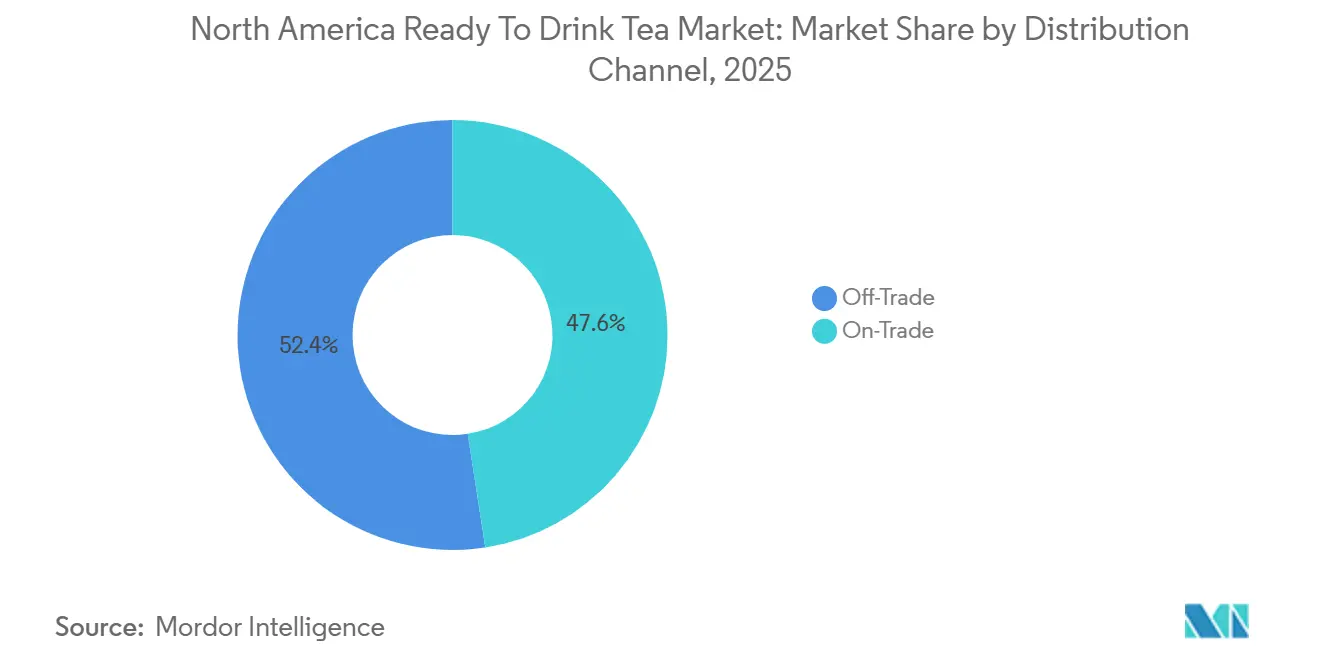
- By distribution channel, off-trade accounted for 52.43% revenue share in 2025, yet on-trade is expected to register a 5.24% CAGR to 2031.
- By geography, the United States held 86.28% of the North American ready-to-drink tea market size in 2025, while Mexico is poised for a 5.89% CAGR over the forecast period.
Note: Market size and forecast figures in this report are generated using Mordor Intelligence’s proprietary estimation framework, updated with the latest available data and insights as of January 2026.
North America Ready To Drink Tea Market Trends and Insights
Drivers Impact Analysis*
| Driver | (~) % Impact on CAGR Forecast | Geographic Relevance | Impact Timeline |
|---|---|---|---|
| Rising consumer preference for healthier beverage alternatives | +1.2% | United States and Canada, with spillover to Mexico | Medium term (2-4 years) |
| Popularity of low-sugar and sugar-free formulations amid wellness trends | +0.9% | United States, Canada, urban Mexico | Short term (≤ 2 years) |
| Expansion of flavored and innovative product varieties | +0.7% | United States, Canada | Medium term (2-4 years) |
| Growth in plant-based and clean-label demand | +0.6% | United States, Canada, select urban centers in Mexico | Long term (≥ 4 years) |
| Rising demand for functional beverages | +0.8% | United States, Canada | Medium term (2-4 years) |
| Influence of celebrity endorsements and social media marketing | +0.5% | United States, Canada, Mexico | Short term (≤ 2 years) |
| Source: Mordor Intelligence | |||


Rising consumer preference for healthier beverage alternatives
In recent years, a significant number of North American consumers are actively reducing their sugar intake. This shift underscores a broader trend: health-conscious individuals are increasingly replacing carbonated soft drinks with tea-based beverages, perceiving them as lower-calorie options that offer hydration and functional benefits. Ready-to-drink tea, praised for its antioxidants, polyphenols, and natural appeal, finds itself in a favorable position when compared to artificially sweetened sodas. However, the growth of this category hinges on maintaining its health-centric image while also catering to mainstream taste preferences that lean towards sweetness. Brands that veer too much towards bitterness or astringency risk distancing themselves from casual drinkers who desire wellness without compromise. Herbal and green tea variants have adeptly navigated the balance between authenticity and accessibility, a challenge that traditional black tea formulations grapple with.
Growth in plant-based and clean-label demand
Consumers increasingly prefer plant-based and clean-label products, driven by a desire for transparency in ingredient sourcing [3]Source: Plant Based Foods Association "Plant-Based Foods State of the Marketplace Report," plantbasedfoods.org. This trend has led to greater scrutiny of flavor agents, preservatives, and colorants, with shoppers favoring simple ingredient lists featuring familiar components. Tea naturally aligns with plant-based values, but brands risk losing this advantage by using artificial preservatives or unclear natural flavors that may raise doubts. Clean-label certifications from independent organizations enhance credibility but add costs and complexities to supply chains. The growing preference for organic tea leaves and non-genetically modified organism (non-GMO) sweeteners highlights a willingness to pay more for perceived purity, benefiting smaller brands with authentic stories over larger competitors. However, scaling clean-label production while maintaining shelf stability remains a challenge, as natural preservatives often fall short compared to synthetic options. Brands that address this issue through cold-chain logistics or aseptic packaging are well-positioned to lead in the premium segment.
Rising demand for functional beverages
Tea is shifting from being a simple refreshment to a wellness-focused beverage, driven by the inclusion of adaptogens, probiotics, and nootropics. Consumers increasingly view drinks as tools to support health, using functional beverages to address challenges like stress, sleep issues, and mental fatigue. Tea's mild flavor effectively masks the bitterness of these ingredients, making it a preferred choice over water-based options. Established brands like Ito En and newer entrants are incorporating ingredients such as ashwagandha, reishi mushroom, and L-theanine, positioning their products as solutions for stress relief and improved focus, appealing to professionals and wellness-conscious individuals. However, the regulatory environment, particularly the Food and Drug Administration's restrictions on health claims without clinical evidence, adds complexity. This forces brands to highlight ingredients rather than make direct promises. Companies with resources to validate ingredient efficacy hold an advantage, while smaller startups face challenges. The functional-tea market is expected to see consolidation as larger players acquire emerging brands to leverage their formulations and customer bases.
Popularity of low-sugar and sugar-free formulations amid wellness trends
In recent years, consumers have become increasingly vigilant about nutrition labels due to growing awareness of metabolic health and diabetes prevention, driving a surge in zero-sugar and reduced-sugar teas. Earlier this year, PepsiCo and Unilever introduced "Pure Leaf Zero Sugar," utilizing stevia and monk fruit to achieve sweetness without adding calories. This approach directly addresses the significant portion of consumers showing interest in zero-sugar options. However, while natural sweeteners face aftertaste challenges that some demographics reject, the market has become divided. Traditional sweet tea continues to enjoy strong loyalty in the southern United States, while coastal urban centers are gravitating toward unsweetened or lightly sweetened teas. Regulatory changes are further accelerating this trend, as the Food and Drug Administration's updated labeling requirements now mandate clear disclosure of added sugars, reducing the appeal of high-sugar products on crowded retail shelves [1]Source: United States Food and Drug Administration "How to Submit Label Claim Petitions & Notifications," fda.gov. Brands that excel in delivering great taste without sugar are well-positioned to attract health-conscious millennials and Generation Z, who place a high priority on ingredient transparency.
Restraints Impact Analysis*
| Restraint | (~) % Impact on CAGR Forecast | Geographic Relevance | Impact Timeline |
|---|---|---|---|
| High competition from other ready-to-drink beverages | -0.8% | United States, Canada, Mexico | Short term (≤ 2 years) |
| Regulatory scrutiny on labeling and health claims | -0.5% | United States, Canada | Medium term (2-4 years) |
| Consumer skepticism toward artificial flavors or additives | -0.4% | United States, Canada | Medium term (2-4 years) |
| Sugar content concerns in traditional iced teas | -0.3% | United States, Canada | Short term (≤ 2 years) |
| Source: Mordor Intelligence | |||
Regulatory scrutiny on labeling and health claims
The Food and Drug Administration (FDA) has laid stricter labeling rules, requiring clear disclosures on added sugars and restricting the use of terms like "healthy" and "natural" without proper evidence. These changes have increased compliance costs and extended reformulation timelines for tea manufacturers. Brands promoting benefits like antioxidants or metabolic support must now provide clinical evidence to substantiate their claims or face regulatory actions, which is particularly challenging for smaller companies. While these measures aim to prevent misleading marketing, they also raise barriers to innovation by increasing the cost of launching new functional products. Companies with strong regulatory expertise and research partnerships are better positioned to adapt, gaining a competitive edge with validated claims. The FDA is also closely monitoring ingredient sourcing, focusing on pesticide residues and contaminants in imported tea leaves, especially from regions with less stringent agricultural practices. Brands investing in supply-chain transparency and third-party testing reduce regulatory risks and build consumer trust, though these efforts can pressure profit margins in a competitive market.
Consumer skepticism toward artificial flavors or additives
Consumers are rejecting artificial flavors, colors, and preservatives, viewing them as signs of low-quality or unhealthy products. This shift, driven by greater ingredient awareness and mobile apps that decode labels, is forcing brands to reformulate or risk irrelevance. Tea brands using artificial flavors face criticism from clean-label advocates demanding natural extracts or essential oils, despite higher costs and shorter shelf life. Preservatives like sodium benzoate, while extending product life, are linked to processed food concerns. Natural preservation methods, such as high-pressure processing or aseptic packaging, require significant investment, favoring larger, well-funded players. Transparency is now a key competitive advantage, but brands must balance openness with simplicity to avoid overwhelming consumers.
*Our forecasts treat driver/restraint impacts as directional, not additive. The impact forecasts reflect baseline growth, mix effects, and variable interactions.
Segment Analysis
By Type: Herbal Variants Capture Wellness Momentum
From 2026 to 2031, the herbal tea market is expected to grow at an annual rate of 6.57%, surpassing the overall market growth. This increase is fueled by consumers seeking caffeine-free options that offer functional benefits such as stress relief, sleep support, and digestive health. Chamomile, peppermint, and hibiscus remain dominant in this segment, but brands are increasingly incorporating adaptogens like ashwagandha and reishi mushroom to stand out and justify premium pricing. The appeal of herbal tea has expanded beyond wellness enthusiasts to include mainstream consumers who perceive it as a natural and safe alternative to pharmaceutical sleep aids and anxiety medications. Brands reinforce this perception through thoughtful packaging designs and ingredient-focused messaging.
Green tea continues to attract health-conscious millennials, drawn by its antioxidant properties and matcha-infused variants that convey a sense of sophistication. However, as the segment matures, its growth is beginning to moderate. In 2025, iced tea accounted for 46.71% of the market share, supported by legacy brands such as Lipton and Arizona, which benefit from well-established distribution networks and strong brand recognition. Despite this, the segment faces challenges, including growing concerns about sugar content and competition from flavored sparkling waters. Additionally, the "Other Ready to Drink Tea" category, which includes oolong and white tea varieties, remains niche but offers opportunities for premiumization. Brands are targeting tea connoisseurs willing to pay higher prices for artisanal sourcing and exclusive limited-edition products.


By Packaging Type: Glass Bottles Signal Premium Positioning
Glass bottles are expected to grow at a rate of 6.14% from 2026 to 2031. This growth is driven by sustainability narratives and consumer perceptions of purity and quality, which support premium pricing. Brands such as Honest Tea and Ito En are leveraging glass bottles to differentiate their products on shelves. They aim to attract environmentally conscious shoppers who prioritize recyclability over convenience, a preference particularly evident in urban areas with strong recycling infrastructure. However, the weight and fragility of glass limit its use for on-the-go consumption. Instead, it is primarily used in refrigerated retail and foodservice channels where the risk of breakage is more manageable.
In 2025, Polyethylene Terephthalate (PET) bottles accounted for a significant 77.01% market share. Their dominance is due to their cost efficiency, lightweight design, and compatibility with high-speed bottling lines, which enable large-scale distribution. However, PET bottles face increasing criticism for contributing to plastic waste and microplastic contamination. This has prompted brands to incorporate recycled content or explore bio-based alternatives that maintain performance while reducing environmental impact. Metal cans, known for their portability and recyclability, appeal to younger consumers who associate them with craft beverages and modern aesthetics. However, tea's traditional association with natural ingredients sometimes conflicts with the industrial image of aluminum packaging.
By Distribution Channel: On-Trade Gains as Foodservice Recovers
On-Trade channels are expected to grow at a 5.24% CAGR from 2026 to 2031, surpassing Off-Trade channels. This growth is fueled by the expansion of restaurants, cafes, and quick-service chains that are enhancing their tea offerings to capture the afternoon and evening time slots traditionally dominated by coffee and soft drinks. Leading brands like Starbucks, Panera Bread, and Chipotle offer premium tea programs. By leveraging their existing beverage infrastructure, they are able to offer hot and iced tea with minimal additional costs. This strategy addresses the growing consumer demand for non-coffee options and healthier alternatives to sugary fountain drinks, while also positioning tea as a profitable addition that diversifies their menus. However, a key challenge lies in training staff to prepare tea correctly, as errors in steeping temperatures or times can result in bitter or weak beverages, negatively impacting customer satisfaction and repeat purchases. Brands that provide comprehensive solutions, including pre-portioned tea bags, brewing equipment, and staff training, are gaining a significant advantage in the On-Trade channel by simplifying operations for foodservice providers.
In 2025, Off-Trade channels accounted for 52.43% of the market share, primarily driven by Supermarkets and Hypermarkets. These outlets, with their extensive product assortments and promotional pricing, dominate the Off-Trade landscape. However, they face margin pressures due to competition from private-label brands and retailer demands for slotting fees and promotional support. Convenience Stores offer opportunities for impulse purchases of single-serve formats, but their limited shelf space and consumer price sensitivity restrict the ability to position premium products effectively. Online Retail emerged as a key growth driver, enabling niche brands to reach consumers directly without the need for retail distribution negotiations [2]Source: United States Department of Agriculture "Retailing & Wholesaling – Retail Trends," usda.gov. Despite this, high shipping costs and the lack of impulse purchase visibility limit its overall share of total volume.
Geography Analysis
In 2025, the United States led the market, accounting for 86.28% of the total share. This dominance reflects its well-established distribution networks, strong brand equity, and high per-capita consumption. However, as the market matures and competition intensifies, growth rates are slowing. Regional preferences vary significantly, with southern states favoring traditional sweet tea while coastal urban centers increasingly opt for unsweetened and functional variants. To remain competitive, brands must adapt their product assortments and marketing strategies to align with these localized preferences. Similarly, Canada exhibits comparable trends, with health-conscious consumers driving demand for low-sugar and organic options. However, the country's smaller population and market size limit its overall growth potential.
Mexico is projected to be the fastest-growing segment in North America, with a forecasted growth rate of 5.89% from 2026 to 2031. This growth is fueled by rising disposable incomes, urbanization, and the influence of Western beverage trends through multinational retail chains and digital media. The country's traditional preference for carbonated soft drinks is shifting as health awareness grows and government policies, such as sugar taxes and front-of-package warning labels, discourage high-calorie beverages. Ready-to-drink tea benefits from its positioning as a healthier alternative, but brands must address local taste preferences, which favor sweeter profiles compared to the United States and Canada. Educating consumers about tea's flavor profiles remains a challenge, requiring sampling programs and targeted marketing to position tea as a modern, aspirational beverage.
The rest of North America, which includes smaller Caribbean and Central American markets, remains in the early stages of development. These regions offer long-term opportunities as economic growth and retail modernization improve access to packaged beverages. Brands that establish an early presence in these markets through partnerships with local distributors can secure a competitive advantage. However, challenges such as political instability and currency volatility persist, posing risks that larger players are often better equipped to manage.

Competitive Landscape
Success in the ready-to-drink tea market increasingly depends on how well companies align with changing consumer preferences and sustainability requirements. Leading companies are prioritizing investments in sustainable packaging solutions, clean label ingredients, and transparent supply chains to maintain their competitive edge. Additionally, businesses are leveraging digital transformation, including e-commerce capabilities and direct-to-consumer channels, to expand their market reach and strengthen consumer engagement. Developing premium and functional products, along with effective marketing strategies that emphasize health benefits and natural ingredients, has become essential for achieving success in this market.
For new entrants, standing out through unique flavor profiles, innovative packaging, and targeted marketing strategies offers significant opportunities for growth and market entry. Companies must address the growing influence of health-conscious consumers and comply with regulatory requirements related to sugar content and packaging sustainability. Establishing strong partnerships with retailers and distributors while maintaining competitive pricing is critical for gaining traction in the market.
Adapting quickly to shifting consumer preferences and ensuring consistent product quality while managing production costs will be vital for long-term success in the tea market. Businesses that can balance these factors effectively are more likely to sustain growth and remain competitive in this evolving industry.
North America Ready To Drink Tea Industry Leaders
-
PepsiCo, Inc.
-
The Coca-Cola Company
-
Nestlé S.A.
-
Arizona Beverages USA
-
Dr Pepper Snapple Group
- *Disclaimer: Major Players sorted in no particular order

Recent Industry Developments
- August 2025: Keurig Dr Pepper Canada rolled out Nestea RTD in four flavors: Lemon, Peach, Raspberry, and Lemon Zero Sugar, making them available in various formats nationwide. This launch underscores Keurig Dr Pepper Canada's commitment to catering to the rising consumer appetite for convenient, on-the-go beverages.
- September 2024: Twinings unveiled a fresh line of ready-to-drink sparkling teas. This move targets the surging consumer demand for functional beverages that seamlessly blend refreshment with health perks. The new lineup boasts three enticing flavors: Refresh: Juicy Raspberry Lemonade, Defence: Zesty Orange and Passionfruit, and Boost: Zingy Lemon and Ginger.
- August 2024: Lipton Hard Iced Tea broadened its offerings by introducing a new flavor, Citrus Green Tea, in the United States. Echoing Lipton’s beloved RTD profile, the Citrus Green Tea provides a novel twist on traditional iced tea. Crafted with a triple-filtered malt base and brewed green tea, this 5% ABV innovation promises a smooth, refreshing experience, all without carbonation.


North America Ready To Drink Tea Market Report Scope
Ready‑to‑Drink (RTD) tea refers to pre‑prepared, packaged tea beverages that are sold in a ready‑to‑consume liquid form, requiring no brewing, mixing, or additional preparation by the consumer. These beverages are typically made from brewed tea (black, green, herbal, oolong, etc.) and may be sweetened, unsweetened, flavored, carbonated, or fortified with functional ingredients.
The market is segmented by type into green tea, herbal tea, iced tea, and other RTD tea. The market is segmented by packaging type into aseptic packages, glass bottles, metal cans, and PET Bottles. The market is segmented by distribution channel into off-trade and on-trade. The off-trade segment is further segmented into supermarkets/hypermarkets, convenience stores, online retail stores, and other distribution channels. By geography, the market is segmented into Canada, Mexico, the United States, and the Rest of North America. The market sizing has been done in value terms in USD and in volume terms in liters for all the abovementioned segments.
| Green Tea |
| Herbal Tea |
| Iced Tea |
| Other RTD Tea |
| Aseptic packages |
| Glass Bottles |
| Metal Can |
| PET Bottles |
| Off-trade | Convenience Stores |
| Online Retail Stores | |
| Supermarket/Hypermarket | |
| Others | |
| On-trade |
| United States |
| Canada |
| Mexico |
| Rest of North America |
| By Type | Green Tea | |
| Herbal Tea | ||
| Iced Tea | ||
| Other RTD Tea | ||
| By Packaging Type | Aseptic packages | |
| Glass Bottles | ||
| Metal Can | ||
| PET Bottles | ||
| By Distribution Channel | Off-trade | Convenience Stores |
| Online Retail Stores | ||
| Supermarket/Hypermarket | ||
| Others | ||
| On-trade | ||
| By Country | United States | |
| Canada | ||
| Mexico | ||
| Rest of North America | ||


Market Definition
- Carbonated Soft Drinks (CSDs) - Carbonated soft drinks (CSDs) refer to non-alcoholic beverages that are carbonated and typically flavored, containing dissolved carbon dioxide to create effervescence. These beverages commonly include cola, lemon-lime, orange, and various fruit-flavored sodas. Marketed in cans, bottles, or fountain dispense.
- Juices - We have considered packaged juices which encompass non-alcoholic beverages derived from fruits, vegetables, or a combination thereof, processed and sealed in various packaging formats such as bottles, cartons, or pouches. Excluding fresh juices, this market segment involves commercially prepared and preserved juices, often with added preservatives and flavors.
- Ready-to-Drink (RTD) Tea and RTD Coffee - Ready-to-Drink (RTD) tea and RTD coffee are pre-packaged, non-alcoholic beverages that are brewed and prepared for consumption without further dilution. RTD tea typically includes various tea varieties, infused with flavors and sweeteners, and comes in bottles, cans, or cartons. Similarly, RTD coffee involves pre-brewed coffee formulations, often mixed with milk, sugar, or flavorings, and is conveniently packaged for on-the-go consumption.
- Energy Drinks - Energy drinks are non-alcoholic beverages formulated to provide a quick boost of energy and alertness. Whereas, sports drinks are beverages designed to hydrate and replenish electrolytes, particularly after physical exertion, exercise, or intense activity
| Keyword | Definition |
|---|---|
| Carbonated Soft Drinks | Carbonated soft drinks (CSDs) are a combination of carbonated water and flavouring, sweetened by sugar or a non-sugar sweeteners. |
| Standard Cola | Standard Cola is defined as the original flavor of cola soda. |
| Diet Cola | A cola-based soft drink containing no or low amounts of sugar |
| Fruit Flavored Carbonates | A carbonated beverage prepared from fruit juice/fruit flavor with carbonated water and containing sugar, dextrose, invert sugar or liquid glucose either singly or in combination. It may contain peel oil and fruit essences. |
| Juice | Juice is a drink made from the extraction or pressing of the natural liquid contained in fruit and vegetables. |
| 100% Juice | Fruit/vegetable juice made from fruit in the form of its juice with no water added to make up the volume. It is not permitted to add sugars, sweeteners, preservatives, flavourings or colourings to fruit juice. |
| Juice Drinks (up to 24% Juice) | Fruit/vegetable juice drinks with up to 24% fruits/vegetable extract. |
| Nectars (25-99% Juice) | Juices that can have between 25 and 99% of fruit, with the minimum legal limits defined depending on the type of fruit |
| Juice concentrates | Juice Concentrates are those form of juices when most of this liquid is removed resulting in a thick, syrupy product known as juice concentrate. |
| RTD Coffee | Packaged coffee beverages that are sold in a prepared form and are ready for consumption at the time of purchase. |
| Iced Coffee | An iced coffee is a cold version of coffee, usually a combination of hot espresso and milk with ice added to it. |
| Cold Brew Coffee | Cold brew also called cold water extraction or cold pressing is made by steeping ground coffee in room-temperature water for several hours. |
| RTD Tea | Ready-to-drink (RTD) tea is a packaged tea product ready for immediate consumption without brewing or preparation |
| Iced Tea | Ice tea or iced tea is a drink made from tea without milk but with sugar and sometimes fruit flavourings, drunk cold. |
| Green Tea | Green tea is a tea beverage which promotes mental alertness, relieving digestive symptoms and promoting weight loss. |
| Herbal Tea | Herbal tea beverages are made from the infusion or decoction of herbs, spices, or other plant material in hot water. |
| Energy Drink | A type of drink containing stimulant compounds, usually caffeine, which is marketed as providing mental and physical stimulation. They may or may not be carbonated and may also contain sugar, other sweeteners, or herbal extracts, among numerous possible ingredients. |
| Sugar-free or Low-calories Energy Drinks | Sugar-free or Low-calories Energy Drinks are sugar-free, artificially sweetened energy drinks with few or no calories. |
| Traditional Energy Drink | Traditional Energy Drinks are functional soft drinks containing ingredients designed to boost the consumer's energy. |
| Natural/Oraganic Energy Drinks | Natural/Organic energy drinks are energy drinks free of artificial sweeteners and synthetic colorings. Instead, they contain naturally derived ingredients such as green tea, yerba mate, and botanical extracts. |
| Energy Shots | A small but highly concentrated energy drink that contains large amounts of caffeine and/or other stimulants. The quantity is comparatively smaller compared to energy drinks. |
| Sports Drink | Sports drinks are beverages designed specifically for the rapid supply of fluid, carbohydrates, and electrolytes before, during or after exercise. |
| Isotonic | Isotonic drinks contain similar concentrations of salt and sugar as in the human body, and are designed to quickly replace fluids lost during exercise but with an increase of carbohydrate. |
| Hypertonic | Hypertonic drinks have a higher concentration of salt and sugar than the human body. They are best drunk after exercise as it is important to replace glycogen levels quickly after exercise. |
| Hypotonic | Hypotonic drinks are designed to quickly replace fluids lost during exercise. They have very low carbohydrate content and a lower concentration of salt and sugar than the human body. |
| Electrolyte-Enhanced Water | Electrolyte water is water infused with electrically-charged minerals, such as sodium, potassium, calcium, and magnesium. |
| Protein-based Sport Drinks | Protein-based sports drinks are those sports drinks which has added protein in it that will improve performance and reduce muscle protein breakdown. |
| On-Trade | The on-trade refers to places that sell beverages for immediate consumption on the premises like bars, restaurants, and pubs |
| Off-Trade | Off-trade usually means places like liquor stores, supermarkets and other places where you don't consume the beverage right away. |
| Convenience Store | A retail business that provides the public with a convenient location to quickly purchase a wide variety of consumable products and services, generally food and gasoline. |
| Specialty store | A specialty store is a shop/store that carries a deep assortment of brands, styles, or models within a relatively narrow category of goods |
| Online Retail | Online retail is a type of eCommerce whereby a business sells goods or services directly to consumers from a website. |
| Aseptic Packaging | Aseptic packaging refers to the filling of a cold, commercially sterile product under sterile conditions into a presterilized container and closure under sterile conditions to form a seal that effectively excludes microorganisms. These includes tetra packs, cartons, pouches etc. |
| PET Bottle | PET bottle means a bottle made of polyethylene terephthalate. |
| Metal Cans | Metal containers made of aluminum or tin- plated or zinc-plated steel, which are commonly used for packaging food, beverages or other products. |
| Disposable Cups | Disposable Cup means a cup or other container designed for single use to serve beverages, such as water, cold drinks, hot drinks and alcoholic beverages. |
| Gen Z | A way of referring to the group of people who were born in the late 1990s and early 2000s. |
| Millenial | Anyone born between 1981 and 1996 (ages 23 to 38 in 2019) is considered a Millennial |
| Taurine | Taurine is an amino acid that supports immune health and nervous system function. |
| Bars & Pubs | It is a drinking establishment licensed to serve alcoholic drinks for consumption on the premises. |
| Café | It is a foodservice establishment serving refreshments (mainly coffee) and light meals. |
| On the go | It means doing / dealing with while busily engaged with something and not diverting plans in order to accommodate. |
| Internet Penetration | The Internet Penetration Rate corresponds to the percentage of the total population of a given country or region that uses the Internet. |
| Vending Machine | A machine that dispenses small articles such as food, drinks, or cigarettes when a coin or token is inserted |
| Discount store | A discount store or discounter offers a retail format in which products are sold at prices that are in principle lower than an actual or supposed "full retail price". Discounters rely on bulk purchasing and efficient distribution to keep down costs. |
| Clean Label | Clean label on the beverage market are drinks that are made from few ingredients of natural origin and are not or only slightly processed. |
| Caffeine | An alkaloid compound which is a stimulant of the central nervous system. It is mainly used recreationally, as a mild cognitive enhancer to increase alertness and attentional performance. |
| Extreme sport | Action sports, adventure sports or extreme sports are activities perceived as involving a high degree of risk. |
| High-intensity interval training | It incorporates several rounds that alternate between several minutes of high intensity movements to significantly increase the heart rate to at least 80% of one's maximum heart rate, followed by short periods of lower intensity movements. |
| Shelf life | The length of time for which an item remains usable, fit for consumption, or saleable. |
| Cream Soda | Cream soda is a sweet soft drink. Generally flavored with vanilla and based on the taste of an ice cream float |
| Root Beer | Root beer is a sweet North American soft drink traditionally made using the root bark of the sassafras tree Sassafras albidum or the vine of Smilax ornata as the primary flavor. Root beer is typically, but not exclusively, non-alcoholic, caffeine-free, sweet, and carbonated. |
| Vanilla Soda | A carbonated soft drink flavoured with vanilla. |
| Dairy-Free | A product that does not contain any milk or milk products from cows, sheep or goats. |
| Caffeine-Free Energy Drinks | Caffeine-free energy drinks rely on other ingredients to boost the energy. Popular choices include amino acids, B vitamins, and electrolytes. |


Research Methodology
Mordor Intelligence follows a four-step methodology in all our reports.
- Step-1: IDENTIFY KEY VARIABLES: In order to build a robust forecasting methodology, the variables and factors identified in Step 1 are tested against available historical market numbers. Through an iterative process, the variables required for market forecast are set, and the model is built on the basis of these variables.
- Step-2: Build a Market Model: Market-size estimations for the forecast years are in nominal terms. Inflation is not a part of the pricing, and the average selling price (ASP) is kept constant throughout the forecast period for each country.
- Step-3: Validate and Finalize: In this important step, all market numbers, variables, and analyst calls are validated through an extensive network of primary research experts from the market studied. The respondents are selected across levels and functions to generate a holistic picture of the market studied.
- Step-4: Research Outputs: Syndicated reports, custom consulting assignments, databases & subscription platforms


