Market Overview
| Study Period | 2021 - 2031 |
|---|---|
| Forecast Data Period | 2026 - 2031 |
| Historical Data Period | 2021 - 2024 |
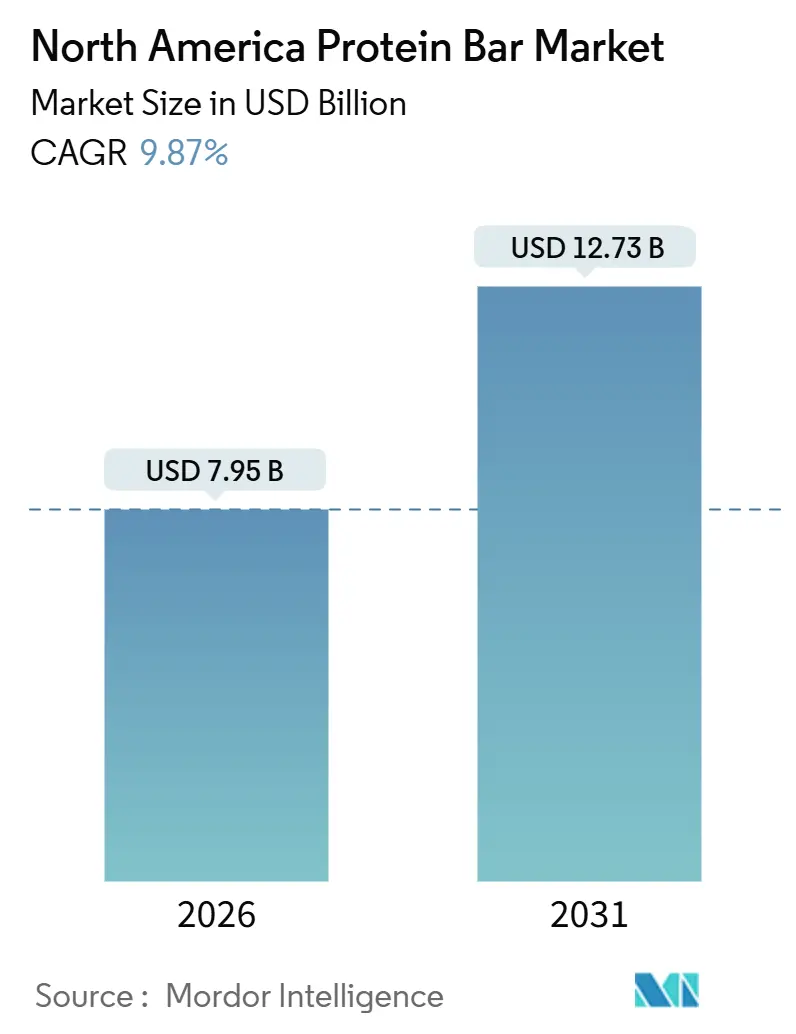
| Market Size (2026) | USD 7.95 Billion |
| Market Size (2031) | USD 12.73 Billion |
| Growth Rate (2026 - 2031) | 9.87% CAGR |
| Market Concentration | Medium |
Major Players *Disclaimer: Major Players sorted in no particular order Image © Mordor Intelligence. Reuse requires attribution under CC BY 4.0. | |
North America Protein Bar Market Analysis by Mordor Intelligence
The North America protein bar market size stands at USD 7.95 billion in 2026 and is projected to reach USD 12.73 billion by 2031, reflecting a CAGR of 9.87%. As consumer preferences evolve, product development has pivoted from traditional whey-centric recipes to embrace pea, rice, and hybrid plant proteins, catering to the rising flexitarian and vegan demographics. Highlighting the importance of transparency, 89% of consumers in the region snack regularly, with 43% opting for protein-fortified choices, as reported by the International Food Information Council. The market has seen a shift, with keto-friendly bars now infused with adaptogens, probiotics, and collagen, moving the focus from mere satiety to enhanced wellness benefits. Digital platforms, especially online retail and subscription models, have intensified consumer engagement. Simultaneously, workplace micro-markets have emerged as a reliable sales avenue. Premium products, often featuring functional ingredients, not only command a higher price but also provide a buffer against the fluctuating costs of proteins and nuts.
Key Report Takeaways
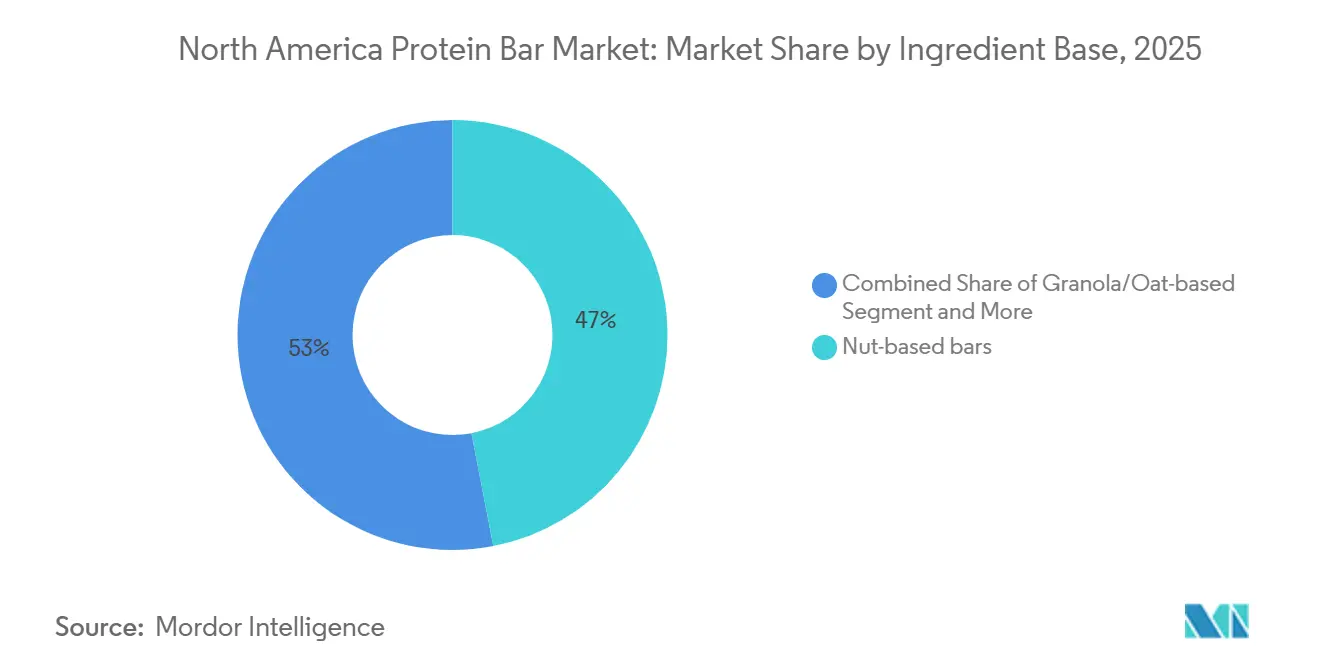
- By ingredient base, nut bars led with 46.96% of the North America protein bar market share in 2025; granola and oat formulations are expanding at a 10.80% CAGR through 2031.
- By protein source, animal-based bars held 69.74% share of the North America protein bar market size in 2025, yet plant-based offerings are accelerating at an 11.93% CAGR.
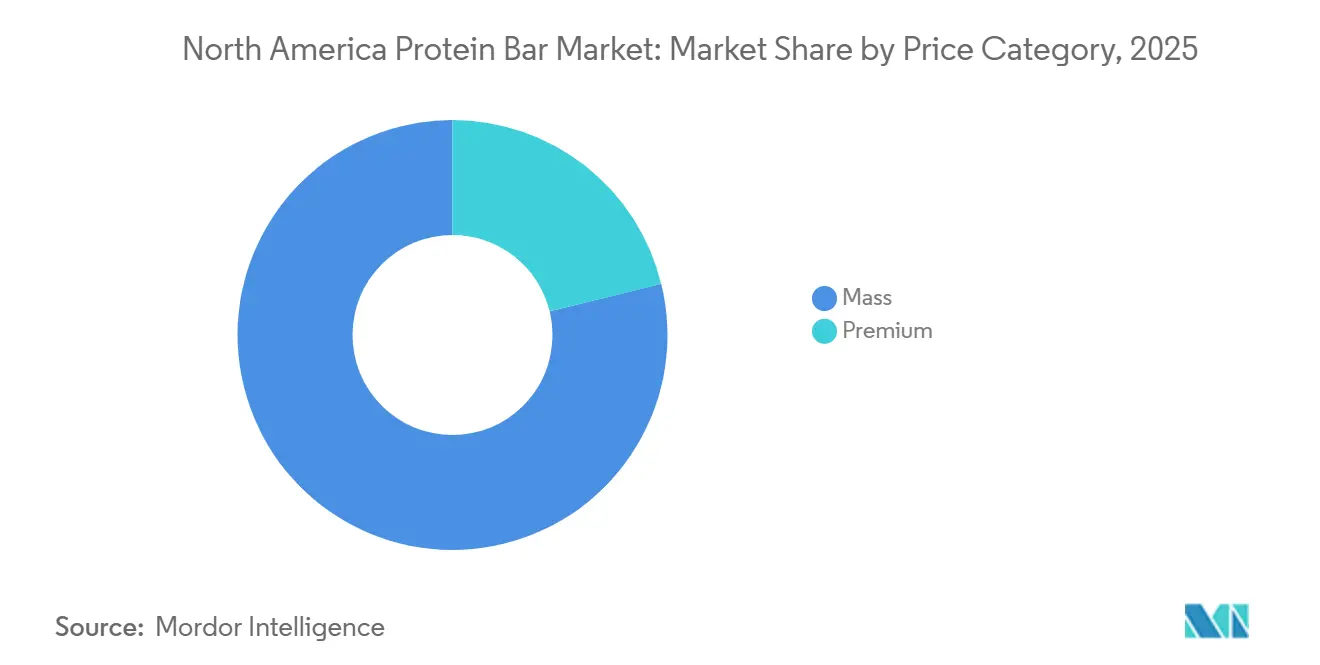
- By price tier, premium products accounted for 21.18% share of the North America protein bar market size in 2025 and are advancing at an 11.78% CAGR.
- By distribution channel, supermarkets and hypermarkets captured 42.57% of the North America protein bar market share in 2025, while online retail is rising at a 12.36% CAGR.
Note: Market size and forecast figures in this report are generated using Mordor Intelligence’s proprietary estimation framework, updated with the latest available data and insights as of January 2026.
North America Protein Bar Market Trends and Insights
Drivers Impact Analysis*
| Driver | (~) % Impact on CAGR Forecast | Geographic Relevance | Impact Timeline |
|---|---|---|---|
| Rising health-conscious snacking culture | +2.1% | North America-wide, with the strongest uptake in urban United States and Canadian metropolitan areas | Medium term (2-4 years) |
| Growing fitness and sports participation | +1.8% | The United States leads, with emerging growth in Canadian provinces and Mexico's urban centers | Long term (≥ 4 years) |
| Clean-label and plant-based product innovation | +1.9% | Global, with North America as the primary innovation hub for ingredient technology | Medium term (2-4 years) |
| Corporate wellness vending initiatives | +1.2% | The United States corporate sector, expanding into Canada's large employers | Short term (≤ 2 years) |
| Subscription D2C models boosting repeat sales | +1.4% | The United States and Canada, limited penetration in Mexico due to the payment infrastructure | Short term (≤ 2 years) |
| Cross-border e-commerce flow within USMCA | +0.9% | USMCA member states, particularly the United States-Canada corridor | Medium term (2-4 years) |
| Source: Mordor Intelligence | |||


Rising health-conscious snacking culture
According to the International Food Information Council, snacking frequency has hit structural highs, with 48.8% of North Americans indulging 3 or more times daily[1]Source: International Food Information Council, “2024 Food & Health Survey,” foodinsight.org. Protein bars are seizing this opportunity, offering 10-20 grams of protein in portable formats that easily fit into desk drawers and gym bags. This positions them as competitors to traditional meals, rather than just candy bars. The trend is notably generational: Millennials and Gen Z now perceive protein bars as functional nutrition, not mere indulgence. This perspective not only justifies premium pricing but also shields brands from cuts in discretionary spending during economic downturns. Following clean-label ingredients, protein fortification emerges as the second-most-desired attribute, underscoring the category's sweet spot at the crossroads of convenience and health. Brands emphasizing messaging around satiety and sustained energy, instead of weight loss, are reaping the rewards. These brands are attracting repeat buyers who seamlessly integrate bars into their daily routines, resulting in steady revenue streams that mitigate seasonal fluctuations.
Growing fitness and sports participation
According to the International Health, Racquet and Sportsclub Association, gym memberships and attendance at boutique fitness classes surged past previous highs by mid-2024, setting the stage for a booming market in post-workout nutrition products. Protein bars, once confined to niche sports nutrition outlets, have made their way into mainstream retail. They've shifted from a performance-centric branding to a more lifestyle-oriented approach. However, through collaborations with CrossFit affiliates and sponsorships of marathon events, these bars have managed to maintain their credibility among serious athletes. Glanbia's 2025 investor presentation showcased a notable 12% year-over-year uptick in performance nutrition sales. This surge is largely attributed to recreational trainers gravitating towards professional-grade supplementation. The category enjoys a 'halo effect': endorsements from elite athletes of certain brands often lead to casual exercisers mimicking their choices. This pattern not only boosts initial trials but also encourages repeat purchases across various demographic segments.
Clean-label and plant-based product innovation
In 2024, Ingredion launched VITESSENCE Pulse 1550, a textured pea protein that mimics the chew and mouthfeel of whey-based bars. This addresses a key technical barrier that has limited the adoption of plant-based products: texture. With this innovation, brands can reformulate their products without compromising on sensory quality. This breakthrough justifies the 15-20% cost premium of pea protein over traditional whey isolate. RXBAR, a notable player, is relaunching its plant line in 2025. The revamped line boasts enhanced binding systems, effectively eliminating the chalky aftertaste that plagued earlier versions. This move underscores that established brands are firmly entrenched in the plant-based segment, refusing to cede ground to emerging startups. In 2024, the Food and Drug Administration issued guidance on "plant-based" labeling claims. These guidelines mandate the disclosure of protein digestibility scores. While this move disqualifies certain marginal products that previously relied on vague marketing, it paradoxically bolsters the entire category. By enforcing transparency, the Food and Drug Administration's guidance fosters consumer trust. This newfound regulatory clarity is spurring institutional adoption. Corporate wellness buyers are now actively specifying plant-based options in their RFPs, catering to the diverse dietary needs of their employees.
Corporate wellness vending initiatives
Employers are outfitting break rooms with smart vending machines and micro-markets, prominently featuring protein bars. This strategy serves as a cost-effective wellness initiative, leading to reduced healthcare claims and lower absenteeism. By sidestepping traditional retail negotiations, brands can secure guaranteed placements in these venues. In return, they offer customized SKUs tailored to meet specific nutritional criteria set by employers. Typically, these criteria include a sugar cap of 5 grams and a protein delivery of at least 15 grams. This approach fosters brand loyalty: once employees become accustomed to a brand during work hours, they actively seek it out in retail settings, turning workplace sampling into a broader consumer demand. According to Canteen Vending's 2025 report, protein bars account for 18% of healthy vending sales, trailing only bottled water. Moreover, they boast margins 22% higher than traditional snacks, thanks to premium pricing and reduced spoilage. This trend is not just limited to Fortune 500 giants; mid-sized companies and university campuses are also embracing it. The expansion is fueled by comprehensive wellness platforms that integrate vending services with biometric screenings and fitness challenges.
Restraints Impact Analysis*
| Restraint | (~) % Impact on CAGR Forecast | Geographic Relevance | Impact Timeline |
|---|---|---|---|
| Emerging state-level sugar-tax legislation | -0.8% | United States (California, Washington, Colorado are considering), Canadian provinces | Medium term (2-4 years) |
| Volatile costs of nuts and specialty proteins | -1.1% | North America-wide, most acute for nut-based bar manufacturers | Short term (≤ 2 years) |
| Intense price competition is squeezing margins | -0.9% | The United States mass-market channel, spreading to Canada | Short term (≤ 2 years) |
| Reformulation losses from sugar-alcohol backlash | -0.6% | North America-wide, affecting keto-positioned products | Medium term (2-4 years) |
| Source: Mordor Intelligence | |||
Emerging state-level sugar-tax legislation
In California's 2025 legislative session, advocacy groups pushed for a statewide tax on sugar-sweetened beverages. Their new focus? Solid foods with over 10 grams of added sugars per serving. This move notably targets many protein bars, often marketed as snacks rather than meal replacements. Although the legislation faced hurdles, Washington and Colorado moved forward with similar initiatives. This has led to a patchwork of regulations, compelling national brands to either maintain multiple versions of their products or reformulate to meet the strictest standards. The challenge isn't evenly distributed: while large manufacturers can spread the costs of reformulation research and development over vast production volumes, regional brands grapple with potentially crippling expenses. Meanwhile, Canada's federal government has shied away from imposing a nationwide sugar tax. However, provinces like British Columbia and Quebec are eyeing taxes inspired by European models. These models notably exempt products that meet certain protein density thresholds, potentially giving an edge to protein bars over traditional sweets. Such regulatory uncertainties are stalling product development. Brands are wary of launching innovations that could be hit with hefty taxes in the next 18-24 months[2]Source: California Legislative Information, “AB 1234 Sugar-Sweetened Foods Tax,” leginfo.legislature.ca.gov.
Volatile costs of nuts and specialty proteins
In 2024-2025, almond prices fluctuated between USD 2.80 and USD 3.20 per pound, influenced by drought conditions in California and heightened export demand from Asia. This volatility squeezed the gross margins of nut-based bars that depend on almonds for both protein and texture. Similarly, peanut prices saw fluctuations, with the United States Department of Agriculture data highlighting a 17% year-over-year surge in Q1 2025, attributed to diminished plantings in the Southern US. While whey protein remained relatively stable, it encountered upward pressure due to robust cheese production and heightened demand from infant formula producers. Pea protein prices stayed high, hampered by a limited processing capacity in North America, concentrated in just three facilities. Brands with long-term supply contracts navigated this volatility adeptly. In contrast, those dependent on spot markets experienced a contraction in gross margins by 200-300 basis points. This predicament forced them to either raise prices, risking a potential drop in volume, or compress margins, limiting their marketing investments. As a countermeasure, vertical integration is gaining traction. Some manufacturers are either backward-integrating into nut processing or co-investing in pea protein fractionation plants, aiming to secure their supply and stabilize input costs.
*Our forecasts treat driver/restraint impacts as directional, not additive. The impact forecasts reflect baseline growth, mix effects, and variable interactions.
Segment Analysis
By Ingredient Base: Oat Formulations Capture Clean-Label Demand
Granola and oat-based bars are projected to grow at a 10.80% CAGR through 2031, outpacing other ingredient platforms. This growth is driven by consumers linking oats to heart health and whole-grain nutrition, aligning with clean-label demand. Nut-based bars, holding 46.96% of the 2025 market, face challenges like allergen concerns and price volatility. Brands are shifting to hybrid blends, reducing nut content while maintaining protein density with added isolates. Date-based bars, positioned in a premium niche, leverage dates' natural sweetness to avoid added sugars. However, their 8-10% CAGR growth is limited by high ingredient costs and low consumer familiarity outside health-food channels. Hybrid blends combining oats, nuts, and seeds are gaining traction, offering cost efficiency, nutrition, and taste. Brands like KIND are introducing multi-grain platforms to reduce ingredient sourcing risks.
The "Others" category, including rice crisps, quinoa, and novel grains, remains small but is attracting innovation investments as brands seek differentiation in a crowded market. The Food and Drug Administration's 2024 update to whole-grain labeling standards, requiring 51% whole-grain content by weight for front-of-pack claims, has accelerated reformulation toward oat and grain bases that meet the threshold without sacrificing protein content. This shift disadvantages nut-only bars reliant on protein isolates to meet macronutrient targets, creating an advantage for oat-forward formulations that deliver whole grains and protein in one system. Ingredient base segmentation is bifurcating: mass-market brands are adopting oat-grain platforms for cost and regulatory efficiency, while premium brands focus on single-origin nut varieties that command higher price points and appeal to ingredient purists.


By Source: Plant Proteins Narrow the Performance Gap
From 2026 to 2031, plant-based protein bars are set to surge at an 11.93% CAGR, nearly doubling the 6.5% growth rate of their animal-based counterparts. This trend is largely fueled by flexitarian consumers, who occasionally opt for plant-based choices without fully committing to veganism. In 2025, animal-based bars commanded a dominant 69.74% market share, benefiting from superior protein bioavailability and familiar taste. Whey isolate stands out, offering a complete amino acid profile and a neutral flavor that eases formulation. Yet, plant proteins are rapidly bridging the gap: a 2024 Journal of Nutrition study highlights that when paired with rice protein, pea protein achieves an impressive 89% digestibility (DIAAS score), nearing whey's 95% benchmark. This technical equivalence, coupled with a 20-30% reduction in greenhouse gas emissions per kilogram of protein, positions plant-based bars as prime candidates for institutional buyers, think universities, hospitals, and corporate cafeterias, especially under sustainability-driven procurement mandates.
Mainstream brands, wary of shifting consumer preferences and looming carbon pricing, are increasingly adopting hybrid formulations that meld whey with plant proteins. This strategy aims to strike a balance between cost, nutrition, and environmental impact. RXBAR's 2025 relaunch of its plant line, now boasting pea-rice blends for a better mouthfeel, underscores that established players are fiercely contesting the plant segment, previously seen as the domain of startups. Geographically, the segment's growth isn't uniform: while coastal US markets and urban centers in Canada lean towards plant-based bars, the US Midwest and Mexico, anchored in dairy traditions and with a limited awareness of plant proteins, still favor animal-based products. As a result, brands eyeing national distribution face the challenge of juggling dual SKU portfolios, a move that, while complex, broadens their consumer reach.
By Price Category: Premium Tier Captures Functional Innovation
Premium protein bars, while accounting for just 21.18% of the 2025 volume, are set to grow at an impressive 11.78% CAGR through 2031. This growth outpaces the mass segment's 9.2% increase. Brands are justifying price points of USD 3.50-5.00 for premium offerings, compared to USD 1.50-2.50 for mass-market bars, by incorporating functional ingredients, adaptogens, probiotics, MCT oil, and collagen. While mass-market profitability is squeezed by ingredient cost inflation, the premium tier remains largely insulated. This is largely because premium consumers prioritize efficacy over price. Mass-market bars, which commanded 78.82% of the 2025 share, focus on broad distribution and aggressive promotions. Their success largely hinges on prime checkout-aisle placements and enticing multi-pack discounts, both of which drive impulse buys and pantry stocking.
As mass brands roll out "premium sub-lines" priced between USD 2.50-3.00, featuring select functional ingredients, the price segmentation is becoming less distinct. This strategy allows mass brands to counter premiumization without undermining their core SKUs. Disrupting the mass segment, private-label protein bars from Costco and Trader Joe's, launched in 2024-2025, boast similar macronutrient profiles but at 30-40% discounts to branded counterparts. This pricing strategy has compelled national brands to ramp up trade spending, consequently denting their profitability. The premium segment's robustness highlights a notable consumer divide: while budget-conscious shoppers gravitate towards private labels, those with a wellness focus are opting for functional bars. This trend is eroding the middle tier, where traditional branded mass-market products once thrived. Brands lacking a distinct premium or value stance may find themselves grappling with dwindling margins and market share.
By Distribution Channel: Online Retail Reshapes Go-to-Market
Online retail stores are projected to grow at a 12.36% CAGR through 2031, making them the fastest-growing distribution channel. This surge is driven by consumers' appreciation for the convenience of auto-replenishment subscriptions and their access to niche brands that physical retail doesn't offer. While supermarkets and hypermarkets commanded 42.57% of the market share in 2025, they're grappling with challenges. Declining foot traffic and limited shelf space restrict their ability to diversify SKUs. As a result, brands are streamlining their offerings, honing in on top-selling flavors. Specialty and health stores, once the vanguards of innovation in the category, are finding their relevance waning. This shift comes as mainstream retailers broaden their natural and organic selections, diminishing the unique appeal of the specialty channel and leading to store closures in less prominent markets.
The "Other Distribution Channels" category, which includes convenience stores, gas stations, and vending machines, plays a pivotal role in capturing impulse buys and catering to on-the-go consumers. However, these channels' price sensitivity poses challenges for premium bars. Amazon's 2024 move to broaden its Subscribe and Save program now features protein bars, offering a 15% discount on repeat orders. This initiative has further fueled the growth of online channels. Additionally, partnerships with Instacart and DoorDash facilitate same-day deliveries from local retailers, effectively merging online and offline shopping experiences. While corporate wellness vending may be modest in volume, it boasts lucrative margins and heightened brand visibility. This exposure to a focused audience creates a ripple effect, boosting retail sales. As the distribution landscape becomes increasingly fragmented, brands find themselves needing a presence across 5-6 channels to fully engage consumers. This complexity in market entry favors larger players with specialized sales teams, sidelining regional brands that depend on distributors.
Geography Analysis
In 2025, the U.S. holds a dominant 64.43% market share, reflecting its strong fitness culture, advanced retail infrastructure, and affluent consumers favoring premium products. Canada, however, is growing rapidly with a 10.56% CAGR through 2031, driven by Health Canada's 2024 update on protein content claims. The revision allows products with 10 grams of protein per serving to use the "excellent source of protein" label, a standard most bars meet. This regulatory clarity has encouraged brands to emphasize protein messaging, attracting consumers who previously viewed bars as confectionery. USMCA provisions have removed tariff barriers, enabling U.S. brands to fulfill Canadian orders from domestic warehouses, capturing online demand without local distribution[3]Source: United States Trade Representative, “USMCA De Minimis Thresholds,” ustr.gov. Additionally, private-label growth in grocery, led by Loblaw and Sobeys' 2024-2025 protein bar launches, is expanding the market beyond specialty channels.
Mexico's protein bar market, though smaller, is accelerating as urbanization and rising middle-class incomes drive demand for convenient nutrition. COFEPRIS' 2024 regulatory alignment with Food and Drug Administration standards allows multinational brands to implement unified North American SKU strategies, reducing reformulation costs and easing market entry. Walmart de México's 2025 expansion of health and wellness shelf space, increasing protein bar and functional snack displays by 30%, highlights retailer confidence in the category. Mexican consumers favor chocolate and peanut butter flavors, prompting brands to adapt assortments while maintaining U.S.-aligned formulations. The rest of North America, including Caribbean and Central American markets under U.S. trade agreements, remains nascent but shows long-term growth potential as incomes rise and retail infrastructure improves.
Geographic analysis reveals a maturity gradient: the U.S. market is nearing saturation in traditional retail but growing in online and corporate wellness channels. Canada is expanding rapidly due to regulatory support and cross-border e-commerce, while Mexico offers significant opportunities for category development and brand building. Brands targeting North America must adopt tailored strategies: defend market share and drive premiumization in the U.S., invest in brand awareness and retail distribution in Canada, and focus on trial generation and flavor localization in Mexico. The USMCA framework supports this approach by enabling centralized U.S. manufacturing with tariff-free exports to Canada and Mexico, reducing costs and funding market-specific marketing. Digitally native brands can test products in the U.S., scale successful ones into Canada via e-commerce, and cautiously enter Mexico through retail partnerships after validating product-market fit.
Competitive Landscape
In North America, the protein bar market is moderately fragmented. The top five players, Mondelēz, General Mills, Kellanova, Simply Good Foods, and Mars, hold an estimated 45-50% market share. This leaves significant opportunities for regional brands and digitally native disruptors to carve out niche segments. Competitive intensity has surged as established confectionery giants harness their distribution strength and trade spending to safeguard shelf space. They're up against startups that are sidestepping traditional retail, opting instead for direct-to-consumer channels and savvy social media marketing. Established players are pursuing growth through mergers and acquisitions (notably, Ferrero's interest in Simply Good Foods) and extending their master brands into adjacent categories. Meanwhile, challengers are fortifying their positions with subscription models, influencer collaborations, and specialized formulations (like keto, paleo, and vegan) that not only command premium prices but also cultivate brand loyalty. There's a notable opportunity in functional bars that target specific health outcomes, like gut health, cognitive performance, and sleep support. With credible clinical validation, these bars could justify price points of USD 5-7, setting them apart from the commodity protein bar competition.
Disruptors such as Built Bar and No Cow are shaking up the status quo. They're leveraging Instagram-driven sampling campaigns, acquiring customers at a cost of USD 15-25 per conversion. This is a stark contrast to the traditional retail slotting fees and trade promotions, which can run between USD 40-60. Brands are increasingly turning to technology, with many adopting AI-driven flavor development platforms. These platforms are revolutionizing the industry by shortening research and development cycles from 18 months to just 6. This rapid adaptation to emerging trends not only minimizes the risk of slow-moving inventory but also positions brands at the forefront of the market.
A case in point is Abbott Nutrition's 2024 patent filing. They've developed a shelf-stable probiotic encapsulation system. This system can withstand bar processing temperatures and still deliver a potent 1 billion CFUs at expiration. Such technical innovations are crucial for brands aiming to credibly penetrate the functional segment and stand out from commodity protein bars that primarily compete on macronutrient profiles. The competitive landscape is shifting. It's moving away from a focus on distribution, where shelf space was king, to a realm where formulation, intellectual property, agile supply chains, and savvy customer data analytics are the keys to sustainable success.
North America Protein Bar Industry Leaders
Mondelēz International
General Mills Inc.
Kellanova
The Simply Good Foods Company
Mars Inc.
- *Disclaimer: Major Players sorted in no particular order


Recent Industry Developments
- January 2025: General Mills launched a new line of plant-based protein bars under its Lärabar brand, featuring organic pea protein and adaptogens including ashwagandha and lion's mane mushroom. The launch targets the functional wellness segment with bars positioned at USD 3.49 per unit, representing a 40% premium over core Lärabar SKUs and signaling the company's intent to capture premiumization trends while leveraging existing distribution relationships with natural and conventional retailers.
- November 2024: Simply Good Foods Company expanded its manufacturing capacity with a USD 45 million investment in a new production line at its facility in Monterrey, Mexico. The expansion increases annual capacity by 30% and positions the company to serve growing demand in Mexico while benefiting from USMCA tariff-free exports to the US and Canada, reducing landed costs and improving gross margins on cross-border shipments.
- September 2024: PepsiCo's Quaker Oats division partnered with Glanbia Performance Nutrition to co-develop a line of oat-based protein bars featuring Glanbia's whey isolate technology. The partnership combines Quaker's oat processing expertise with Glanbia's protein formulation capabilities, targeting the intersection of whole-grain and high-protein positioning that appeals to mainstream consumers seeking clean-label nutrition without specialty-store pricing.


North America Protein Bar Market Report Scope
A protein bar is a compact, portable snack food specifically formulated to deliver a concentrated dose of protein. The North America protein bar market is segmented by ingredient base, source, price category, distribution channel, and geography. By ingredient base, the market is segmented into nut-based, granola/oat-based, date-based, hybrid blends, and others. By source, the market is segmented into animal-based and plant-based. By price category, the market is segmented into mass and premium. By distribution channel, the market is segmented into supermarkets and hypermarkets, specialty and health stores, online retail, and other distribution channels. By geography, the market is segmented into the United States, Canada, Mexico, and the rest of North America. The Market Forecasts are Provided in Terms of Value (USD).
Ingredient Base
| Nut-based bars |
| Granola/Oat-based |
| Date-based |
| Hybrid blends |
| Others |
Source
| Animal-Based |
| Plant-Based |
Price Category
| Mass |
| Premium |
Distribution Channel
| Supermarkets and Hypermarkets |
| Specialty/Health Stores |
| Online Retail Stores |
| Other Distribution Channels |
Geography
| United States |
| Canada |
| Mexico |
| Rest of North America |
| Ingredient Base | Nut-based bars |
| Granola/Oat-based | |
| Date-based | |
| Hybrid blends | |
| Others | |
| Source | Animal-Based |
| Plant-Based | |
| Price Category | Mass |
| Premium | |
| Distribution Channel | Supermarkets and Hypermarkets |
| Specialty/Health Stores | |
| Online Retail Stores | |
| Other Distribution Channels | |
| Geography | United States |
| Canada | |
| Mexico | |
| Rest of North America |


Market Definition
- Milk and White Chocolate - Milk chocolates is a solid chocolate made with milk (in the form of either milk powder, liquid milk, or condensed milk) and cocoa solids. White chocolate is made from cocoa butter and milk and contains no cocoa solids whatsoever. The scope includes regular chocolates, low-sugar, and sugar-free variants
- Toffees & Nougats - Toffees include hard, chewy, and small or one-bite candies marketed with labels as toffee or toffee-like confectionery. Nougat is a chewy confection with almond, sugar, and egg white as a basic ingredient; and it originated in Europe and Middle East countries.
- Cereals Bars - A snack composed of breakfast cereal that has been compressed into a bar shape and is held together with a form of edible adhesive. The scope includes snack bars made with cereals such as rice, oats, corn, etc. mixed with a binding syrup. These also include products labeled as cereal bars, cereal treat bars, or grain bars.
- Chewing Gum - This is a preparation for chewing, usually made of flavored and sweetened chicle or such substitutes as polyvinyl acetate. The types of chewing gums included in the scope are sugar-chewing gums and sugar-free chewing gums
| Keyword | Definition |
|---|---|
| Dark Chocolate | Dark chocolate is a form of chocolate containing cocoa solids and cocoa butter without the milk. |
| White Chocolate | White chocolate is the type of chocolate containing the highest percentage of milk solids, typically around or over 30 percent. |
| Milk Chocolate | Milk chocolate is made from dark chocolate that has a low cocoa solid content and higher sugar content, plus a milk product. |
| Hard Candy | A candy made of sugar and corn syrup boiled without crystallizing. |
| Toffees | A hard, chewy, often brown sweet that is made from sugar boiled with butter. |
| Nougats | A chewy or brittle candy containing almonds or other nuts and sometimes fruit. |
| Cereal bar | A cereal bar is a bar-shaped food product, made by pressing cereals and usually dried fruit or berries, which are in most cases held together by glucose syrup. |
| Protein bar | Protein bars are nutrition bars that contain a high proportion of protein to carbohydrates/fats. |
| Fruit & Nut bar | These are often based on dates with other dried fruit and nut additions and, in some cases, flavorings. |
| NCA | The National Confectioners Association is an American trade organization that promotes chocolate, candy, gum and mints, and the companies that make these treats. |
| CGMP | Current good manufacturing practices are those conforming to the guidelines recommended by relevant agencies. |
| Unstandardized foods | Unstandardized foods are those that do not have a standard of identity or that deviate from a prescribed standard in any manner. |
| GI | The glycemic index (GI) is a way of ranking carbohydrate-containing foods based on how slowly or quickly they are digested and increase blood glucose levels over a period of time |
| Skimmed milk powder | Skimmed milk powder is obtained by removing water from pasteurized skim milk by spray-drying. |
| Flavanols | Flavanols are a group of compounds found in cocoa, tea, apples, and many other plant-based foods and beverages. |
| WPC | Whey protein concentrate- the substance obtained by the removal of sufficient nonprotein constituents from pasteurized whey so that the finished dry product contains greater than 25% protein. |
| LDL | Low density Lipoprotein- the bad cholesterol |
| HDL | High density Lipoprotein- the good cholesterol |
| BHT | butylated Hydroxytoluene is a lab-made chemical that is added to foods as a preservative. |
| Carrageenan | Carrageenan is an additive used to thicken, emulsify, and preserve foods and drinks. |
| Free form | Not containing certain ingredients, such as gluten, dairy, or sugar. |
| Cocoa butter | It is a fatty substance obtained from cocoa beans, used in the manufacture of confectionery. |
| Pastellies | A type of of Brazilian candy made from sugar, eggs, and milk. |
| Draggees | Small, round candies that are coated with a hard sugar shell |
| CHOPRABISCO | Royal Belgian Association of the chocolate, pralines, biscuit, and confectionery industry- A trade association that represents the Belgian chocolate industry. |
| European Directive 2000/13 | A European Union directive that regulates the labeling of food products |
| Kakao-Verordnung | The German chocolate ordinance, a set of regulations that define what can be labeled as "chocolate" in Germany. |
| FASFC | Federal Agency for the Safety of the Food Chain |
| Pectin | A natural substance that is derived from fruits and vegetables. It is used in confectionery to create a gel-like texture. |
| Invert sugars | A type of sugar that is made up of glucose and fructose. |
| Emulsifier | A substance that helps to mix to liquids that does not mix together. |
| Anthocyanins | A type of flavonoid that is responsible for the red, purple, and blue colors of confectionery. |
| Functional Foods | Foods that have been modified to provide additional health benefits beyond basic nutrition. |
| Kosher certificate | This certification verifies that the ingredients, production process including all machinery, and/or food-service process complies with the standards of Jewish dietary law |
| Chicory root extract | A natural extract from the chicory root that is a good source of fiber, calcium, phosphorous, and folate |
| RDD | Recommended daily dose |
| Gummies | A chewy gelatin-based candy that is often flavored with fruit. |
| Nutraceuticals | Food or dietary supplements that are claimed to have health benefits. |
| Energy bars | Snack bars that are high in carbohydrates and calories are designed to provide energy on the go. |
| BFSO | Belgian Food Safety Organization for the food chain. |


Research Methodology
Mordor Intelligence follows a four-step methodology in all our reports.
- Step-1: Identify Key Variables: In order to build a robust forecasting methodology, the variables and factors identified in Step 1 are tested against available historical market numbers. Through an iterative process, the variables required for market forecast are set, and the model is built on the basis of these variables.
- Step-2: Build a Market Model: Market-size estimations for the forecast years are in nominal terms. Inflation is not a part of the pricing, and the average selling price (ASP) is kept constant throughout the forecast period for each country.
- Step-3: Validate and Finalize: In this important step, all market numbers, variables, and analyst calls are validated through an extensive network of primary research experts from the market studied. The respondents are selected across levels and functions to generate a holistic picture of the market studied.
- Step-4: Research Outputs: Syndicated Reports, Custom Consulting Assignments, Databases & Subscription Platforms


