Market Overview
| Study Period | 2020 - 2031 |
|---|---|
| Market Size (2026) | USD 163.97 Billion |
| Market Size (2031) | USD 218.81 Billion |
| Growth Rate (2026 - 2031) | 5.94% CAGR |
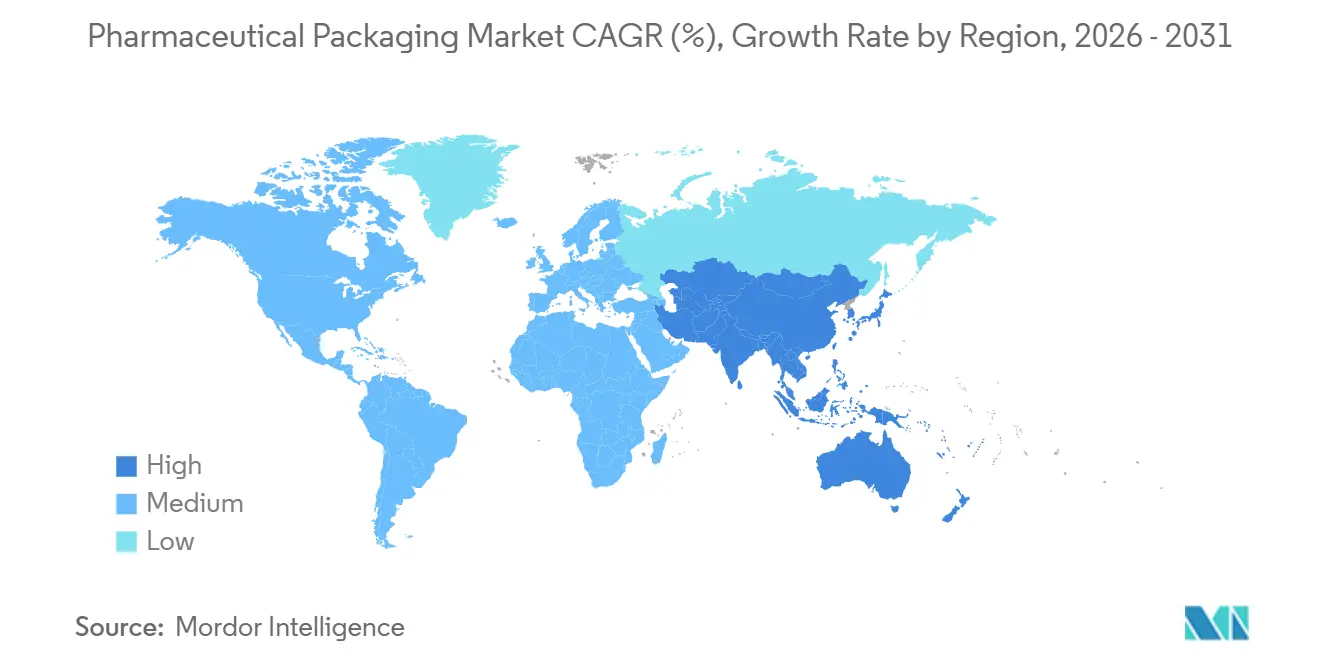
| Fastest Growing Market | Asia-Pacific |
| Largest Market | North America |
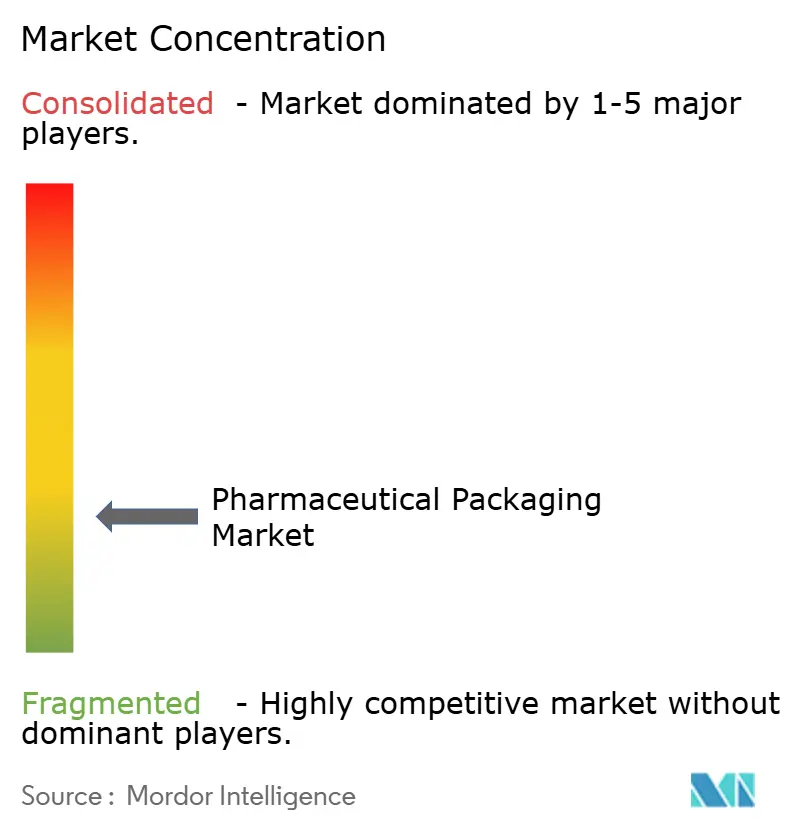
| Market Concentration | Low |
Major Players *Disclaimer: Major Players sorted in no particular order Image © Mordor Intelligence. Reuse requires attribution under CC BY 4.0. | |
Pharmaceutical Packaging Market Analysis by Mordor Intelligence
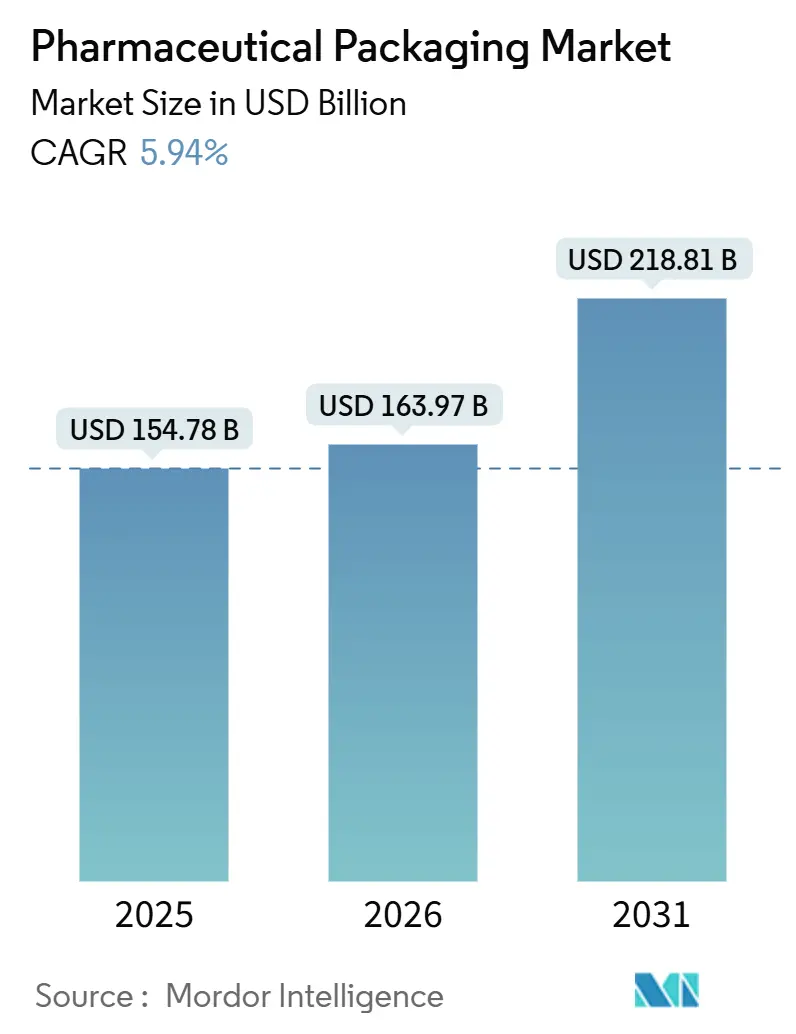
The pharmaceutical packaging market size is projected to be USD 154.78 billion in 2025, USD 163.97 billion in 2026, and reach USD 218.81 billion by 2031, growing at a CAGR of 5.94% from 2026 to 2031. Rising life expectancy, the rapid shift toward biologics and injectables, and stringent serialization rules are boosting volumes and unit values across all major formats. Plastics continue to dominate the pharmaceutical packaging market, yet paper and paperboard alternatives are scaling quickly as sustainability mandates tighten. Prefilled syringes are gaining traction because they simplify at-home treatment and reduce infusion-center costs, while contract development and manufacturing organizations (CDMOs) are winning share through asset-light outsourcing models. Regional growth is broad-based, but Asia-Pacific now sets the pace thanks to targeted industrial incentives and expanding local fill-finish capacity.
Key Report Takeaways
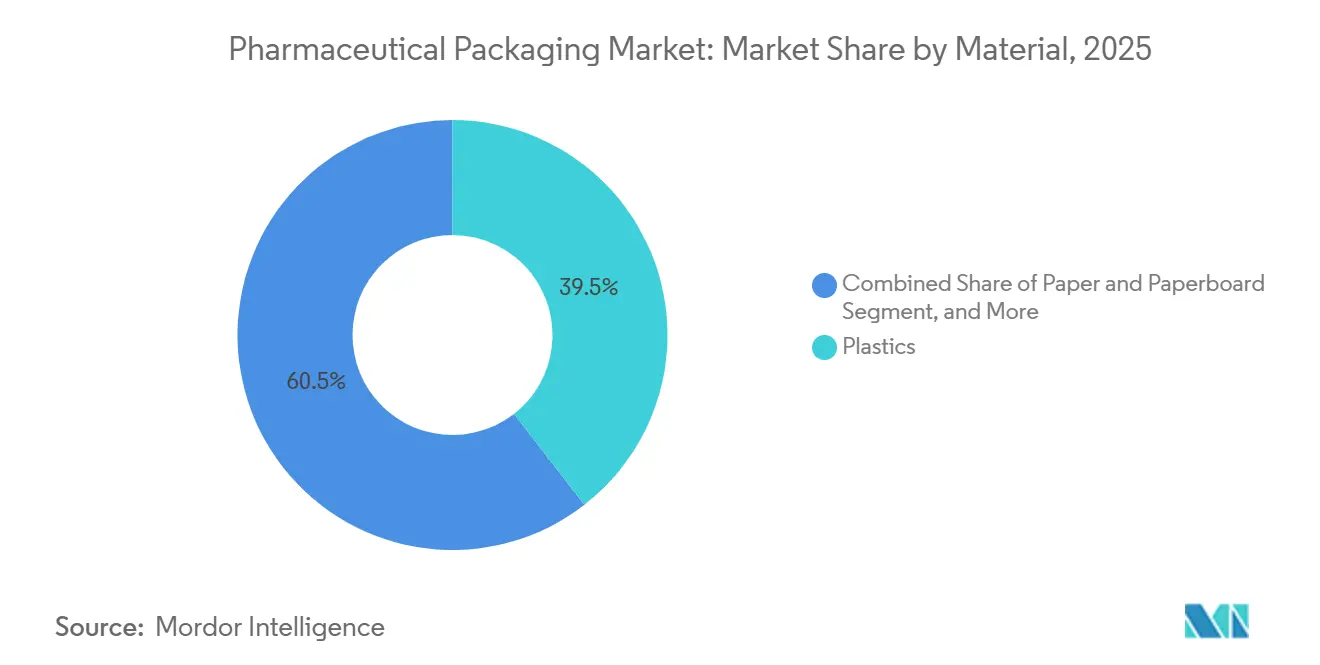
- By material, plastics retained 39.47% of the 2025 pharmaceutical packaging market share, whereas paper and paperboard are forecast to expand at a 6.96% CAGR through 2031.
- By packaging level, primary formats held 62.41% of the 2025 volume, but tertiary solutions are projected to grow fastest at 6.54% through 2031.
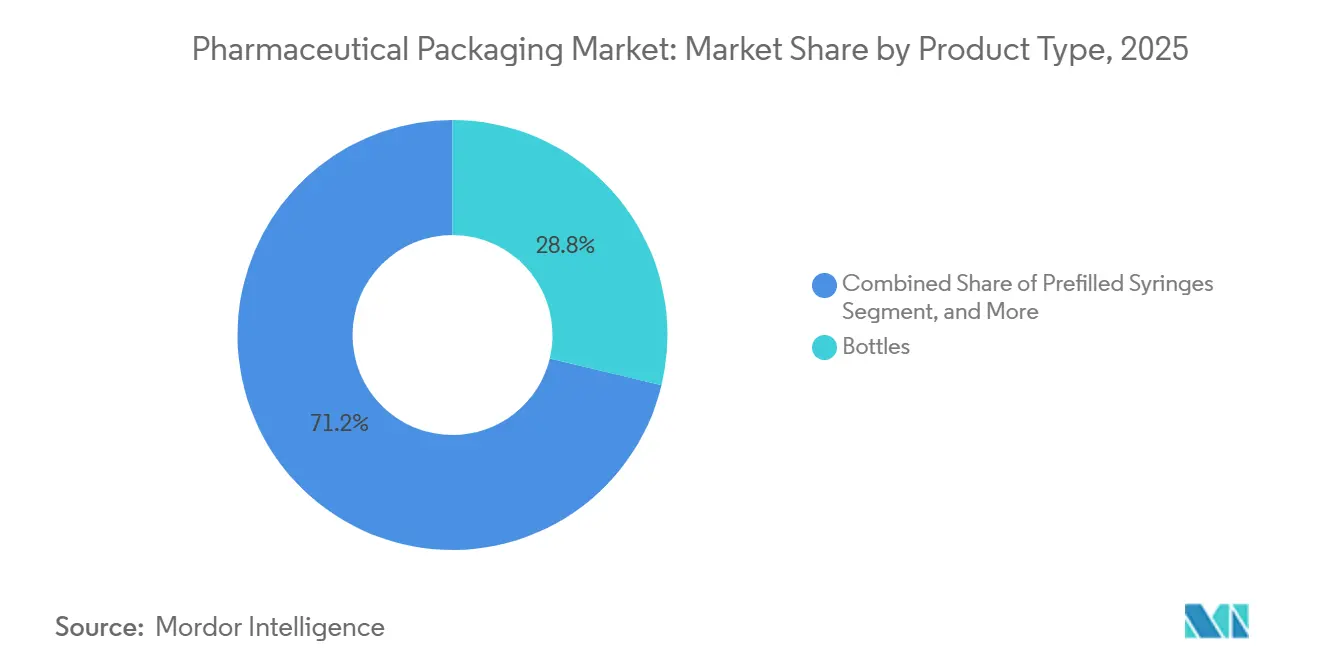
- By product type, bottles accounted for 28.76% of revenue in 2025, while prefilled syringes are expected to post a 7.33% CAGR through 2031.
- By end-user, pharmaceutical companies accounted for 71.38% demand in 2025, yet CDMOs are set to rise at a 6.73% CAGR over the same horizon.
- By geography, North America led with a 34.27% share in 2025, although Asia-Pacific is predicted to accelerate at 6.91% through 2031.
Note: Market size and forecast figures in this report are generated using Mordor Intelligence’s proprietary estimation framework, updated with the latest available data and insights as of January 2026.
Global Pharmaceutical Packaging Market Trends and Insights
Drivers Impact Analysis
| Driver | (~) % Impact on CAGR Forecast | Geographic Relevance | Impact Timeline |
|---|---|---|---|
| Aging Population and Chronic Disease Prevalence | +1.2% | Global, with concentration in North America, Europe, and Japan | Long term (≥ 4 years) |
| Biologics and Injectable Pipeline Expansion | +1.5% | North America and Europe lead; Asia-Pacific manufacturing scale-up | Medium term (2-4 years) |
| Sustainability-Driven Material Substitution | +0.9% | Europe and North America; emerging momentum in Asia-Pacific | Medium term (2-4 years) |
| Digital Traceability Mandates (e.g., DSCSA, EU-FMD) | +1.0% | North America and Europe; phased rollout in Middle East and South America | Short term (≤ 2 years) |
| AI-Enabled Adaptive Fill-Finish Lines | +0.7% | North America and Europe; pilot deployments in China and India | Medium term (2-4 years) |
| Rise of At-Home and Decentralized Trials Needing Mail-Ready Packs | +0.6% | North America and Europe; expanding to Asia-Pacific urban centers | Short term (≤ 2 years) |
| Source: Mordor Intelligence | |||
Understand The Key Trends Shaping This Market
Download PDF
Aging Population and Chronic Disease Prevalence
Longer life expectancy is raising daily prescription counts and fueling demand for senior-friendly bottles, calendar blisters, and easy-open closures. The World Health Organization projects that adults aged 60 and older will reach 22% of the global population by 2050, up from 13% in 2020.[1]World Health Organization, “Ageing and Health,” who.int In Japan, where 41% of citizens aged 75 or older had 5 or more concurrent prescriptions in 2024, regulators now endorse multi-medication blister packs to curb dosing errors. Packaging engineers are meeting ISO 8317 child-resistance requirements while reducing the required grip torque, ensuring seniors can access medicines without tools. Because chronic therapies are consumed daily over decades, demographic aging locks in a structurally higher baseline for primary-packaging volumes through 2031.
Biologics and Injectable Pipeline Expansion
Large molecules dominate new approvals, accounting for 28 of 55 U.S. novel clearances in 2024, including 14 biologics and 14 biosimilars.[2]U.S. Food and Drug Administration, “Novel Drug Approvals 2024,” fda.gov These injectables require Type I borosilicate vials and cyclic olefin syringes that minimize extractables and tolerate cold-chain storage. Prefilled syringes eliminate reconstitution steps and enable self-administration, lifting Becton, Dickinson and Company’s syringe shipments by 11% in fiscal 2025. Cell and gene therapies add premium demand for cryogenic vials and minus-80 °C shippers. Altogether, the injectable surge shifts sales toward higher-margin containers, lifting revenue faster than unit growth across the pharmaceutical packaging market.
Sustainability-Driven Material Substitution
Regulatory and brand pressure are steering procurement away from hard-to-recycle laminates toward mono-material polymers and fiber solutions. The European Union’s 2024 Packaging and Packaging Waste Regulation mandates full recyclability by 2030, with interim recycled-content targets beginning in 2027.[3]European Commission, “Packaging and Packaging Waste Regulation,” ec.europa.eu Amcor responded in February 2025 by commercializing a mono-material PET-G blister that meets moisture-barrier requirements and can be recycled in conventional PET streams. Pharmaceutical buyers are also migrating secondary cartons to certified paperboard with water-based inks. As multinational specifications cascade globally, converters that validate sustainable substrates early are capturing share and defending margins.
Digital Traceability Mandates
Unit-level serialization is compulsory in the United States under the Drug Supply Chain Security Act and in Europe under the Falsified Medicines Directive. Deloitte estimates mid-sized pharmaceutical firms spent USD 8 million–15 million each on serialization systems between 2021 and 2024. Label and carton vendors now embed RFID or NFC chips to enable real-time authentication, converting compliance into value-added service. Aggregated data streams improve diversion detection and inventory planning, enabling turnkey providers to maintain preferred-supplier status despite price pressure.
Restraints Impact Analysis
| Restraint | (~) % Impact on CAGR Forecast | Geographic Relevance | Impact Timeline |
|---|---|---|---|
| Petro-Derivative Resin Price Volatility | -0.8% | Global, with acute exposure in Asia-Pacific and Middle East | Short term (≤ 2 years) |
| Capital-Intensive Sterility and Validation Requirements | -0.6% | North America and Europe; barrier to entry in emerging markets | Long term (≥ 4 years) |
| Looming PFAS/Fluoropolymer Restrictions in EU and US | -0.5% | Europe and select U.S. states; spillover to export-oriented manufacturers | Medium term (2-4 years) |
| Cybersecurity Vulnerabilities in Connected Packaging Equipment | -0.3% | North America and Europe; growing concern in Asia-Pacific | Short term (≤ 2 years) |
| Source: Mordor Intelligence | |||
Petro-Derivative Resin Price Volatility
High-density polyethylene spot prices on the U.S. Gulf Coast swung from USD 0.52 to USD 0.68 per pound between January 2024 and December 2025, a 31% range that compressed converter margins and forced quarterly passthrough talks. Smaller processors lacking hedging tools see profit erased when costs spike mid-contract. Volatility chills capital spending on plastics-heavy lines and accelerates interest in fiber- or bio-based polyethylene, even though bio-resins still carry a 15%–25% premium. Until feedstock swings subside or sustainable alternatives reach cost parity, resin turbulence will drag on plastics segments of pharmaceutical packaging.
Capital-Intensive Sterility and Validation Requirements
Establishing an ISO Class 7 cleanroom for elastomer closures costs USD 40 million–60 million, excluding the 18–24 months of validation required by regulators, according to West Pharmaceutical Services’ 2024 annual report. Such steep outlays deter new entrants and favor incumbents with strong cash flow and pre-qualified recipes. ISO 15378 and updated United States Pharmacopeia chapters add layers of documentation and extractables testing, making even minor material tweaks costly and slow. The resulting high barriers limit the availability of sterile primary packaging and raise the risk of supply shortages when biologic demand surges.
Segment Analysis
By Material: Paperboard Rises on Circularity Goals
Plastics retained 39.47% of the 2025 pharmaceutical packaging market share, anchored by high-density polyethylene bottles, flexible low-density pouches, and clear polyethylene terephthalate (PET) containers that meet extraction limits for over-the-counter drugs. Glass, metal, and emerging biopolymers round out the mix, yet shifting regulatory sentiment is beginning to cap incremental gains in plastic. Paper and paperboard, meanwhile, are advancing at a 6.96% CAGR because Europe’s Packaging and Packaging Waste Regulation requires every pack to be recyclable by 2030, pushing brands toward fiber-based cartons that slot into existing curbside systems. Resin converters are responding with mono-material PET-G blister webs to preserve barrier integrity without aluminum, though cost premiums persist.
The tilt toward circularity bolsters demand for certified paperboard and water-based inks that preserve fiber quality in reuse loops. Converters capable of validating these substrates quickly now command preferred-supplier status on global tenders, and their revenue increases outstrip the broader pharmaceutical packaging market size. Glass suppliers are also capturing upside from biologics, as Type I borosilicate vial orders grew 9% in 2025 on the back of messenger RNA vaccine fills. Metals continue to serve aerosol inhalers and ointment tubes, while biopolymers attract pilot-scale trials for clinical-study kits where cost sensitivity is lower. Material choice accordingly reflects a dual mandate of functional barrier and end-of-life value, reshaping sourcing strategies through 2031.
Note: Segment shares of all individual segments available upon report purchase
Get Detailed Market Forecasts at the Most Granular Levels
Download PDF
By Packaging Level: Tertiary Formats Accelerate With Direct-to-Patient Logistics
Primary containers captured 62.41% of the 2025 pharmaceutical packaging market, covering bottles, vials, ampoules, syringes, and blister cavities that directly contact drug products. Their dominance endures because sterility, barrier, and dosing accuracy start at the primary layer. Secondary elements cartons, sleeves, labels, and inserts grow in lockstep as serialization codes and multilingual directions enlarge printable real estate. Digital presses now support run lengths of one, trimming obsolete inventory and accelerating global launches.
Tertiary solutions are expanding fastest at a 6.54% CAGR, propelled by decentralized clinical trials and specialty-pharmacy home delivery that turn every treatment course into its own parcel. Temperature-monitoring labels, tamper-evident seals, and molded cushions have become standard, elevating corrugated shippers beyond commodity status. The per-shipment uplift means each parcel carries a higher bill of materials, enlarging the pharmaceutical packaging market share for tertiary vendors even as volumes shift away from bulk pallet loads. As direct-to-patient flows scale, integrated suppliers that offer validated cold-chain shippers, data loggers, and returns kits capture disproportionate value.
By Product Type: Prefilled Syringes Capture Self-Injection Momentum
Bottles accounted for 28.76% of 2025 revenue, supplying high-volume solid orals, liquids, and suspensions; however, growth is slowing as hospitals favor unit-dose blisters that trim nursing time. Prefilled syringes are projected to advance at a 7.33% CAGR, the fastest of any format, as biologic drugs shift treatment from infusion chairs to the home. Cyclic olefin polymer barrels avoid tungsten residues and accommodate high-viscosity antibodies, while built-in needle safety meets needlestick directives, boosting adoption among payers and providers alike.
Vials and ampoules remain critical for lyophilized or personalized batches that require post-fill manipulations. Ready-to-use sterile vials help sponsors avoid in-house washing, a factor behind double-digit demand growth for Stevanato’s EZ-fill lines. Blisters secure mid-teens share by combining moisture protection with adherence prompts such as calendar graphics. Caps and closures, though a smaller value pool, safeguard integrity through torque consistency and liner compatibility. Tubes and pouches continue to serve topical creams and ophthalmic solutions, where aluminum’s barrier outweighs the complexity of recycling. Product-mix evolution thus favors devices that enhance safety and convenience, reinforcing revenue expansion ahead of pure volume growth in the pharmaceutical packaging market.
Note: Segment shares of all individual segments available upon report purchase
Get Detailed Market Forecasts at the Most Granular Levels
Download PDF
By End-User: CDMOs Outpace Innovator Volumes
Pharmaceutical innovators accounted for 71.38% of 2025 demand, still producing most high-volume small molecules and legacy biologics in-house. Even so, asset-light strategies are redirecting new modality work to contract development and manufacturing organizations (CDMOs). These partners grow at a 6.73% CAGR as they absorb fill-finish for cell therapies, gene therapies, and messenger RNA vaccines, each requiring specialized containment and cryogenic logistics. Catalent’s biologics segment, for instance, reported 14% revenue growth in 2025, well above the group average.
Research institutes and government labs occupy a smaller slice but drive early-stage customized formats produced in hundreds rather than millions of units. Veterinary and nutraceutical manufacturers adopt pharmaceutical-grade packs to meet export regulations, pushing volumes toward suppliers that can flex run sizes without compromising GMP. CDMO ascendance shifts procurement toward partners offering turnkey validation, rapid scale, and modular lines, increasing their pharmaceutical packaging market share relative to incumbent drug makers. Suppliers that tailor minimum order quantities and invest in quick-change tooling now earn a disproportionate share of outsourcing spend.
Geography Analysis
North America led the pharmaceutical packaging market in 2025 with a 34.27% share, anchored by biologics leadership, strict traceability enforcement, and high per-capita drug spend. United States Pharmacopeia revisions that tightened elastomer extractables drove temporary supply shortages and price spikes, but also spurred domestic investments in modern closure lines. The United States remains the single largest buyer of prefilled syringes, while Canada benefits from proximity, sourcing glass vials and cartons across an integrated North American corridor.
Europe ranks second, combining sustainability regulation with a robust biosimilars pipeline. Germany’s regulator now allows recycled PET in secondary packs but insists on virgin resin for sterile primary containers, creating a bifurcated demand pattern that converters must navigate. The region’s strong hospital infrastructure supports high adoption of calendar blisters and unit-dose systems, further diversifying format mix.
Asia-Pacific is the fastest-growing region, with growth of 6.91% through 2031. India’s production-linked incentive plan reimburses capital outlays for local fill-finish lines, unlocking new orders for Type I vials and tamper-evident cartons. China’s volume-based procurement favors domestic manufacturers that can supply serialized packs at lower cost, accelerating investments in digital presses and QR-enabled labels. Southeast Asian nations, led by Thailand and Vietnam, are adopting serialization to secure export approvals, thereby expanding the addressable pharmaceutical packaging market. South America shows steady growth, chiefly Brazil’s push for local generics that rely on cost-efficient blister machinery. The Middle East and Africa remain small but strategic as Gulf Cooperation Council states earmark funds for self-sufficiency; the United Arab Emirates’ USD 500 million Abu Dhabi hub exemplifies the ambition.
Get Analysis on Important Geographic Markets
Download PDF
Competitive Landscape
The pharmaceutical packaging industry displays moderate concentration; the top ten suppliers capture roughly 35% to 40% of global revenue. Glass tubing for vials is dominated by a handful of integrated players that own proprietary furnace technology, while plastics encompass hundreds of regional converters. Recent moves tilt toward vertical integration: resin giants are buying converters to secure offtake, and closure makers are adding syringe assembly to win single-vendor biologic contracts.
Technology sets the new bar. Artificial-intelligence vision systems boost defect detection to below 10 parts per million, critical for high-value monoclonal antibody fills. West Pharmaceutical’s 2024 patent filing on predictive elastomer delamination exemplifies process-data differentiation. Concurrently, fluoropolymer-lined closures face regulatory uncertainty as PFAS bans loom, spurring R&D into polyolefin elastomer alternatives.
Smart packaging is a white space. NFC-enabled labels now authenticate products and prompt adherence reminders, drawing competition from electronics firms unfamiliar with GMP. Biopolymer startups chase compostable blister packs but remain cost-constrained. Overall, incumbents have strong validation track records and global footprints; newcomers must address both cost and compliance to penetrate the pharmaceutical packaging market.
Pharmaceutical Packaging Industry Leaders
Amcor plc
Gerresheimer AG
Schott AG
AptarGroup Inc.
Nipro Corporation
- *Disclaimer: Major Players sorted in no particular order
Need More Details on Market Players and Competitors?
Download PDF
Recent Industry Developments
- January 2026: Gerresheimer AG commissioned a EUR 120 million (USD 135 million) Type I vial plant in Pune, India, adding 1.2 billion units of annual capacity.
- December 2025: Amcor plc acquired a German specialty-label maker, integrating RFID and tamper-evident technologies into its European portfolio.
- November 2025: Schott AG and Corning Incorporated signed a joint agreement to co-develop alkali-free borosilicate tubing for prefilled syringes, with pilot output slated for 2027.
- October 2025: AptarGroup Inc. launched a Bluetooth-enabled connected-dose inhaler platform after U.S. FDA 510(k) clearance.
Global Pharmaceutical Packaging Market Report Scope
The Pharmaceutical Packaging Market Report is Segmented by Material (Plastics, Glass, Metal, Paper and Paperboard, Biopolymers and Other Materials), Packaging Level (Primary Packaging, Secondary Packaging, Tertiary Packaging), Product Type (Bottles, Prefilled Syringes, Vials and Ampoules, Blister Packs, Caps and Closures, Tubes and Pouches, Other Product Types), End-User (Pharmaceutical Companies, Contract Development and Manufacturing Organizations, Research Institutes, Other End-Users), and Geography (North America, South America, Europe, Asia-Pacific, Middle East and Africa). Market Forecasts are Provided in Terms of Value (USD).
By Material
| Plastics | HDPE |
| LDPE and LLDPE | |
| PET | |
| Other Plastics | |
| Glass | Type I Borosilicate |
| Type II Treated Soda-Lime | |
| Type III Soda-Lime | |
| Metal | |
| Paper and Paperboard | |
| Biopolymers and Other Materials |
By Packaging Level
| Primary Packaging | Bottles |
| Prefilled Syringes | |
| Vials and Ampoules | |
| Blister Packs | |
| Secondary Packaging | Cartons and Sleeves |
| Labels and Inserts | |
| Tertiary Packaging | Corrugated Shippers |
| Pallets and Protective Systems |
By Product Type
| Bottles |
| Prefilled Syringes |
| Vials and Ampoules |
| Blister Packs |
| Caps and Closures |
| Tubes and Pouches |
| Other Product Types |
By End-User
| Pharmaceutical Companies |
| Contract Development and Manufacturing Organizations |
| Research Institutes |
| Other End-Users |
By Geography
| North America | United States | |
| Canada | ||
| Mexico | ||
| South America | Brazil | |
| Argentina | ||
| Rest of South America | ||
| Europe | United Kingdom | |
| Germany | ||
| France | ||
| Italy | ||
| Rest of Europe | ||
| Asia Pacific | China | |
| Japan | ||
| India | ||
| South Korea | ||
| Rest of Asia Pacific | ||
| Middle East and Africa | Middle East | United Arab Emirates |
| Saudi Arabia | ||
| Rest of Middle East | ||
| Africa | South Africa | |
| Egypt | ||
| Rest of Africa | ||
| By Material | Plastics | HDPE | |
| LDPE and LLDPE | |||
| PET | |||
| Other Plastics | |||
| Glass | Type I Borosilicate | ||
| Type II Treated Soda-Lime | |||
| Type III Soda-Lime | |||
| Metal | |||
| Paper and Paperboard | |||
| Biopolymers and Other Materials | |||
| By Packaging Level | Primary Packaging | Bottles | |
| Prefilled Syringes | |||
| Vials and Ampoules | |||
| Blister Packs | |||
| Secondary Packaging | Cartons and Sleeves | ||
| Labels and Inserts | |||
| Tertiary Packaging | Corrugated Shippers | ||
| Pallets and Protective Systems | |||
| By Product Type | Bottles | ||
| Prefilled Syringes | |||
| Vials and Ampoules | |||
| Blister Packs | |||
| Caps and Closures | |||
| Tubes and Pouches | |||
| Other Product Types | |||
| By End-User | Pharmaceutical Companies | ||
| Contract Development and Manufacturing Organizations | |||
| Research Institutes | |||
| Other End-Users | |||
| By Geography | North America | United States | |
| Canada | |||
| Mexico | |||
| South America | Brazil | ||
| Argentina | |||
| Rest of South America | |||
| Europe | United Kingdom | ||
| Germany | |||
| France | |||
| Italy | |||
| Rest of Europe | |||
| Asia Pacific | China | ||
| Japan | |||
| India | |||
| South Korea | |||
| Rest of Asia Pacific | |||
| Middle East and Africa | Middle East | United Arab Emirates | |
| Saudi Arabia | |||
| Rest of Middle East | |||
| Africa | South Africa | ||
| Egypt | |||
| Rest of Africa | |||
Need A Different Region or Segment?
Customize Now
Key Questions Answered in the Report
How large will global spending on pharmaceutical packaging be by 2031?
The pharmaceutical packaging market size is forecast to reach USD 218.81 billion by 2031, supported by a 5.94% CAGR from 2026.
Which packaging material is growing fastest?
Paper and paperboard formats are projected to expand at a 6.96% CAGR because recyclability mandates favor fiber solutions over multi-material plastics.
Why are prefilled syringes gaining share?
Prefilled syringes support self-administration, cut dosing errors, and align with biologic drug attributes, causing a 7.33% projected CAGR through 2031.
What drives tertiary-packaging demand?
Decentralized clinical trials and direct-to-patient delivery increase parcel shipments, lifting tertiary corrugated-shipper volumes at a 6.54% rate.
Which region will post the highest growth?
Asia-Pacific is set to grow fastest at 6.91% because industrial incentives in India and China boost local fill-finish and serialization capacity.
How concentrated is supplier power?
The market scores 6 on a 1-10 scale, meaning moderate concentration where the top five players hold roughly 40% share but competition remains active.


